Serviços Personalizados
Journal
artigo
Indicadores
Compartilhar
Revista Psicologia Organizações e Trabalho
versão On-line ISSN 1984-6657
Rev. Psicol., Organ. Trab. v.6 n.1 Florianópolis jun. 2006
ARTIGOS
Context-sensitive multidimensional ranking: an alternative technique to data complexity
Ordenamento multidimensional sensível ao contexto: uma técnica alternativa para dados complexos
Weber MartinsI; Laura Eugênio Guimarães NaliniII; Fernando Pirkel TsukaharaIII
IPh.D. Universidade Federal de Goiás, Escola de Engenharia Elétrica e de Computação, Grupo PIRENEUS de Pesquisa em Redes Neurais. Universidade Católica de Goiás, Departamento de Psicologia, Laboratório de Análise Experimental do Comportamento (weber@eee.ufg.br).
IIDoutor Universidade Católica de Goiás, Departamento de Psicologia, Laboratório de Análise Experimental do Comportamento.(legn@ucg.br)
IIIMestre. Universidade Federal de Goiás, Escola de Engenharia Elétrica e de Computação, Grupo PIRENEUS de Pesquisa em Redes Neurais (fernandopirkel@yahoo.com.br)
ABSTRACT
Many applications, as comparison among products represented by a large number of attributes, require ordering of instances represented by high dimensional vectors. Despite the reasonable quantity of papers on classification and clustering, papers on multidimensional ranking are rare. This paper expands a generic neurogenetic ranking procedure based on one-dimensional Self-Organizing Maps (SOMs). Their typical similarity metric is modified to a weighted Euclidean metric and automatically adjusted by a genetic algorithm, a heuristic search (optimization) technique. The search goal is the best ranking that matches the desired probability distribution (provided by experts) leading to a context-sensitive metric. In order to ease expert agreement, the technique relies on consensus about the best and worst instances only. In addition to providing a ranking, the derived metric is also useful for reducing the number of dimensions (questionnaire items in some situations) and for modeling the data source. In practical terms, a technique to convert subjective knowledge into objective scores is presented, creating a specific and operational model capable to deal with new situations. This technique is exemplified by two cases: ranking of data from blood bank inspections and client segmentation in agribusiness. On the theoretical point ofview, instead, the proposed system has presented a way to stabilize results from SOMs by imposing expert constraints, leading to context-sensitive multidimensional ranking. Despite the fact that SOMs are a class of artificial neural networks, they are radically different from the neural model usually employed in Business and Economics studies, the multilayer perceptron with backpropagation training algorithm. The main objective of this article is, therefore, to present a powerful combination of techniques originated in Artificial Intelligence - a multidisciplinary field more related to Engineering than to Mathematics, where Statistics has its origins and deductive basis.
Keywords: ranking, Self-Organizing Map; Genetic Algorithm; multidimensionality; data reduction.
RESUMO
Muitas aplicações, como a comparação entre produtos representados por um grande número de atributos, requerem a ordenação de dados representados por vetores de alta dimensionalidade. A despeito da razoável quantidade de artigos nas áreas de classificação e agrupamento, trabalhos em ranking multidimensional são raros. Este artígo expande um procedimento neurogenético genérico de ordenação baseado em mapas auto-organizáveis (SOMs) unidimensionais. A métrica típica de similaridade, distância euclidiana, é modificada para uma distância euclidiana ponderada, sendo automaticamente ajustada através de busca com uso de algoritmos genéticos, uma técnica heurística de busca (optimização). O objetivo da busca é encontrar a ponderação cujo ranking melhor se ajusta aos critérios solicitados por especialistas, conduzindo a métricas sensíveis ao contexto. Para facilitar o acordo entre especialistas, a técnica sustenta-se no consenso sobre o melhor e o pior dado somente. Além da tarefa de ordenação, a métrica derivada é ainda útil na redução do número de dimensões (itens de questionários em algumas situações) e na modelagem da fonte de dados. Em termos práticos, uma técnica para converter julgamentos subjetivos em notas objetivas é apresentada, criando-se um modelo específico e operacional que é capaz de lidar com novas situações. Essa técnica é exemplificada brevemente por dois casos: ranking de dados oriundos de inspeções em bancos de sangue e segmentação de clientes em agronegócios. Sob ponto de vista teórico, o sistema proposto apresentou um modo de estabilizar resultados obtidos a partir do trainamento de SOMs pela imposição de restrições de especialistas humanos, conduzindo a ranking multidimensionais sensíveis a contexto. Embora SOMs constituam uma classe de redes neurais artificiais, eles são radicalmente diferentes do modelo neural usualmente empregado em estudos econõmicos e de negócios, o perceptron multicamadas com algoritmo de treinamento de retropropagação de erros (backpropagation). O principal objetivo deste artigo é, portanto, a apresentação de uma interessante combinação de técnicas originadas na Inteligência Artificial - um campo multidisciplinar mais ligado à Engenharia que à Matemática, onde Estatística tem suas origens e base dedutiva.
Palavras-chave: ranking; Mapa Auto-Organizável; Algoritmo Genético; multidimensionalidade; redução de dados.
Introduction
In terms of methodological studies related to data representation and analysis, knowledge on context-sensitive multidimensional ranking is interesting for many areas (Page et al., 1998; Richardson e Domingos, 2002). In general terms, given a set of data, a ranking is defined by replacing each data value by its relative position (Kvanli et al., 2000), Frequently, some applications are not appropriate to numeric (interval or ratio) measurement. Ranks could be employed, however, to record these variables and to turn the whole process operational. One example is a consumer taste test, where participants, after they have tasted several different brands of soft drinks, consider brand ranking easier than the assignment of a numeric value to each one of them. The use of ranks opens the possibility to relax some assumptions regarding the underlying populations and to employ tests that are applied to a wider variety of situations. Some studies are undertaken regarding the problem faced in web search engines, where pages must be ranked, but this problem has a different nature since dimensions are not clearly available in the text and query-time is very importam (Cohen et al., 1998). This paper presents a general technique imroduced by Martins and Meira e Silva (2001) and exemplifies it with two questionnaire data sets obtained in practical cases related to quality evaluation of Brazilian blood banks and client segmentation in agribusiness.
Artificial neural networks (ANNs) are often used in Economics and Business applications, commonly to describe and forecast many important variables (for a survey of applications of ANNs in Business, see Vellido, Lisboa e Vaughan, 1999). Applications of ANNs for marketing problems can be found in Hruschka (1993) and Agrawal and Schorling (1996). An importam feature of ANNs is that they can be fitted to a wide range ofdata patterns (Kuan e White, 1994; Swanson e White, 1995). ANNs have been used to predict bankruptcy (Zhang, Hu, Patuwo e lndro, 1999) and to highlight structural changes in time series data (Franses e Draisma, 1997; Franses e Van Dijk, 2000).
Research has been done also to compare the modeling through statistical techniques with those using artificial neural networks (ANNs). In modeling brand choice, an importam topic in marketing, several models based on a multinomiallogit model (McFadden, 1973; Guadagni e Little, 1983; Lattin e Bucklin, 1989; cf. Fish, Johnson, Dorsey e Blodgett, 2004) or a multinomiai probit model (Hausman e Wise, 1978; Daganzo, 1979) have been developed and used in practice. Applications of ANNs for brand choice modeling can be found in Hu, Shanker and Hung (1999), and Hruschka, Fettes, Probst and Mies (2002). West, Brockett and Golden (1997) compare an ANN with discriminant analysis and logistic regression. They conclude that an ANN can outperform the two statistical techniques on predicting consumer choice when the underlying choice rule is known and can give better out-of-sample forecasts when the choice rule is not known (see also Dasgupta, Dispensa e Ghose, 1994; Kumar, Rao e Soni, 1995).
Generally, multidimensional data represents any phenomenon or entity of the real world, assuming an attribute vector format. What attributes of the phenomenon will be selected depend on the application. A lot of research issues in complex phenomena, as, for example, consumer behavioral patterns in multi-brand purchasing or multi-store shopping (Ehrenberg, 1987; Robertson, 1976; see Foxall, 1990; Oliveira-Castro e Foxali, 2005) demands consideration to multidimensionality, since a complete and meaningful representation of them must take into consideration a large number of variables, usually measured in different leveis. Many times, the available attributes are not of direct interest. They are only paths to discover the attributes that are really interesting (sometimes called "latent attributes"). An example would be the multidimensional data that record a blood bank sanitary inspection or a client interview. The interest of the first application is to rank Brazilian blood banks according to the overall quality. The attribute 'quality', however, is not directly measurable. It is obtained through observation, measurement and analysis of other attributes (component variables). "Quality" makes sense only ifthe complex pool of information is conjunctly treated.
When "ranking" (ordinal number) is mentioned, a meaningful sequence (e.g., positions in a race carl is usually considered. Therefore, when it is mentioned the Goiânia city blood bank position in the Brazilian blood bank quality ranking, there is always a criterion to discover (or set) that position. In fact, ranking leads to the idea of one-dimensional criteria. In order to rank instances represented by multidimensional data, there must be a dimensionality reduction and the performing of some type of regression that, when they are combined, will reveal the criteria employed to build the ranking. Self-Organizing Maps (SOMs) are a elass of artificial neural networks (Kohonen, 1982; 2001) that encompasses these two characteristics needed to build rankings of multidimensional data. While topological relations are preserved, assuring that similar data stay near to one another and very dissimilar data assume distant locations from one another, SOM is able to reduce the data original dimensionality and work, therefore, as a link from a representation with many components to a much simpler one with a few components. In other words, SOM has the ability to reduce the dimensionality of data while preserving the original topology.
Artificial neural networks
Artificial neural networks (ANNs) are information-processing structures that imitate the activity of human brains. They are often implemented by computer software (development in hardware is also pursued to specific real-time applications, although less advantageous to general situations). Artificial neurons (or nodes) are abstractions conceived, in structure and functioning, by analogy with the biologic neuron. Artificial neurons have one or more input signals (x1, x2, ... , xn) and one output signal (see Figure 1). Each input signal is associated to a weight (w1, w2, ... , wn) that indicates how important that input is to the neuron activation level. The input signal value is multiplied by the associated weight and the resulting sum (Σ) is the neuron stimulus signal ('net input', in technical terms). The stimulus signal produces an output according to the neuron intemal activating function and its sensibility ('threshold' or limiar). The activating function will produce an output when the received information (net input) transposes an established limiar-value (McCuloch e Pitts, 1943). Similarly to what occurs in the brain, artificial neurons interconnect to form networks. lt is possible, then, to create structures for pattem generalization of various inputs, producing one or more outputs that will be able to represent an action or object of the real world (pattern) as a response to specific data presented in the input. In a simple way, an ANN reveals the following operation mode: 1) initial definitions such as ANN structure (neural interconnection, topology, training algorithm) are done; 2) a set of samples (training set) is iteratively presented in order to train the network (which requires the particular adjustment of each synaptic weight), and 3) at the end of training, the net will be able to recognize the pattems presented to it, as well as to give a coherent response to pattems not pertaining to the training set. So, the net will not say that the new pattem does not exist, but that, according to its characteristics, the pattem resembles some ofthe known patterns (cf. Haykin, 2000).
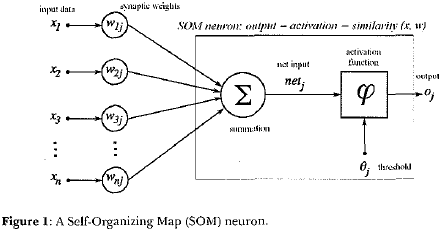
As any elass of artificial neural networks, a Self-Organizing Map (SOM) is comprised of neurons. Each neuron receives, by using its dendrites, some stimulation (which are weighted by the strengths of its synapses) and reaches an activation levei (a quantitative measure). As there is a synaptic weight for each input attribute, it is useful to visualize this set of synaptic weights as a data prototype (see Figure 1). The activation level of a SOM neuron is proportional to the similarity between the current input (data under consideration) and the prototype encoded by its synaptic weights. Each SOM neuron is, therefore, "an expert" to recognize a specific set of similar inputs to its prototype.
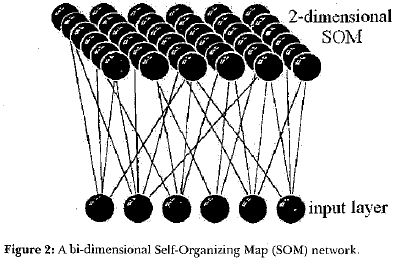
As Self-Organizing Maps (SOMs) neurons do not direct affect each other, that is, they have not direct synapses between them, when they are disposed into a bi-dimensional map, if their synaptic prototypes are different, there will be a natural "winner" to each input data (a neuron whose activation levei is the highest of them ali). The training process of SOM networks (see Figure 2), when synaptic prototypes are adapted, is performed in such a way to end up with topological maps, that is, neural structures where nearby neurons are expert in recognizing similar inputs and distant neurons recognize very distinct inputs.
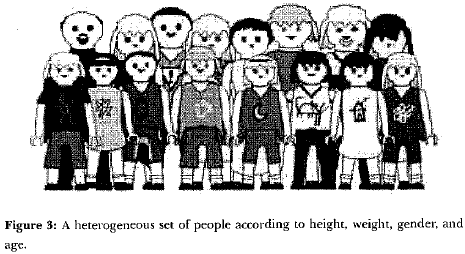
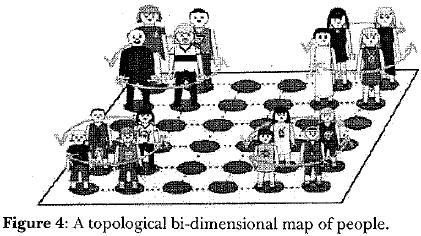
The concept of topological maps can be understood by the following example. Suppose that there is a heterogeneous set of people according to height, weight, gender, and age - as it is the case, for example, in samples of market segmentation research (see Figure 3). The main goal is to form elusters whose members are similar. Due to the topological preservation, similar information is mapped to nearby neurons or even in the same neuron. The neighboring relation among neurons allows the elustering of neurons that are responsible for similar stimuli as shown in Figure 4. Note that there is a dimensionality reduction of four attributes (height, weight, gender and age) to two attributes (x and y coordinates on a bi-dimensional map). One could think that it is possible, in this example, since weight, height and age are highly correlated, but the main point is that this technique is generic enough to attend a wide range of situations.
The training process, responsible for the topological preservation, starts with random prototypes assigned to each neuron. Afterwards in an iterative procedure, each input data is shown to the map and the "winner" (best recognizer) is identified. Then, the prototypes of ali neurons within a resizable neighborhood around the winner (ineluding itself) are adjusted in such a way as to be more sensitive to a future presentation of the current input data. In other words, these neurons become more responsive to this input data. The size of the neighborhood and the magnitude of changes are historically controlled in such a way that many neurons (members of large neighborhoods) are highly adjusted in the beginning and small changes are imposed to few neurons (members of small neighborhoods) at the final stages of the training. In simpler words, training starts with a non-topological random map and strong adjustments, and gradually moves to topological maps by decreasing the areas and magnitude of adjustments until a maximum quantity of cycles is reached. Note that, as the initial map is random, each training process leads to a different final map.
The use of artificial neural networks (ANNs) like Self-Organizing Maps (SOMs) to solve ordering problems of high dimensional vectors is not common. Probabilistic elassifiers and other strategies are generally applied to approach problems of this nature (Cohen et al., 1998). Kohonen (2001) lists only one reference about this issue among other 1700 references. Some works have been published since then (Azcarraga, 2000).
In addition to the Self-Organizing Map (SOM)'s ability to visualize nonlinear relationships in multidimensional data, the development ofa topological order is an effect already empirically confirmed. However, the analytical proofofthe ordering property does not prove they can be used to order instances represented by high dimensional vectors (the proof was undertaken to the case of one-dimensional networks and one dimensional input vectors, scalar values. Cf. Erwin et al., 1992). Budinich and Taylor (1995), by observing geometric aspects of the ordering phenomenon described by the Kohonen (2001) ordering theorem, have shown that an unique convergent ordered state in dimensions greater than one has zero probability of existence, that is, it is an impossible event. In other words, the standard SOM training does lead to different maps and it is not a deterministic technique where a specific result is always obtained when the input is kept unchanged. The fact that SOMs do not converge voluntarily to an (unique) ordered state in high dimensional input spaces requires the use of external constraints in order to benefit from their properties ofdimension reduction and topological ordering. These constraints should force the convergence to the desired state and conduct the training process properly.
Another important aspect to be analyzed is the similarity metric used by the Self-Organizing Map (SOM) algorithm to choose the winner unit. In the standard algorithm, the Euclidean distance is employed, that is, a simple metric where each attribute has the sarne importance. The unit with the lowest distance between its weight and the current input (in terms of Euclidean distance) is the winner neuron and has its weight vector updated (together with its neighboring). In real-world ordering of instances, however, the 'pure' Euclidean distance does not always points to the desired ordering since some attributes should have more importance than others. In a vector of attributes, each one can provide a different weight to the ordering, e. g., some attributes are indeed more important than others. The 'pure' Euclidean distance does not take into account this attribute weighting. Therefore, a generic technique of ordering should consider the weighting ofcomponents of an attribute vector.
In this work, Genetic Algorithms are employed in the search for proper weights to specify a context-sensitive weighted Euclidean distance. The expected distribution function of sam pies in the ranking (provided by human domain experts) combined with the references for the first (best) and last (worst) instances in the desired ordering (also provided by human domain experts by consensus) are the external constraints employed to force the convergence of the network.
Genetic algorithms
Genetic Algorithms (GAs) are a heuristic search technique used in Computer Science to find approximate (hopefully, satisfactory) solutions to optimization and search problems. By being a general technique, GAs are employed in many applications that range from Engineering, Computer Science, Physics, and Economics to other areas. In fact, they have proved to be an efficient tool to approach hard problems when other techniques are not even applicable. GAs have been generalized to a field called "Evolutionary Computation" where techniques inspired by Evolutionary Biology such as inheritance, mutation, selection, and crossover (also called "recombination") are important features. On the other hand, GAs have some difficult problems to deal with, as well. Among them, it should be mentioned the crucial issues of representing potential solutions in the search space, and designing of the proper (recombination and mutation) operators that drive the search.
Cenetic Algorithms (CAs) are implemented as a computer software simulation where a population of abstract representations (called chromosomes or the genotype) ofmcandidate solutions (called individuals, creatures, or phenotypes) to an optimization problem evolves towards better solutions as in natural selection. In the present study, each chromosome gene defines a numerical weight for a particular input, although binary (yes/no) values are traditional. The evolution is a generation process that usually begins with a population of randomly generated individuaIs. In each generation, the fitness (survival strength) ofevery individual in the population is evaluated in order to select individuals from the current population (in such a way that the probability of being chosen is proportional to their fitness), and modified (mutated or recombined) to form a new population. The new population is then used in the next iteration of the algorithm and so on. This process is stopped when a maximum of generations is reached, or a good solution is obtained or the whole generation has converged to very similar individuals(1).
In terms of references of Cenetic Algoritms combined with artificial neural networks in the consumer behavior literature, Fish, Johnson, Dorsey and Blodgett (2004) introduced a new architectural design for feedforward artificial neural networks (ANNs) used in multilevel output consumer choice problems. A standard ANN design, that normally requires an output variable for each alternative in a polychotomous situation, was reconfigured to contain only one output node for a six-level choice problem. In the study, the ANN was trained with a genetic algorithm as opposed to the standard backpropagation training method. A two-stage experimental design was used. In the first stage, the choice model, training and holdout data sets remain constant while the network design was manipulated from the standard architecture trained with backpropagation, to a reduced architecture. Two reduced architecture ANNs were used: one trained with backpropagation and one trained with a genetic algorithm. All networks were optimized on their ability to correctly predict individual household coffee purchases. They were then compared on their respective ability to predict individual household purchases of various brands and sizes of coffee in a holdout sample. A multinomiallogit (MNL), that is the prevalent discrete choice modeling process in marketing today, was included as the benchmark model to measure how the tested mode!s compare to a standard statistical approach. In the second stage, the ability of various ANNs' to estimate brand share were compared. The choice model, training and holdout data sets, as well as, network architecture were kept constant (reduced architecture used due to superior performance), while the ANN training algorithm from backpropagation to a genetic algorithm was manipulated. All ANN models were optimized using mean absolute error of the estimated brand share as the decision criterion. The networks were then evaluated on a holdout sample concerning their respective abilities to predict market share of various brands and sizes of coffee. An MNL benchmark model was included again for a comparison to a standard statistical approach. As the main results, Fish,]ohnson, Dorsey and Blodgett (2004) obtained that altering from multinomial logit (MNL) to feedforward ANNs trained with the standard backpropagation algorithm and a genetic algorithm, the prediction of output choice of brands and sizes of coffee replicate. Additionally, the ANN trained with the genetic algorithm outperformed both MNL and the backpropagation trained ANN.
Objective and hypothesis
The present work proposes the use of one-dimensional Self-Organizing Maps (SOMs) to order multidimensional data. It consists on searching and adjusting a population of distance metrics to find the one that conducts the one-dimensional map to generate a ranking where differences of importance among the attributes are considered. The hypothesis is that the distribution function and references provided by domain experts are strong enough to produce the convergence of the ordering at the desired context. Such strategy is justified since looking at the direct evaluation of the relative importance of each attribute is a controversial process even among experts, that is, even experts disagree when they are asked to weight the importance of each and every attribute. In this work, we have used a distribution based on a histogram obtained from a normal (Gaussian) distribution due to its ability to represent the reality in different situations. To the expert, it was left only the definition of the best and the worst cases.
Method
General intelligent computational adjustments
In order to stabilize the final state of SOM training and to guarantee proper context-sensitive rankings, two constraints were imposed: 1) the presetting of synaptic weights (prototypes) belonging to neurons which are in ending (ranking) positions by using the best and worst instances provided by the domain experts, and 2) the target sample distribution predefined also by domain experts. In the distance domain (where all possible weighted Euclidean distance are), the genetic search recombines chromosomes (best distances) by using the fimess criteria, that is, the best solutions have higher probability to generate descendants (similar to themselves).
The algorithm of the proposed procedure is shown below:
1. Set up the network in order to cope with the desired ranking (e.g., 10 neurons in the example of Brazilian blood banks) and preset the prototypes ofending neurons to store the best and worst instances of data permanently.
2. Generate the initial population of distances (chromosomes) with random scalar numbers in the range from zero to one and evaluate their corresponding sample distributions.
3. While the quality of no known distance is adequate (compared to the target sample distribution provided by domain experts), do:
a. Recombine the distance population (chromosomes).
b. Train the SOM network by using the distances (chromo somes) generated by the recombination. Each distance requires a specific training process.
c. Evaluate the quality (fitness) of each distance by com paring its resulting sample distribution to the target sample distribution and keep the size of distance population by deleting the weakest distances.
4. Train a significant number of networks with the best known distance and generates a final ranking by using the average of the ranking position of each data instance in all trained networks.
The distance (or similarity measure) used in the standard Self-Organizing Map (SOM) is the square of the Euclidean distance between the input and the vector of neuron weights. Let X be the input vector and W be the weight vector, the standard Euclidean distance is given by:

where xi is the value of the i-th input, wi is the weight value of the i-th connection, and the Σ takes into account ali dimensions. In the present work, the distance has been modified to the following expression:

where pi is a weighting factor that indicates the importance of the i-th attribute.
The Genetic Algorithm (GA) will look for the p vector that imposes the best ranking, in accordance with the criteria of the best example distribution (the highest similarity with the chosen distribution). The fixation of weights for the first and last neurons forces the map to have only one ordering direction, preventing inversions that are common at trained one-dimensional Self-Organizing Maps (SOMs). This procedure also forces the ranking position difference between the two references (the best and the worst ones) indicated by the expert to be naturally the highest of the ranking.
Case 1: Quality evaluation of Brazilian blood banks
Sample
Data from blood banks are a subset of sanitary inspections that were conducted by Sanitary Vigilance of the Brazilian Department of Health from 1996 to 1997. The studied sample was composed of 85 similar banks (with complete answers and normal inspection reports), the evaluation ofwhich is surrounded by controversy when ranking by human experts is attempted.
Equipment
Computer softwares (to manage data from inspections and to simulate the whole proposed system with SOM and GA working in coliaboration) were implemented in Borland Delphi 4.0® programming language in a Microsoft Windows 98® environment. As for hardware, it was used an IBM-PC® computer with Intel Pentium II® 350MHz microprocessor and 128Mbytes RAM memory. Twelve hundred (12.000) generations has taken approximately 100 hours.
Procedure
From more than one hundred items, 77 were selected to serve as component variables to describe the quality of the blood bank. These items were considered by human experts as being more related to the quality of provided services. For example, among the selected items, it was included the presence of responsible technician, the existence of personal improvement program, properbuilding facilities, and so on. Each variable (that stores the answer of each selected item) has received the value '1', '-1' and '0', corresponding, respectively, to 'yes', 'no' and 'not applicable' or 'not informed'. Each blood bank was represented, therefore, as an instance of a multidimensional vector. The data set was composed by ali these instantiated multidimensional vectors, corresponding to ali blood banks.
Results
Data were ordered in three situations, and each one has generated a ranking. The first ranking was generated by using statistical methods (Principal Component Analysis, PCA; cf. Jolliffe, 1986; Carreira-Perpinan, 1999). The second ranking was generated by a Self-Organizing Map (SOM) network without the use of weighting (describe as "Standard SOM") and the third one used the SOM network with adjust ofsimilarity metric by Genetic Algorithm (described as "Proposed System").
Statistical approach
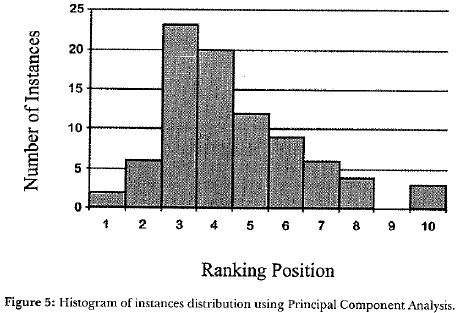
The use of the technique of Principal Component Analysis (PCA) to reach the ordering criteria resulted in 23 components (greater than one), that explained 78.43% of the data variability. The first principal component, chosen for the ordering criteria, represented only 13.68% of the data variability. Figure 5 shows the resulting sample distribution, that is, the histogram of ali sample instances, based on the value where each instance (sample member) is represented on the first principal component axis. Note that the total range is divided in ten intervals to justify comparisons with Standard SOM and the Proposed System.
Standard SOM
The second approach was a Self-Organizing Map (SOM) network modified by presetting the weights of the ending neurons with the references (the best and the worst instances) pointed out by experts. The weighting and the subsequent genetic search of the best distribution were not employed. The presentation order ofsample instances was random and the values ofthe parameters were obtained empirically taking into account suggestions in Kohonen (2001). The obtained shape of sample distribution is shown in Figure 6.
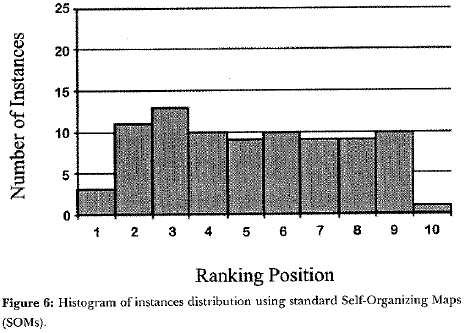
It was verified in the analysis, in accordance with what has been expected in theoretical studies that, in each training, the one-dimensional Self-Organizing Map (SOM) network generated a different ranking (by using the same parameters). Nevertheless, the network presents "statistical convergence". In other words, as the number of trained networks is increased, a specific ranking has a higher probability to occur. Therefore, to obtain the final ranking there is a need to train a significant number of networks and, from them, adopt the average positions to each example. In this work, the number of trained networks was 1000.
Proposed system
The parameters employed to test the proposed system concerning Self-Organizing Map (SOM) networks were the same as the standard SOM. The parameters of the Genetic Aigorithm were: size ofinitial population equals to 100, mutation rate equals to 1 %, uniform crossover, and random initialization of genes in the range of 0 to 5. After the weighting values were obtained by the Genetic Aigorithm, 1000 networks were trained and average values of the ranking positions were adopted as final values, as before. The ranking distribution can be seen in Figure 7.
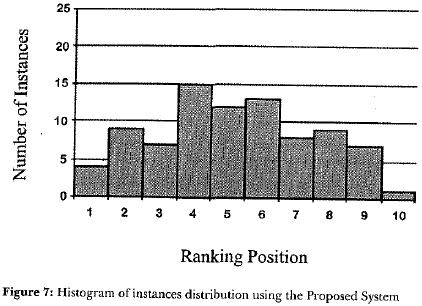
Besides visual inspection, the use of skewness and kurtosis shows that the Proposed System has lead to the best solution, that is, the best resemblance ofa Gaussian histogram. For instance, the skewness of the proposed system solution is only 0.05 compared to Principal Component Analysis (PCA) solution's 0.91. In order to compare the obtained solutions, it was employed the Spearman coefficient (rS), non-parametric measure ofordinal data correlation, to assess the similarity between two rankings. The statistical technique, PCA was the most uncorrelated with the Proposed System (rs=0.860). The Standard Self-Organizing Map (SOM) technique was more highly correlated with the Proposed System (rs=0.916) but not as much as it was with PCA (rs=0.937).
Case 2: Client segmentation in agribusiness
Sample
The dataset for the study of client segmentation in agribusiness was composed of 98 client interviews. Interviews were conducted at client's offices and farms. A confidentiality agreement prevents the disclosure of the multinational company identity that has commissioned this study as well as some more specific information. Nevertheless, one can grasp the scope ofthe technique applied here since it uses the sarne ideas as those that have been used to rank Brazilian blood banks.
Equipment
Computer softwares (to manage data from client interviews and to simulate the whole proposed system with Self-Organizing Map [SOM] and Genetic Algorithm [GA] working in collaboration) were implemented in C++® programming language in a Microsoft Windows XP® environment. As for hardware, it was used an IBM-PC® computer with Intel Pentium® IV 2.4GHz microprocessor and 768Mbytes RAM memory. Five hundred thousands (500.000) generations has taken approximately 120 hours.
Procedure
Experts analyzed the agriculture context in three subdomains (production, administration and commercial) and each subdomain in three subjective classes (elementary, intermediary and advanced). In order to gather information on production, 78 items were asked, while 17 and 60 items were employed to describe commercial and administrative subdomains, respectively. Items were based on aspects such as the crop portfolio, agricultural usage of land and typical farm procedures. For instance, the question "is soya beans one of your usual crops in this farm or not?" composes the production questionnaire.
In general, interviews took three hours to be completed. They were considered an exhausting task even for trained interviewers. Each client was subjectively classified by his interviewer who had received specific training to cope with this task and to implement the project leaders' ideas.
The main goal of the project was to develop a model to turn subjective (human, expert) classification into an objective (automatic) procedure and, alter that, to use the derived mathematical model to classify new clients. This is particularly relevant to companies since the maintenance of an expert group dedicated to this task is too expensive.
The evolution (iterative adjustment) of the model was accomplished with a genetic search. To guide the genetic search, the criterion was the correlation between subjective (human, expert) classification and objective classification (derived fram the resulting mathematical model). In other words, the main criterion aimed to optimize the Spearman correlation between subjective and objective (optimized) rankings. The higher the Spearman correlation coefficient is, the most similar subjective and objective rankings are. The Spearman rank correlation was, therefore, the fitness function of the genetic search. For each subdomain, only three neurans were used to build the one-dimensional Self-Organizing Map (SOM).
Most of variables were binary (resulting fram yes/no questions), but a "statistical normalization" (based on the histogram of the variable, where cumulative relative frequencies were available) was necessary to limit all answers to cover a range fram zera to one. By using this strategy, each item contributed with a positive degree of importance and it was possible to reduce the number of items based on their correspondent weight since variables associated with small weights (degree of importance) do not contribute significantly.
Experts had imposed many external constraints to the weighted Euclidean distance, fundamental element of SOM technique in order to point the winner neuron and, therefore, to find neurons whose pratotypes should be adjusted. For example, the weight (degree of importance) of a variable should be greater than the weight of another variable and so on.
Results
Table 1 summarizes the results. It compares Spearman correlation between subjective and objective client rankings in two conditions: 1) with expert (human) estimative of the degree of importance of each item (variable), and 2) with praposed system weights (reached at the end of GA search, which requires SOM trainings) after the deletion of items associated with the lowest weights (degrees of importance). In addition, the percentage of item reduction, that indicates the reduction of number of variables, is also shown.
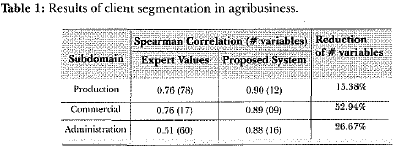
By assuming the subjective (expert) classification as the main target, the resulting neuragenetic model was more successful at the production domain in terms of Spearman correlation (rS) and reduction of variables. More specifically, by using item weights (degrees of importance) derived fram expert estimative, 78 variables were necessary to achieve 76% agreement between subjective and objective classification. By using item weights derived fram neuragenetic system, only 12 variables were necessary to achieve 90% agreement between subjective and objective classification. The ratio between 12 and 78 equals to 15.38% and indicates how many variables the proposed system uses when compared to the original questionnaire.
At first, it seems that no great success was obtained in the commercial domain, but it should be noted that it had few variables originally and, therefore, less space for improvement. In terms of relative correlation improvement, the administration domain was the most successful since it increased fram 0.51 to 0.88.
Finally, it must be highlighted the significant gain in terms of questionnaire reduction, fram 155 to 37 items. In practical terms, the interview has been reduced from 3 hours to 30 minutes (a much better session according to interview guidelines).
Discussion
This article has presented an artificial neurogenetic system dedicated to the discovery of rankings as an alternative for traditional statistical techniques. The usefulness of a system with such capability in research and professional areas that deal with large amounts ofcomplex data is unquestionable. By combining Kohonen Self-Organizing Maps (SOMs). Genetic Algorithms (GAs) and expert previous knowledge, it was developed an interesting technique to attend to expert expectations and to find the relative importance (weight) of each attribute of the vector of features that describes the phenomenon.
The proposed technique has behaved quite well for the academic problem of Brazilian blood banks ranking by using the criteria of quality and has shown the importance of each attribute present in the questionnaire of the sanitary inspection. A brief exposition was given to a consulting problem of client segmentation in agribusiness. The reduction of questionnaire items and the improvement of Spearman correlation, fitness function for Genetic Algorithm optimization, between subjective and objective classification were achieved simultaneously. Future works will be directed to the exploration of logical combinations of the questionnaire variables to reduce even more the number of questionnaire items that have strong influence on the success of a marketing research.
Additionally, as an example ofother possible applications, research on brand effects upon consumer choice has shown that under conditions of low brand commitment, the great majority of consumers behaves by trying brands in order to obtain information about and evaluate brands, and are not loyal to anyone of them. Rather, consumers under such conditions exhibit multibrand purchasing within a small repertoire ofbrands attributes which are common to ali members oftheir product class (Robertson, 1976; cf. Foxall, 1990). An artificial neural network approach to such phenomena could result in a precise description of the relative importance of each attribute in the repertoire of brands (as discriminativestimuli upon choice). In fact, some studies have followed this path by employing genetic algorithms and neural networks with different configurations. In order to model brand share, Fish, Johnson, Dorsey, Blodgett (2004) have employed a traditional neural network model (called "multilayer perceptron") trained with a genetic algorithm and compared its results to the system composed with the same neural model trained with its traditional algorithm (known as "backpropagation"), and to a statistical multinomial logit model. Their best results were derived from the neurogenetic system. On the other hand, our proposed system uses a different neural network model (SOM) and the genetic algorithm is not used to train it, but only to find the most appropriate weighted Euclidian distance.
A specialized intelligent system (context-sensitive and able to treat multidimensional data) could beco me a powerful tool to make controlled laboratory simulations of the phenomena. Another important research aspect is a systematic comparison of the presented technique with traditional statistical techniques such as multidimensional scaling (Kruskal e Wish, 2001) and minimal distance analysis (Guttman, 1984). Despite the fact that techniques from Artificial Intelligence come from a distinct source than statistical techniques, they are different languages that aim to the understanding and operationalization of the same task, that is, data analysis.
References
AGRAWAL, D.; SCHORLING, C. Market share forecasting: an empirical comparison of artificial neural networks and multinomiallogit model. Journal of Retailing, v.72, n.4, p. 383-407, 1996. [ Links ]
AZCARRAGA, A. P. Assessing self-organization using order metrics. In: IEEE INNS INTERNATIONAL JOINT CONFERENCE ON NEURAL NETWORKS (IJCNN), 6, 2000, Piscataway, NJ, USA. Proceedings of IJCNN '00, Piscataway, NJ, USA, 2000. p. 159-164. [ Links ]
BUDINICH, M.; TAYLOR, J. G. On the ordering conditions for self-organizing maps. London, UK: Centre for Neural Networks, Kings College, 1995. [ Links ]
CARREIRA-PERPINAN, M.A. A review of dimension reduction techniques. Technical report, University of Shefield, UK, 1999. [ Links ]
COHEN, W. W.; SCHAPIRE, R. E.; SINGER, Y. Learning to order things. Advances in Neural Information Processing Systems, v. 11, p. 451-457,1998. [ Links ]
DAGANZO, C. Multinomial Probit: The Theory and its Applications to Demand Forecasting. Academic Press, New York: NY, 1979. [ Links ]
DASGUPTA, C. G.; DISPENSA, G. S.; GHOSE, S. Comparing the predictive performance of a neural network model with some traditional market response models. International Journal of Forecasting, v.10, p. 235-244, 1994. [ Links ]
EHRENBERG, A. S. Repeat buying; theory and applications. Edinburgh: Griffin, 1987. [ Links ]
ERWIN, E.; OBERMAYER, K.; SCHULTEN, K. Self-organizing maps: ordering, convergence properties, and energy functions. Biological Cybernetics, v. 67, p. 47-55, 1992. [ Links ]
FISH, K. E.; JOHNSON, J. D.; DORSEY, R. E.; BLODGETT, J. G. Using an artificial neural network trained with a genetic algorithm to madel brand share. Journal of Business Research, v. 57, p.79-85, 2004. [ Links ]
FOXALL, G. Consumer psychology in behavioral perspective. London, UK: Routledge, 1990. [ Links ]
FRANSES, P. H.; DRAISMA, G. Recognizing changing seasonal patterns using artificial neural networks. Journal of Econometrics, v.81, p.273-280, 1997. [ Links ]
FRANSES, P.H.; van DIJK, D. Nonlinear Time Series Models in Empirical Finance. Cambridge University Press, Cambridge: UK, 2000. [ Links ]
GUADAGNI, P. M.; LITTLE, J D. C. A logit model of brand choice calibrated on scanner data. Marketing Science, v.2, p.203-238, 1983. [ Links ]
A. GUTTMAN. R-Trees; A Dynamic Index Structure for Spatial Searching. In: Proc. ACM SIGMOD Int. Conf on Management of Data (SIGMOD'84), Boston, MA, 1984. [ Links ]
HAUSMAN, J.; WISE, D. A conditional probit model for qualitative choice: Discrete decisions recognizing interde pendence and heterogenous preferences. Econometrica, v.45, p.319-339, 1978. [ Links ]
HAYKIN, S. S. Redes neurais artificiais: princípio e prática. São Paulo: Bookman, 2000 [ Links ]
HU, M. Y.; SHANKER, M.; HUNG, M. S. Estimation of posterior probabilities of consumer situational choices with neural network classifiers. International Journal of Research in Marketing, v.16, p.307-317,1999. [ Links ]
HRUSCHKA, H. Determining market response functions by neural network modeling: A comparison to econometric techniques. European journal of Operational Research v.66, p.27-35, 1993. [ Links ]
HRUSCHKA, H.; FETTES, W.; PROBST, M.; MIES, C. A flexible brand choice model based on neural net methodology. A comparison to the linear utility multinomial logit model and its latent dass extension. O R Spectrum, v.24, p.127-143, 2002. [ Links ]
JOLLIFFE, I. T. Principal component analysis. New York, USA: Springer-Veriag, 1986. [ Links ]
KOHONEN, T. Self-organized formation of topalogically correct feature maps. Biological Cybernetics, v. 43, p. 59-69, 1982. [ Links ]
KOHONEN, T. Self-organizing maps. 3ed. Berlin: Springer-Verlag, 2001. [ Links ]
KRUSKAL, J. B.; WISH, M. Multidimensional Scaling, Sage University Paper series on Quantitative Application in the Social Sciences, 07-011. Beverly Hills and London; Sage Publications, 1978. [ Links ]
KVANLI, A. H.; PAVUR, R.J.; GUYNES, C. S. Introduction to business statistics. 5ed. Cincinnati, USA: South-Western College Publishing, Thomson Learning, 2000. [ Links ]
KUAN, C. M.; WHITE, H. Artificial neural networks: An econometric perspective (with discussion). Econometric Reviews, v.13, 1-91, 1994. [ Links ]
KUMAR, A.; RAO, V. R.; SONI, H. An empirical comparison of neural network and logistic regression models. Marketing Letters, v.6, p.251-263, 1995. [ Links ]
LATTIN, J. M.; BUCKLIN, E. Reference effects of price and promotion on braod choice behavior. Journal of Marketing Research, v.26, p.299-310, 1989. [ Links ]
MARTINS, W; MEIRA E SILVA,J. C. Multidimensional data ranking using self-organizing maps and geoetic algorithms. In: IEEE INNS INTERNATION AL JOINT CONFERENCE ON NEURAL NETWORKS (IJCNN), 4, 2001, Washington, DC, USA. Proceedings of IJCNN'01, Washington, DC, USA, 2001. p. 2382-2387. [ Links ]
MCFADDEN, D. Conditional logit analysis of qualitative choice behavior. In: ZAREMBKA, P. (Ed.). Frontiers in Econometrics. Academic Press, New York, 1973. p. 105-142. [ Links ]
OLIVEIRA-CASTRO, J. M.; FOXALL, G. Análise do comportamento do consumidor. In: ABREU-RODRIGUES, J.; RIBEIRO, M. R. Análíse do comportamento: pesquisa, teoria e aplicação. Porto Alegre: Artmed, 2005. [ Links ]
PAGE, L.; BRIN, S.; MOTWANI, R.; WINOGRAD, T. The pagerank citation ranking: bringing order to the web. Technical report, Stanford University, USA, 1998. [ Links ]
RICHARDSON, M.; DOMINGOS, P. The intelligent surfer: probabilistic combination of link and content information in pagerank. Advances in Neural Information Processing Systems, v. 14, p. 1441-1448, 2002. [ Links ]
ROBERTSON, T. S. Low commitment consumer behavior. Journal of Advertising Research, v. 16, p. 19-24, 1976. [ Links ]
SWANSON, N. R.; WHITE, H. A model-selection approach to assessing the information in the term structure using linear models and artificial neural networks. Journal of Business and Economic Statistics, v.13, p. 265-275, 1995. [ Links ]
VELLIDO, A.; LISBOA, P.J. G.; VAUGHAN, J. Neural networks in business: A survey of applications (1992-1998). Expert Systems with Applications, v.17, p. 51-70, 1999. [ Links ]
WEST, P. M.; BROCKETI, P. L.; GOLDEN, L. L. A comparative analysis of neural networks and statistical methods for predicting consumer choice. Marketing Science, v.16, n.4, p. 370-391, 1997. [ Links ]
ZHANG, G.; HU, M. Y.; PATUWO, B. E.; INDRO, D. C. Artificial neural networks in bankruptcy prediction: General framework and cross-validation analysis. European Journal of Operational Research, v.116, p. 16-32, 1999. [ Links ]
Recebido: 31/10/06
Revisado: 26/11/06
Aceito: 15/12/06
1 A nice introduction to the Genetic Algorithm technique can be seen in http://www.doc.ic.ac.uk/-nd/surprise_96/journal/vol4/tcw2/report.htm or http://en.wikipedia.org/wiki/Genetic_algorithm.


