


Serviços Personalizados
artigo
 texto em
  Inglês (pdf)
 Artigo em XML
 Referências do artigo
Indicadores

Compartilhar

 Permalink
Journal of Human Growth and Development
versão impressa ISSN 0104-1282
Rev. bras. crescimento desenvolv. hum. vol.21 no.3 São Paulo 2011
ORIGINAL RESEARCH
Cutoff for body mass index in adolescents: comparison with national and international reference standards
Luis P. G. MascarenhasI, II; André de C. SmolarekII; Rodrigo BozzaII; Margaret C. S. BoguszewskiI, III; Francisca Sonia PratiI; Antonio Stabelini NetoIV; Wagner de CamposV; Marilza J. ModestoI; Nadia Mohamad AmerI; Kleverton KrinskiII; Hassan Mohamed ElsangedyII
IUnidade
de Endocrinologia Pediátrica – HC (UEP), Doutorado em Saúde
da Criança e do Adolescente – UFPR
IICentro de Pesquisa em Exercício e Esporte (CPEE), Departamento
de Educação Física - UFPR
IIIProfessor Adjunto do Departamento de Pediatria-UFPR
IVFaculdade Estadual de Jacarezinho - Doutorando do Departamento
de Educação Física – UFPR
VProfessor Titular do Departamento de Educação Física
- UFPR e Coordenador do CPEE
ABSTRACT
OBJECTIVE:
To build a percentile table for body mass index (BMI) for adolescents aged 10
to 14 years in the city of Curitiba, state of Paraná, Brazil, and compare
the values found for overweight (85th percentile) and obesity (95th percentile)
with Brazilian and international BMI reference values.
METHODS: Mixed longitudinal study with 5231 evaluations of adolescents
aged 10 to 14 years (2471 in boys). This sample was obtained by adding 4321
semester evaluations conducted from 1998 to 2002 (longitudinal study) to 910
individual evaluations made in 2006 (cross-sectional study). BMI was calculated
as the ratio of body mass (kg) divided by height (m) squared. Frequency tables
were prepared based on percentile distribution. A nonparametric binomial test
was used to identify differences in cut-off points for overweight and obesity
from the Brazilian studies conducted by Cintra et al. and by Conde and Monteiro,
and the international study by Cole et al.
RESULTS: When compared with reference values, overweight was overestimated
for adolescents of Curitiba if the reference values by Cole et al. and Conde
and Monteiro were used, and underestimated when compared with the regional reference
described by Cintra et al. The same trends were found for the 95th percentile
(obesity), but not for all ages.
CONCLUSION: The differences from the BMI values suggested as cut-off
points in Brazilian and international overweight and obesity reference values
indicate that specific references should be used for each population.
Key words: body composition; overweight; obesity; adolescent.
INTRODUCTION
Overweight and, particularly, obesity are associated with several epidemiologically important health problems that account for 68% of deaths and temporary or permanent disability in the world population.1 Obesity is recognized as one of the risk factors for the development of metabolic disorders and is associated with morbidities, such as coronary heart disease, hypertension and diabetes.2-5 Many of these disease processes begin in childhood and adolescence, and sometimes as early as in intrauterine life.6,7
The frequency of obesity cases has increased worldwide. Studies should investigate the magnitude and determinant factors of this problem in different regions to develop effective programs that respect specific regional characteristics and whose purpose is to reduce this cause of morbidity.8-10
In 1997, the International Obesity Task Force (IOTF) recommended the use of the body mass index (BMI) to evaluate the nutritional status of populations and analyze temporal trends in the variation of body composition of the world pediatric population.11
Different BMI cut-off points have been described for the diagnosis of overweight and obesity in Brazil and internationally,12-14 but specific ethnic, cultural and social issues in each region should be taken into consideration to define what reference values should be used.15
Studies have shown variations in the prevalence of overweight and obesity among adolescents in the many different regions of Brazil,8,16-18 but an effective comparison between results is difficult because of the different methods used. This study described, in percentiles, the BMI for adolescents up to 14 years of age and compared the percentiles for overweight (85th-0) and obesity (95th) with national and international BMI reference values.
METHODS
This descriptive mixed longitudinal cohort study used purposive sampling and, in agreement with the criteria established by the World Health Organiza-tion (WHO), defined adolescence as the time from 10 to 19 years of age. Adolescents aged 10 to 14 years were included it they studied in public or private schools of the city of Curitiba, state of Paraná, Brazil. According to the Brazilian census bureau (IBGE),19 the total number of adolescents aged 10 to 14 years in Curitiba is 223,285, and they study in 213 elementary schools. In the schools where the principals accepted to participate in the study, an informed consent term that explained the procedures was handed out and taken home for the adolescents and their parents or guardians to sign. Adolescents were excluded if they had any physical impairment that precluded anthropometric evaluations or used any medication that might affect their growth.
The number of participants was estimated for a 95% confidence interval and a 3% sampling error for an expected 15% prevalence of overweight and a design effect of 3.5. The result was 789 individuals. This number was increased in 20% to a total of 945 individuals because of possible losses, the possibility of missing data during evaluation, and the school drop-out rate, which is 0.07% in the state of Paraná,19 where Curitiba is located.
The group was evaluated every six months from 1998 to 2002, and a database with 4321 longitudinal observations was generated. In addition, cross-sectional evaluations made in 2006 of 910 other adolescents were included, and the total was 5231 observations (2471 of boys). Therefore, the curve was built using a mixed longitudinal method.20
This study followed the ethic principles of research with human beings according to the CNS Directive no. 196/96 and was approved by the Ethics in Research Committee of Universidade Federal do Paraná (UFPR), Curitiba.
Anthropometry and body composition
Body mass was measured to the nearest 100 grams using a digital scale (PLENNA). Adolescents were examined while standing, barefoot and wearing only light clothes. Their weight was measured twice, and the arithmetic mean for their weight was calculated. If there were differences greater than 200 grams, their weight was measured a third time.21 The scale was calibrated every six months according to the standard procedures of the laboratory of the Center of Research in Exercise and Sports of the institution where the study was conducted.
Height was measured to the nearest 0.1 cm using a portable wall-mounted stadiometer (WCS). The adolescents were barefoot and standing on the stadiometer base at a square angle with the vertical rod of the stadiometer. Anatomic references were checked during the measurement: heels, which should be together, the position of the hips (gluteal region) and of the scapulae (thoracic region). The arms were held free along the body, with the palms turned toward the thighs, and the head was centralized and positioned anatomically in the Frankfort position. The adolescents were told to hold their breath at the time of measurement. Two measurements were made, and the mean of the two values was calculated; if the difference between the two was greater than 0.2 cm, another measurement was made.21
BMI was calculated by dividing body mass by height squared: BMI = body mass (kg) / height (m)2
The cut-off points for overweight (85th percentile) and obesity (95th percentile) were compared with the reference values described by Conde and Monteiro14 for a representative Brazilian population, by Cintra et al.,22 for a reference population in a Brazilian state capital, as Curitiba is also a state capital, and by Cole et al.,12 whose values are used as the international reference recommended by the International Obesity Task Force (IOTF). The cut-off points of these reference values for ages 10 to 14 years for both sexes are shown in Table 1.
All those involved in measurements were previously trained for the evaluations in the Center of Research in Exercise and Sports of Universidade Federal do Paraná, Curitiba.
Statistical analysis
Data about body mass and height for each age group were described as means and standard deviations. Sample distribution was evaluated using the Kolmogorov-Smirnov test for normality and the Lilliefor correction estimated at p < 0.05 for all ages of both sexes according to a Gaussian distribution. Frequency tables were built according to the percentile distribution.
BMI values were previously ordered from the lowest to the highest value and then subdivided into 100 parts of equivalent size, called percentiles, and the corresponding values were used for the 5th to the 95th percentile. A nonparametric binomial test was used to detect the proportionality of the cut-off points of the 85th and 95th percentiles calculated in this study in comparison with the cut-off points in Brazilian14,22 and international12 reference values at a 95% confidence interval.
RESULTS
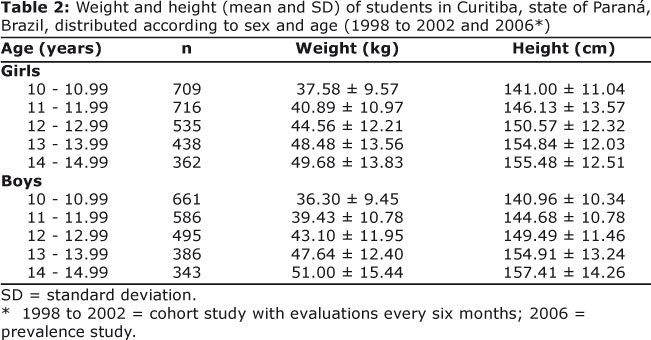
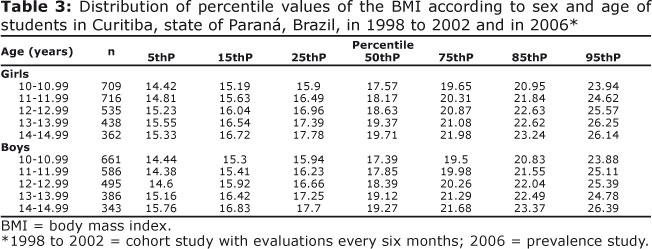
Table 2 shows the distributions of weight and height of boys and girls according to age. BMI percentile values are shown in Table 3 according to sex and age group.
The comparisons of BMI values corresponding to the 85th percentile are shown in Table 1. The comparison of BMI for students in Curitiba and the Brazilian reference values14 revealed that the BMI in the 85th percentile of the Brazilian table corresponded to a lower percentile for all ages and both sexes.
The comparison of results with the reference values22 for the same percentile revealed statistically greater values in Curitiba for all ages in the group of girls; in the group of boys, the same was found for ages 10 to 13 years, but no statistical differences were found for age 14 years (Table 1).
The comparisons with the international reference value12 revealed that the values for girls were statistically lower for ages 10, 11 and 12 years; however, for ages 13 and 14 years, the values were similar to those in the 85th percentile for girls in Curitiba, and there were no statistically significant differences. For boys, however, there were statistically significant differences for ages 10, 11, 12 and 13 years, but no significant differences were found for age 14 years (Table 1).
The analysis of the 95th percentile, considered the cut-off point for obesity, showed that the Brazilian reference values were statistically lower for ages 10, 11 and 12 years; however, for ages 13 and 14 years, there were no statistically different values for girls. For boys, there were statistically significant differences for ages 10, 12 and 13 years, but not for ages 11 and 14 years (Table 1).
The comparison with regional reference values showed that the 95th percentile for girls had statistically greater values for ages 10, 11 and 12 years, but not for ages 13 and 14 years. For boys, however, there were statistically greater values for ages 10, 11, 12 and 13 years, but not for age 14 years (Table 1).
The comparison with the international reference values revealed that girls had significantly greater percentiles for ages 11 and 12 years, but not for ages 10, 13 and 14 years, whose values were very close to those in the 95th percentile. For boys, however, values were similar for ages 10, 11, 12 and 14 years, but not for age 13 years, in which group the value was significantly greater (Table 1).
DISCUSSION
This study defined BMI percentiles for the population of adolescents up to 14 years of age in Curitiba. This is the first BMI reference table developed in this city using a mixed longitudinal method. Reference values to evaluate the nutritional status of children and adolescents should be used with caution.20 According to Goldstein and Tanner,15 each geographical region should have its own reference values, and their definition should take into consideration ethnic, cultural and social characteristics of each region.
Although numerous Brazilian and international studies have described cut-off points for BMI, the discussion about the applicability of these reference values for the Brazilian population is restricted to a few publications.24-26
The comparison of the cut-off point suggested in the literature to define overweight, that is, the 85th percentile, revealed significant differences between the reference values selected and the data obtained in our study.
For ages 10 to 14 years and both sexes, BMI for overweight is not the same as the reference values defined by Conde and Monteiro14 as these values were lower in our study. A BMI of 18.63 for 10-year-old girls is classified as overweight by Conde and Monteiro14 but the same BMI value in our study corresponded to the 64th percentile and is not, therefore, classified as overweight. This means that, as a group, children in this study have a BMI for overweight that was greater than that found for a representative Brazilian population. If the Brazilian curve were used in Curitiba, more individuals would be classified as overweight.
In a similar way, if the regional reference values defined for the city of São Paulo, state of São Paulo, Brazil22 were used in Curitiba, a smaller number of individuals would be classified as overweight because the percentile values suggested for ages 10 to 14 years for girls and 10 to 13 years for boys were greater than those found in our study. As a group, the adolescents in our study had lower cut-off points for overweight than those found for a population in the São Paulo region.
When compared with the study conducted by Cole et al.12 which evaluated British, Brazilian, American, Dutch and Singaporean children, BMI values to define overweight and their corresponding percentiles seem to be controversial. There were no differences for ages 13 and 14 years for girls and age 14 years for boys. However, at lower ages, the Cole et al.12 reference values may also overestimate the number of adolescents with overweight in Curitiba.
Similar results were described by Vieira et al.,24 who evaluated 610 adolescents aged 12 to 19 years in the city of Niterói, Brazil, and compared values with the BMI reference values defined by Cole et al.12 The authors showed that the use of the international reference values may result in the classification of up to 60% of the sample as overweight.
The analysis of the 95th percentile, suggested as the cut-off point to define childhood obesity, revealed a greater homogeneity of results, and some percentiles in our sample were not different from those in other Brazilian or international studies.
In the groups of girls, our study found a BMI greater than the reference value defined by Conde and Monteiro for obesity; therefore, more girls would be classified as obese at ages 10 to 12 years. In contrasts, when compared with the reference values for São Paulo, a smaller number of adolescents would be classified as obese at ages 10 to 12 years. At ages 13 and 14 years, the values found for both Brazilian comparisons were similar.
Among boys, both reference tables classified a smaller number of individuals as obese. Significant differences from the international reference values were less frequent and found only for ages 11 and 12 years for girls and 13 years for boys; if used, a smaller number or individuals would be classified as obese.
Barbosa et al.27 conducted a study with 181 children aged 5 to 10 years and found a positive concordance between the reference values defined by Conde and Monteiro14 and by Cole et al.12 for the diagnosis of obesity among girls. For boys, there was no concordance. It should be kept in mind that, in the development of the study by Cole et al.,12 part of the Brazilian sample came from the study by Monteiro et al.28
The differences that we found, that is, lower BMI values among adolescents in Curitiba than among children in the city of São Paulo evaluated by Cintra et al.,22 had already been observed by other authors that compared the reference values for São Paulo with the ones defined by Anjos et al.,29 who found that the cut-off points for overweight and obesity were lower than those found for the population in the city of São Paulo.
Vitolo et al.,30 in a study to define sensitivity and specificity of the Brazilian14 and international12 cut-off points for overweight, found that both had excellent specificity and a variable sensitivity between sexes, but the Brazilian reference values14 had higher negative predictive values for both sexes. In the same line of research, Christofaro et al.25 found that the Brazilian reference values had greater accuracy in determining high blood pressure among adolescents. Both studies praised the use of national values and their cut-off points for the evaluation of nutritional status.25,30 In contrast, Silva et al.26 found that the nutritional status of Brazilians is similar to that of the populations of developed countries, and that the use of international tables is acceptable.
All the studies mentioned above included a large number of evaluations, which may result in some variation in the results. In the epidemiological study conducted by Conde and Monteiro14 in several regions of Brazil, many evaluators were responsible for data collection. In our study, we tried to minimize this effect, and the evaluations were all conducted by technicians that were previously trained in our laboratory for that purpose.
Another factor that might have contributed to the different percentile results was the time interval between each study. The study conducted by Conde and Monteiro14 included evaluations made in the end of the 1980s (1989). Our study was conducted in the end of the 1990s (1998-2002). Studies in the literature draw attention to the fact that, in the last decades, changes in life styles, such as the adoption of hypercaloric diets and the reduction in physical activities, have favored weight gains in the population.31,32
Some of our findings may be associated with the phenomenon knows as a temporal trend, which suggests that a reference value should, ideally, be updated and discussed periodically. In Australia, a study conducted with adolescents revealed that BMI increased about 1.0 kg/m2 from 1985 to 1997.33 This temporal trend may also have played a role in our study, as we found a mean BMI increase of 1.62 kg/m2 between the data collected in 1989 and the current sample. In confirmation of the rapid transition of the nutritional epidemiological process in Brazil, demonstrated in other studies,34,35 the results of our study should be analyzed according to the different time points of the nutritional process. The dispersion found in this study may be assigned to the temporal heterogeneity of the sample under evaluation.
The cut-off point for overweight, that is, the 85th percentile, among very young adolescents showed great variations, and caution should be taken when using these values so that underestimation and overestimation of results are minimized according to the reference values used. For obesity, that is, the 95th percentile, variations seem to be smaller and, consequently, its diagnosis is more accurate.
Several factors should be taken into consideration when populations or samples are compared with national and international reference values; some of them are the ethnic and economic variations in the different regions of a country,36 which draw attention to the importance of defining references for each region and constantly updating them to follow up the temporal trends of BMI among adolescents.
REFERENCES
1. Unicef (Fundo das Nações Unidas para a Infância). Estratégia para melhorar a nutrição de crianças e mulheres nos países em desenvolvimento: um exame de políticas. New York: Unicef, 1990. [ Links ]
2. Kenchaiah S, Evans JC, Levy D, Wilson PWF, Benjamin EM, Larson MG, Kannel WB, Vasan RS. Obesity and the risk of heart failure. New England Journal of Medicine. 2002; 347(5): 305-313. [ Links ]
3. Bhargava Sk, Sachdev, Hs, Fall Ch, Osmond C, Lakshmy R, Barker Dj. Relation of serial changes in childhood body-mass index to impared glucose tolerance in young adulthood. New England Journal of Medicine. 2004; 350(9): 865-875. [ Links ]
4. Buchan IE, Bundred PE, Kitchiner DJ and Cole TJ. Body mass index has risen more steeply in tall than in short 3-year olds: serial cross-sectional surveys 1988-2003 - International Journal of Obesity. 2007; 31: 23-29. [ Links ]
5. Parsons TJ, Power C, Logan S, Summerbell CD. Childhood predictors of adult obesity: a systematic review. Int J Obes Relat Metab Disord. 1999; 23: S1-107. [ Links ]
6. Alves J.G., Figueira F. Doenças do adulto com raízes na infância. 1 ed. Recife: Bargaço, 1998. 123p. [ Links ]
7. Barker DJP, Eriksson JG, Forsén T.; Osmond, C. Fetal origins of adult disease: strength of effects and biological basis. International Journal of Epidemiology. 2002, 31:1235-1239. [ Links ]
8. Magalhães VC, Mendonça GAS. Prevalência e fatores associados a sobrepeso e obesidade em adolescentes de 15 a 19 anos das regiões Nordeste e Sudeste do Brasil,1996 a 1997. Cad. Saúde Pública. 2003; 19: S129-S139. [ Links ]
9. World Health Organization. Obesity: preventing and managing the global epidemic. Report of theWHO Consultation on Obesity.Geneva: WHO; 1998. [ Links ]
10. Stettler N. Comment: the global epidemic of childhood obesity: is there a role for the pediatrician? Obesity Review. 2004; 5 Suppl 1:1-3. [ Links ]
11. Bellizzi MC, Dietz WH. Workshop on childhood obesity: summary of the discussion. American Journal Clinical Nutrition. 1999;70: 173S-5S. [ Links ]
12. Cole TJ, Bellizzi MC, Flegal KM, DietzWH. Establishing a standard definition for child overweight and obesity worldwide: international survey. British Medical Journal. 2000; 320:1240-3. [ Links ]
13. Must A, Dallal GE, Dietz WH. Reference data for obesity: 85th and 95th percentiles of body mass index (wt/ht2) and triceps skinfold thickness. American Journal Clinical Nutrition. 1991; 53:839-46. [ Links ]
14. Conde WL, Monteiro CA. Body mass index cutoff points for evaluation of nutritional status in Brazilian children and adolescents. Jornal de Pediatria. 2006; 82: 266-72. [ Links ]
15. Goldstein H, Tanner JM. Ecological considerations in the creation and the use of child growth standards. Lancet. 1980; 1 :582-585. [ Links ]
16. Abrantes MM, Lamounier JA, Colosimo EA. Prevalência de sobrepeso e obesidade nas regiões nordeste e sudeste do Brasil. Rev Assoc Med Bras. 2003; 49(2): 162-6. [ Links ]
17. Costa RF, Cintra IP, Fisberg M. Prevalência de sobrepeso e obesidade em escolares da cidade de Santos, SP. Arquivos Brasileiro Endocrinologia Metabolismo. 2006;50:60-7. [ Links ]
18. Fagundes AN., Ribeiro DC, Naspitz L, Garbelini L EB., Vieira J KP., Silva A P et al . Prevalência de sobrepeso e obesidade em escolares da região de Parelheiros do município de São Paulo. Rev. paul. pediatr. 2008 Sep; 26(3): 212-217. [ Links ]
19. Instituto Brasileiro de Geografia e Estatística (IBGE). Pesquisa de orçamentos familiares: Análise da disponibilidade domiciliar de alimentos e do estado nutricional no Brasil. Disponível em: http://www.ibge.gov.br Acesso em novembro de 2007. [ Links ]
20. Zeferino AMB, Barros Filho AA, Bettiol H, Barbieri MA. Acompanhamento do crescimento. Jornal de Pediatria. 2003; 79(Supl.1): S23-S32. [ Links ]
21. Tritschler K. Medida e avaliação em educação física e esportes de Barrow & McGee. 5 ed. Barueri-SP: Manole, 2003. [ Links ]
22. Cintra IP, Passos MA, Fisberg M, Machado HC. Evolution of body mass index in two historical series of adolescents. Jornal de Pediatria. 2007; 83(2): 157-162. [ Links ]
23. Marcondes E. Desenvolvimento da criança desenvolvimento biológico - crescimento. Rio de Janeiro: Sociedade Brasileira de Pediatria, 1994. [ Links ]
24. Vieira ACR et al. Desempenho de pontos de corte do índice de massa corporal de diferentes referências na predição de gordura corporal em adolescentes. Cad. Saúde Pública. 2006; 22(8): 1681-1690. [ Links ]
25. Barbosa RMS, Soares EA. Lanzilloti H. S. Avaliação do estado nutricional de escolares segundo três referências. Revista Paulista de Pediatria. 2009;27(3): 243-50. [ Links ]
26. Monteiro CA, Benicio M.H.D'A., Iunes R, Gouveia NC, Taddei JAAC, Cardoso MAA. Nutritional status of Brazilian children: trends from 1975 to 1989. Bulletin of the World Health Organization. 1992; 70 (5): 657-666. [ Links ]
27. Anjos LA, Veiga GV, Castro IRR. Distribuição dos valores do índice de massa corporal da população brasileira até 25 anos. Rev Panam Salud Publica. 1998; 3:164-73. [ Links ]
28. Calcaterra V, Klersy C, Muratori T, Telli S, Caramagna C, Scaglia F. Prevalence of metabolic syndrome (MS) in children and adolescents with varying degrees of obesity. Clinical Endocrinology. 2008; 68: 868-72. [ Links ]
29. Economos CD. Less exercise now, more disease later? The critical role of childhood exercise interventions in reducing chronic disease burden. Nutrition in Clinical Care. 2001; 4: 306 - 403. [ Links ]
30. Booth ML, Chey T, Wake M. Change in the prevalence of overweight and obesity among young Australian. American Journal Clinical Nutrition. 2003; 77: 29-36. [ Links ]
31. Batista Filho, M.; Assis, AMO, Kac, G. Transição Nutricional: conceito e características. In: Kac, G.; Shieri, R.; Gigante, D. P. Epidemiologia Nutricional. Rio de Janeiro: Atheneu, 2007. 579 p. [ Links ]
32. Batista Filho, M.; Rissin, A. A transição Nutricional no Brasil: tendências regionais e temporais. Cadernos de Saúde Pública. 2003; 19: S181-S191. [ Links ]
33. Batista Filho M, Miglioli TC, Santos MC. Anthropometric normality in adults: the geographical and socio-economic paradox of the nutritional transition in Brazil. Revista Brasileira Saúde Materno Infantil. 2007; 7 (4): 487-493. [ Links ]
34. Christofaro DGD, Fernandes RA, Polito MD, Romanzini M, Ronque ENV, Gobbo LA, Oliveira AR. Comparação entre pontos de corte para excesso de peso na detecção de pressão arterial elevada em adolescentes. Jornal de Pediatria. 2009; 85 (4): 353-358. [ Links ]
35. Silva DAS, Pelegrini A, Petroski EL, Gaya ACA. Comparação do crescimento de crianças e adolescentes brasileiros com curvas de referência para crescimento físico: dados do Projeto Esporte Brasil. Jornal de Pediatria. 2010; 86(2) : 115-120. [ Links ]
36. Vitolo MR, Campagnolo PDB, Barros ME, Gama CM, Lopez FA. Avaliação de duas classificações para excesso de peso em adolescentes brasileiros. Revista de Saúde Pública. 2007; 41(4): 653-656. [ Links ]
Manuscript submitted
Feb 06 2011, accepted for publication Aug 20 2011. Correspondence to:
luismsk@uol.com.br

