


Services on Demand
article
 text in
  English (pdf)
 Article in xml format
 Article references
Indicators

Share

 Permalink
Journal of Human Growth and Development
Print version ISSN 0104-1282
Rev. bras. crescimento desenvolv. hum. vol.22 no.2 São Paulo 2012
ORIGINAL RESEARCH
Heart rate variability in healthy adolescents at rest
Franciele Marques VanderleiI; Renata Claudino RossiII; Naiara Maria de SouzaIII; Denise Aparecida de SáIV; Tatiana Mangetti GonçalvesIV; Carlos Marcelo PastreV; Luiz Carlos de AbreuVI; Vitor Engrácia ValentiVII; Luiz Carlos Marques VanderleiV
IDoutorado em Medicina (Cardiologia). Universidade Federal de São Paulo - UNIFESP, São Paulo, SP, Brasil
IIDoutorado em Ciências da Saúde. Faculdade de Medicina do ABC - FMABC, Santo André, SP, Brasil
IIIMestre em Fisioterapia. Faculdade de Ciências e Tecnologia - FCT/UNESP, Presidente Prudente, SP, Brasil
IVGraduada em Fisioterapia na Faculdade de Ciências e Tecnologia - FCT/UNESP, Presidente Prudente, SP, Brasil
VDepartamento de Fisioterapia - Faculdade de Ciências e Tecnologia - FCT/UNESP, Presidente Prudente, SP, Brasil
VILaboratório de Escrita Científica - Faculdade de Medicina do ABC - FMABC, Santo André, SP, Brasil
VIIDepartamento de Fonoaudiologia - Faculdade de Filosofia e Ciências - FFC/UNESP, Marília, SP, Brasil
ABSTRACT
OBJECTIVE: to describe the cardiac autonomic function in healthy adolescents between 13 and 18 years old.
METHODS: data from 93 adolescents, of both sexes, were analyzed; they were divided into three groups according to age. Group A 13-14 years old (n=26), Group B 15-16 years old (n = 30) and Group C 17-18 years old (n = 17). The protocol consisted of raising the heart rate, beat by beat for twenty minutes of rest in supine position with spontaneous breathing. The cardiac autonomic behavior analysis was performed by the method of heart rate variability (HRV) through the indices of the Poincaré plot (SD1, SD2 and ratio SD1/SD2) and its qualitative analysis and indices in linear time domain (RMSSD and SDNN) and frequency (LFnu, HFnu and LF/HF). One-way ANOVA test or Kruskal-Wallis test was used for comparison between groups, with a significance level of 5%.
RESULTS: there was no significant difference in none of the indices compared the three groups. In addition,visual analysis of Poincaré plot has observed for all age groups large dispersion of RR intervals, indicating that these groups have good HRV.
CONCLUSION: there were no changes in HRV in the different age groups analyzed, however the result allowed to establish a standard for each group that was studied, becomes an important tool for comparison of cardiac autonomic function between healthy and patients subjects or in different areas.
Key words: heart rate; autonomic nervous system; cardiology; adolescent.
INTRODUCTION
The autonomic nervous system (ANS) promotes changes in the heart due to tissue and metabolic needs that the individual is subject during their activities of daily living1,2. The influence of the sympathetic and parasympathetic systems of the ANS on the heart determines the heart rate variability (HRV), a non-invasive method that evaluates the fluctuations in heart rate (HR) caused by adjustments of the SNA on the cardiovascular system3-5 and it allows the identification of a phenomena related to SNA6.
Analysis of HRV may be done either by means of linear methods, analyzed in the time and frequency domain, and the nonlinear methods7. Among the methods used for analysis of HRV we may include the Poincaré plot, one dimensional graphical representation of the correlation between consecutive RR intervals, in which each RR interval is plotted against the next interval8-10.
The plot Poicaré may be quantitatively analyzed by means of the following indexes: SD1, SD2 and SD1/SD2 obtained by fitting the ellipse formed by the attractor of the figure11,12. It may be qualitatively assessed through the shape formed by its attractor, which shows the degree of RR intervals complexity13,14.
The analysis of the Poincaré plot has been considered by some authors as a nonlinear dynamics method10,15. Although it is still scarce in the clinical literature, the nonlinear methods helps to understand the system behavior that linear models do not explain, since there is evidence that the mechanisms involved in cardiovascular regulation likely interact in a nonlinear way16,17.
The literature indicates that one of the aspects that may modify the contents of HRV is age2,18,19. In this context, Finley & Nugent18 reported increased sympathetic and parasympathetic activity in individuals aged from one month to six years old, followed by a decrease up to 24 years old. Migliaro et al.20 aimed to evaluate 15 to 20 years old subjects and observed decrease in HRV with advancing age. Moreover, Goto et al.21 observed that the high frequency (HF) component increases with age between three and six years old and decreases between six and 15 years old.
Despite the nonlinear behavior is predominant in human systems, studies regarding autonomic function in different age groups using HRV as a tool to measure, evaluate the variability indices, mainly using linear methods of analysis. Thus, the objective is to describe the cardiac autonomic function of healthy adolescents between 13 and 18 years.
METHODS
Population
It analyzed 93 adolescents of both sexes aged between 13 and 18 years old and body mass index (BMI) classified as normal22, randomly selected, which were divided into three groups according to age. Group A consisted of 26 volunteers from 13 to 14 years old (13 females and 13 males), group B consisted of 30 volunteers from 15 to 16 years old (ten female and 20 male) and Group C consisted of 17 volunteers from 17 18 years old (five female and 12 male).
We excluded volunteers who presented at least one of the following conditions: infections, metabolic and cardiorespiratory disorders, use of medications that could alter the cardiac autonomic activity, such as propranolol and atropine, alcohol and tobacco.
The volunteers were informed about the procedures and objectives of the study, and after agreeing, they signed a consent form. All procedures were approved by the Ethical Committee in Research of the Faculty of Science and Technology of Presidente Prudente - FCT/UNESP (Proc. No. 260/2008) and followed the rules established by Resolution 1996/96 of the National Health Council.
Procedures
The procedures were performed at a room temperature between 21ºC and 23ºC and humidity was monitored between 40% to 60% at the same period of the day (2 p.m. to 6 p.m.) in order to mitigate the possible influence of the circadian rhythm. All volunteers were instructed to abstain from caffeine and physical activity for at least 8 hours before data collection.
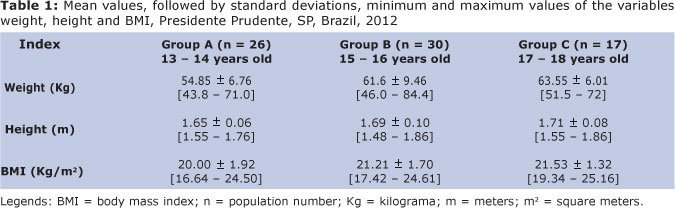
Before beginning the experimental procedure, the volunteers were identified by collecting the following information: age, sex, weight, stature and BMI. Anthropometric measurements were obtained according to the recommendations described by Lohman et al.23.
Weight was measured through a digital scale (Filizzola PL 150, Filizzola Ltda., Brazil) with an accuracy of 0.1kg, with volunteers wearing light clothing and no shoes. The stature was measured using a stadiometer accurate to 0.1cm in length and 2 meters. The BMI was calculated using the following formula: weight (kg)/stature (m)2.
After these procedures, we set up a pickup band at the height of xiphoid process, which consists of two electrodes with a sealed electronic transmitter, where the heart's electrical impulses are transmitted via an electromagnetic field Polar S810TM monitor (Polar Electro, Kempele, Finland) placed on the wrist of the volunteer. This tool is a portable and validated tool that captures the heart rate beat to beat and use its data for analysis of HRV24-26.
The experimental protocol consisted of 20 minutes to capture the heart rate at rest, continuously, with the volunteer supine on a mat performing spontaneous breathing. The volunteers were instructed to not perform movements of large amplitude, and to not sleep or talk during the data collection, which was done individually.
For HRV analysis, the pattern of behavior was recorded beat to beat during the entire protocol, with a sampling rate of 1000 Hz for data analysis we used in 1000 consecutive RR intervals after digital and manual filtering, to eliminate premature ectopic beats and artifacts. Only series with more than 95% of sinus beats were included in the study27.
Heart rate variability indices analysis
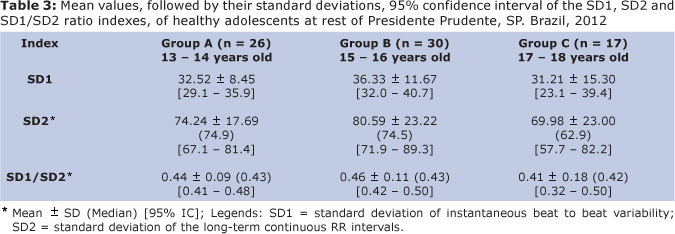
HRV was analyzed by means of the Poincaré plot and linear methods, in the time and frequency domain. The Poincaré plot allows each RR interval to be represented as a function of the next interval. For quantitative analysis of the plot we calculated the following indices: SD1 (standard deviation of instantaneous beat to beat variability), SD2 (standard deviation of the long-term continuous RR intervals) and the SD1/SD2 ratio12.
Qualitative analysis of the Poincaré plot was made by analyzing the figures formed by its attractor, which were described by Tulppo et al.28:
1) Figure in which an increased dispersion of the RR intervals is observed with an increase in the ranges profile of a normal plot.
2) Figure with a small global beat to beat dispersion and without increased dispersion of RR intervals over the long term.
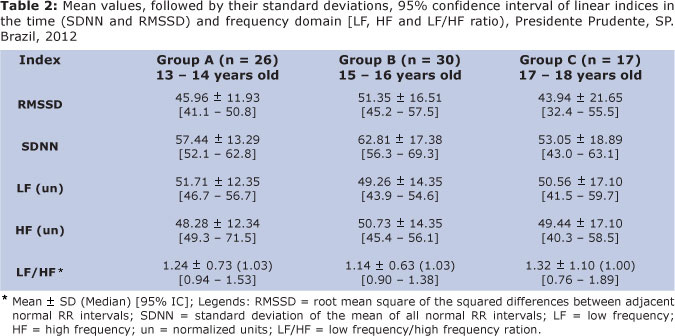
In the time domain, the root mean square of the squared differences between adjacent normal RR intervals (RMSSD) and the standard deviation of the mean of all normal RR intervals (SDNN) were used. For HRV analysis in the frequency domain, we used the spectral components of low frequency (LF, 0.04 to 015 Hz) and high frequency (HF, 0.15 to 0.40 Hz) in normalized units (LFun and HFun, respectively), which represents a value relative to each spectral component in relation to the total power minus the very low frequency (VLF) components, and the relationship between these components (LF/HF ratio). Spectral analysis was calculated using the algorithm of fast Fourier transform. Kubios HRV software (version 2.0) was used to calculate these indices29.
Statistical analysis
Descriptive statistics were used to characterize the profile of the sample, with data represented as mean, standard deviation, median, maximum, minimum and 95% confidence intervals. Normality of the data was determined using the Shapiro-Wilk test.
To compare the HRV indices between the three groups were applied the analysis of variance (one-way ANOVA) when the distribution was parametric (RMSSD, SDNN, LFun, HFun and SD1) and the Kruskal-Wallis test for non-parametric data (SD2 index, compared SD1/SD2 and the LF/HF). Differences were considered significant when the probability of a Type I error was lower than 5% (p < 0.05).
RESULTS
Analyses were performed initially separated by sexes. However, there were no significant differences between sexes. As a consequence, the analyzes were performed without distinction.
The anthropometric profile of the volunteers is shown in Table 01. There were no significant differences between groups, thus, indicating the homogeneity of the groups.
Table 2 presents the values of the indices analyzed in the time (SDNN and RMSSD) and frequency (LFun, HFun and the LF/HF) domain. There was no statistical difference between the groups (p > 0.05).
Table 3 shows the values of SD1, SD2 and SD1/SD2 ratio indices analyzed by means of the Poincaré plot. We also found no significant differences between the groups (p > 0.05).
Figure 1: shows an example of qualitative analysis of the Poincaré plot in the three groups.
DISCUSSION
The cardiac autonomic modulation by means of HRV indices obtained from the Poincaré plot and analysis in domain the time and frequency, is a resource to be used to study, monitor and describe autonomics modulations in healthy adolescents between 13 and 18 at rest.
The SD1 index, which represents the transverse axis of the Poincaré plot and indicates the parasympathetic influence on the sinoatrial node11,30 showed no significant difference between the groups. The same was observed for RMSSD and HFun, both markers of the parasympathetic activity. Small increases in the average of these rates in the age group between 15 and 16 years old (Group B) were observed in relation to 13-14 years old (Group A) and 17 and 18 years old (group C).
Conversely, Finley & Nugent18 evaluated HRV in individuals from one month to 24 years old and observed, in general, an increase in LF, HF and total power up to six years old followed by a decrease to 24 years old. Significant increase in the HF spectral component for three to six years old and reduction of this index for subsequent ages from six to 15 years old were also described during sleep in children between three and 15 years old21.
By analyzing older subjects, Paschoal et al.2, evaluated individuals aged between 20 and 60 years old. They were divided into four age groups with an interval of ten years, at rest and during change of position they observed both reduced HRV and progressive decrease in the magnitude of the ANS response forward the position change with advancing age.
The longitudinal axis of the Poincaré plot, represented by the SD2 index, which indicates overall variability7, also showed no significant difference between groups and so on for the SDNN index, which reflects the same behavior7.
In relation to the LFun index, which indicates the sympathetic activity, we also found no differences between groups. Increase in this index with advancing age was reported by Vuksanovic & Gal31, when evaluated volunteers aged between eight and 61 years old.
As noted above, the present results did not show convergence with other studies that evaluated HRV in different age groups, which indicate that with advancing age HRV tends to decline due to aging of the SNA. However, in the age groups evaluated in this study, the decrease in HRV was not observed, which may be explained by the fact that those studies consider groups with a higher range of ages, unlike the present study, whose ages were established in smaller groups, suggesting that in the age group studied there were no changes in SNA that could change the HRV indices.
In relation to the LF/HF ratio, which express the relationship between the sympathetic and parasympathetic components of the SNA, and the SD1/SD2 ratio, which indicates the relationship between overall HRV and parasympathetic, we did not find differences between the three groups. Values of LFun and HFun point to a balance between the sympathetic and parasympathetic systems.
In relation to the visual analysis of the Poincaré plot we observed for all age groups large dispersion of RR intervals, indicating that these groups present good HRV. In healthy subjects, at rest, beat to beat intervals are irregular; making the plot to be seemed similar to an ellipse7,28, which was observed in this study.
Some limitations of the study that may have influenced the results obtained should be pointed out. In the population studied was not assessed the level of physical activity, which might have added important discussions for the study, which represents a limitation.
The use of HRV to assess autonomic modulation in research and clinical practice has increased in recent years and the results of this study allow us to establish a profile of HRV in adolescents, which may be important for researchers and clinicians to realize further comparison between healthy subjects and patients of diseases or in different areas.
REFERENCES
1. Neves VFC, Perpétuo NM, Sakabe DI, Catai AM, Gallo Jr L, Silva de Sá MF, et al. Análise dos índices espectrais da variabilidade da frequência cardíaca em homens de meia idade e mulheres na pós-menopausa. Rev Bras Fisioter. 2006; 10(4):401-6. Doi: http://dx.doi.org/10.1590/S1413-35552006000400007 [ Links ]
2. Paschoal MA, Volanti VM, Pires CS, Fernandes FC. Variabilidade da frequência cardíaca em diferentes faixas etárias. Rev Bras Fisioter. 2006; 10(4):413-9. Doi: http://dx.doi.org/10.1590/S1413-35552006000400009 [ Links ]
3. Grupi CJ. Variabilidade da Frequência Cardíaca. 1998 [Citado 2008 Abr 14]; Disponível em: http://www.cardios.com.br/Jornais/jornal-02/tese.htm/ [ Links ]
4. Ribeiro TF, Azevedo GD, Crescencio JC, Maraes VR, Papa V, Catai AM, et al. Heart rate variability under resting conditions in postmenopausal and young women. Braz J Med Biol Res. 2001; 34(7):871-7. Doi: http://dx.doi.org/10.1590/S0100-879X2001000700006 [ Links ]
5. Lopes FL, Pereira FM, Reboredo MM, Castro TM, Vianna JM, Novo Jr JM, et al. Redução da variabilidade da frequência cardíaca em indivíduos de meia-idade e o efeito do treinamento de força. Rev Bras Fisioter. 2007; 11(2):113-9. Doi: http://dx.doi.org/10.1590/S1413-35552007000200005 [ Links ]
6. Task Force of the European Society of Cardiology and the North American Society of Pacing and Electrophysiology. Heart rate variability: standards of measurement, physiological interpretation and clinical use. Circulation. 1996; 93(5):1043-65. Doi: 10.1161/01.CIR.93.5.1043 [ Links ]
7. Vanderlei LCM, Pastre CM, Hoshi RA, Carvalho TD, Godoy MF. Noções básicas de variabilidade da frequência cardíaca e sua aplicabilidade clínica. Rev Bras Cir Cardiovasc. 2009; 24(2):205-17. Doi: http://dx.doi.org/10.1590/S0102-76382009000200018 [ Links ]
8. Smith AL, Reynolds KJ, Owen H. Correlated Poincaré indices for measuring heart rate variability. Australas Phys Eng Sci Med. 2007; 30(4):336-41. [ Links ]
9. Lerma C, Infante O, Pérez-Grovas H, José MV. Poincaré plot indexes of heart rate variability capture dynamic adaptations after haemodialysis in chronic renal failure patients. Clin Physiol Funct Imaging. 2003; 23(2):72-80. Doi: 10.1046/j.1475-097X.2003.00466.x [ Links ]
10. Khaled AS, Owis MI, Mohamed ASA. Employing time-domain methods and poincaré plot of heart rate variability signals to detect congestive heart failure. BIME Journal. 2006; 6(1):35-41. [ Links ]
11. Tulppo MP, Makikallio TH, Takala TES, Seppanen T, Huikuri HV. Quantitative beat-to-beat analysis of heart rate dynamics during exercise. American Journal of Physiology (Heart Circ. Physiol.) 1996; 271(7):H244-H252. [ Links ]
12. Brunetto AF, Silva BM, Roseguini BT, Hirai DM, Guedes DP. Limiar ventilatório e variabilidade da freqüência cardíaca em adolescentes. Rev Bras Med Esporte. 2005; 11(1):22-7. Doi: http://dx.doi.org/10.1590/S1517-86922005000100003 [ Links ]
13. Woo MA, Stevenson WG, Moser DK, Trelease RB, Harper RM. Patterns of beat to beat heart rate variability in advanced heart failure. Am Heart J. 1992; 123(3):704-10. Doi: http://dx.doi.org/10.1016/0002-8703(92)90510-3 [ Links ]
14. Vito GD, Galloway SDR, Nimmo MA, Maas P, McMurray JJV. Effects of central sympathetic inhibition on heart rate variability during steady-state exercise in healthy humans. Clin Physiol & Func Im. 2002; 22(1):32-8. Doi: 10.1046/j.1475-097X.2002.00395.x [ Links ]
15. Voss A, Schroeder R, Truebner S, Goernig M, Figulla HR, Schirdewan A. Comparison of nonlinear methods symbolic dynamics, detrended fluctuation, and Poincaré plot analysis in risk stratification in patients with dilated cardiomyopathy. Chaos. 2007; 17(1):015120. Doi: http://dx.doi.org/10.1063/1.2404633 [ Links ]
16. Higgins JP. Nonlinear systems in medicine. Yale J Biol Med. 2002; 75(5-6):247-60. [ Links ]
17. Huikuri HV, Makikallio TH, Perkiomaki J. Measurement of Heart Rate Variability by Methods Based on Nonlinear Dynamics. J of Electrocardiol. 2003; 36(Suppl):95-9. Doi: 10.1016/j.jelectrocard.2003.09.021 [ Links ]
18. Finley JP, Nugent ST. Heart rate variability in infants, children and young adults. J Auton Nerv Syst. 1995; 51(1):103-8. Doi: http://dx.doi.org/10.1016/0165-1838(94)00117-3 [ Links ]
19. Meersman RE, Stein PK. Vagal modulation and aging. Biol Psychol. 2006; 74(2):165-73. Doi: http://dx.doi.org/10.1016/j.biopsycho.2006.04.008 [ Links ]
20. Migliaro ER, Contreras P, Bech S, Etxagibel A, Castro M, Ricca R, et al. Relative influence of age, resting heart rate and sedentary life style in short-term analysis of heart rate variability. Braz J Med Biol Res. 2001; 34(4):493-500. Doi: http://dx.doi.org/10.1590/S0100-879X2001000400009 [ Links ]
21. Goto M, Nagashima M, Baba R, Nagano Y, Nishibata K, Tsuji A. Analysis of heart rate variability demonstrates effects of development on vagal modulation of heart rate in healthy children. J Pediatr. 1997; 130(1):725-9. Doi: http://dx.doi.org/10.1016/S0022-3476(97)80013-3 [ Links ]
22. Cole TM, Bellizzi MC, Flegal KM, Dietz WH. Establishing a standard definition for child overweight and obesity worldwide: international survey. BMJ. 2000; 320(6):1-6. Doi: 10.1136/bmj.320.7244.1240 [ Links ]
23. Lohman TG, Roche AF, Martorell R. Anthropometric Standardization Reference Manual. Champaign: Human Kinetics Books; 1988. [ Links ]
24. Gamelin FX, Berthoins S, Bosquet L. Validity of the polar S810 heart rate monitor to measure R-R intervals at rest. Med Sci Sports Exerc. 2006; 38(5):887-93. Doi: 10.1249/01.mss. 0000218135.79476.9c [ Links ]
25. Kingsley M, Lewis MJ, Marson RE. Comparison of polar S810s and an ambulatory ECG system for RR interval measurement during progressive exercise. Int J Sports Med. 2005; 26(1):39-44. Doi: 10.1055/s-2004-817878 [ Links ]
26. Vanderlei LCM, Silva RA, Pastre CM, Azevedo FM, Godoy MF. Comparison of the Polar S810i monitor and the ECG for the analysis of heart rate variability in the time and frequency domains. Braz J Med Biol Res. 2008; 41(10):854-9. Doi: http://dx.doi.org/10.1590/S0100-879X2008005000039 [ Links ]
27. Godoy MF, Takakura IT, Correa PR. Relevância da análise do comportamento dinâmico não linear (Teoria do Caos) como elemento prognóstico de morbidade e mortalidade em pacientes submetidos à cirurgia de revascularização miocárdica. Arq Ciênc Saúde. 2005; 12(4):167-71. [ Links ]
28. Tulppo MP, Mäkikallio TH, Seppänen T, Laukkanen RT, Huikuri HV. Vagal modulation of heart rate during exercise: effects of age and physical fitness. Am J Physiol. 1998; 274(2Pt 2):H424-9. [ Links ]
29. Tarvainen MP, Niskanen JP, Lipponen JA, Ranta-aho PO, Karjalainen PA. Kubios HRV - A Software for Advanced Heart Rate Variability Analysis. ECIFMBE. 2008; 1022-5. [ Links ]
30. Lima JRP, Kiss MAPDM, Limiar de variabilidade da freqüência cardíaca. Revista Brasileira de Atividade Física e Saúde. 1999; 4(1):29-38. [ Links ]
31. Vuksanovic V, Gal V. Nonlinear and chaos characteristics of heart period time series: healthy aging and postural change. Autonomic Neuroscience: Basic and Clinical. 2005; 121(1-2):94-100. [ Links ]
 Corresponding author:
lcmvanderlei@fct.unesp.br
Manuscript submitted Jan 08 2011
Accepted for publication Aug 19 2011
