


Services on Demand
article
 English (pdf)
 Article in xml format
 Article references
Indicators

Share

 Permalink
Journal of Human Growth and Development
Print version ISSN 0104-1282
Rev. bras. crescimento desenvolv. hum. vol.24 no.1 São Paulo 2014
ORIGINAL RESEARCH
Chaotic global parameters correlation with heart rate variability in obese children
Franciele M. VanderleiI; Luiz Carlos M. VanderleiI; David M. GarnerII
IDepartment of Physiotherapy, UNESP - Univ Estadual Paulista - Presidente Prudente, Sao Paulo, Brazil
IIDepartment of Biological and Medical Sciences, Faculty of Health and Life Sciences, Oxford Brookes University, Gipsy Lane, Oxford OX3 0BP, United Kingdom
ABSTRACT
The aim of the study is to analyze heart rate dynamics in obese children by measures of HRV. HRV is a simple and non-invasive measure of autonomic impulses.
94 children of mixed gender aged eight to twelve years were divided into two equal groups based on body mass index: obese and normal weight range. HRV was monitored in the dorsal decubitus position for 20 minutes. After tests of normality, Kruskal Wallis was applied for the statistical analysis, with the level of significance set at (p < 0.05). Regarding the application of Principal Component Analysis the first two components represent 99.4% of total variance. The obese children exhibited in heart frequency dynamics associated to an increase in the Chaos Forward Parameter. The Chaos Forward Parameter which applies all three chaotic global parameters is suggested to be the most robust algorithm. Obesity in children can be termed a dynamical condition but it increases the chaotic response.
Key words: principal component analysis, electrocardiography, nonlinear dynamics.
INTRODUCTON
Investigation of asymmetrical fluctuations has been rigourously studied in the life sciences1-5. In general, Detrended Fluctuation Analysis (DFA)6 enforces data of interpeak intervals to characterize irregular and often chaotic variation. This is widely accepted for Electrocardiograph (ECG) traces where the RR interval of the PQRST-signature is appropriate. Nonetheless such algorithms may be too computationally processor intensive so they cannot be employed online; and are not effective on short time-series. Gathering data for analysis usually requires ambulatory monitoring for days or weeks7.
Spectral entropy8-11 and; later the new spectral techniques based on 'chaotic globals'12 attempt to overcome this disadvantage; avoiding the sparse data hazard. These computations are useful in monitoring surgical patients under anaesthesia13; or unable to communicate distress as in sleep apnea14 or dyspnea15,16. Assessment of chaotic states in this way is both quicker for diagnostic purposes and more efficient using less physician time; which is expensive.
With regards to dietary considerations, obesity is a major problem. Consequences include arterial hypertension, atherosclerosis, diabetes, sleep apnea and depression; amongst others17-20. Studies have shown that obesity produces abnormalities of the autonomic nervous system in children and young adults21,22. Autonomic behavior is assessed through Heart Rate Variability (HRV) a simple, non-invasive tool for the detection and study of cardiac irregularities in many conditions.
Obesity is simply defined as a function of body mass and height. However the perceived benefit for testing the correlation with HRV is that it can provide an indicator of the risk of cardiac failure and other dynamical diseases23 in such children. HRV analysis using non-linear dynamical techniques is becoming an important area of research. There is evidence that mechanisms involved in cardiovascular regulation interact with each other in a complex and chaotic manner. Usually, changes in the HRV patterns are an indicator of health status. High HRV is a signal of good adaptation and characterize a healthy person with efficient autonomic mechanisms. Whilst lower HRV is frequently an indicator of abnormal and insufficient adaptation of the autonomic nervous system; causing the subject low physiological function. The aim of this is to statistically determine which data is from normals and which obese children. Since the time-series are short we must apply chaotic global parameters; which rely on spectrally determined values; rather than temporal interpeak separations.
METHODS
Population
A total of 94 subjects of mixed gender between eight and twelve years of age were divided into two groups based on body mass index: obese and non-obese. Obesity was defined on body mass index established for age and gender. The number of obese and normal children was equal.
Children reported using drugs or diagnosed diseases were not included in this study. The volunteers and parents/guardians were duly informed as to the procedures and objectives of the study and, after agreeing to participate, the parents/guardians signed terms of informed consent. All procedures received approval from the ethics committee of the Faculdade de Ciências e Tecnologia - FCT/UNESP (Process no 187/2007).
Experimental protocol
Prior to beginning the experimental procedure, information was collected on age, gender, weight, height and body mass index. The anthropometric measurements were performed. Weight was determined using a digital scale (Filizzola PL 150, Filizzola Ltda., Brazil) with a precision of 0.1 kg, with the children barefoot and wearing light-weight clothing. Height was determined using a stadiometer with a precision of 0.1 cm. The data collection was carried out in a room with the temperature between 21ºC and 23ºC and relative humidity between 40% and 60%. Data were collected between 14hr and 17hr to minimize the interference of circadian rhythm.
After the initial evaluation, all procedures necessary for the data collection were explained on an individual basis and the children were instructed to remain at rest and avoid talking during the collection. The heart monitor belt was then placed over the thorax, aligned with the distal third of the sternum and the Polar S810i heart rate receiver (Polar Electro, Finland) was placed on the wrist. The equipment was previously validated for monitoring beat-by-beat heart rate and the use of these data for HRV analysis in children and adults. The children were placed in the dorsal decubitus position and remained at rest with spontaneous breathing for 20 minutes. After the collection, the child was discharged. The HRV behavior pattern was recorded beat-by-beat throughout the monitoring process at a sampling rate of 1000 Hz. Following digital filtering complemented with manual filtering for the elimination of premature ectopic beats and artifacts, a minimum of 1000 consecutive interbeat intervals were used for the data analysis. Only series with more than 95% sinus rhythm was included in the study.
Chaotic Global Parameters & Statistical Analysis
Here the time-series are short; we must consider the spectral properties. Typically, algorithms applied to power spectra converge faster than computed on inter-peak temporal separations. Accuracy is enhanced if there is any fine detailed structure when we use Welch method 24 for spectral entropy or spectral Detrended Fluctuation Analysis (sDFA). The spectral Multi-Taper Method (sMTM) applies the multi-taper spectrum25. The following sections 3.1 to 3.3, summarize the three chaotic global parameters based on power spectra. For further detailed treatment, please refer to Garner and Ling12.
Spectral Entropy
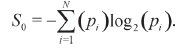
Spectral entropy11,26,27 is a function of Shannon entropy28,29. It provides us with a value that characterizes the probability that different power spectral outputs of length N occur, where, pi is the probability of being in state i. Spectral disorder is a function of the irregularity of amplitude and frequency of the peaks in power spectra.
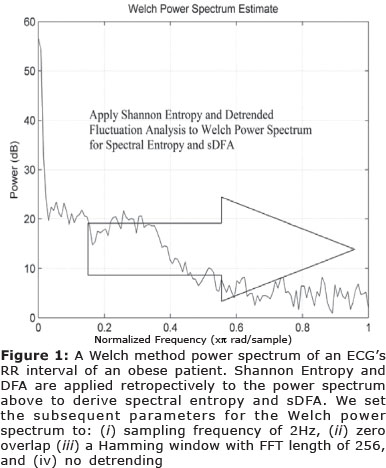
We calculate the power spectrum by Welch's method24 (See Figure 1); setting the Welch's method parameters at: (i) sampling frequency of 2Hz, (ii) zero overlap (iii) a Hamming window with FFT length of 256, and (iv) no detrending. This output is then manipulated so that the sum of the magnitude is equal to unity; giving a normalized power spectrum. From here we evaluate Shannon entropy of the frequencies from normalized power spectra. Therefore, the x-axis is frequency and the y-axis is amplitude in the two-dimensional sense.
We then calculate an intermediate parameter which is the median Shannon entropy of the three different power spectra using the Welch power spectra under three test conditions: (i) a perfect sine wave (ii) uniformly distributed random variables, and finally (iii) the experimental oscillating signal.
These values are then normalized mathematically so that the sine wave gives a value of zero, uniformly distributed random variables give unity, and the experimental signal between zero and unity. It is this final value that corresponds to spectral entropy.
Spectral Detrended Fluctuation Analysis
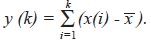
DFA6,30 can be applied to datasets where statistics such as mean, variance and autocorrelation vary with time. The difference with the sDFA12 algorithm is that the DFA is applied to the frequency rather than time on the horizontal axis (See Figure 1). Regarding DFA according to Donaldson31 the time-series of length k was integrated as follows.
The integrated time-series was then divided into equally sized and non overlapping windows
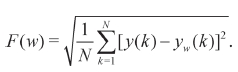
of length w. A linear regression line was fitted through the data in each window and the time-series locally detrended by subtracting the regression line from the data. The root mean square fluctuation F(w) of the integrated and detrended time-series was then used to calculate values of w.
The scaling exponent obtained as the slope of the straight line fit to F(w) against w on a log-log plot as:

To obtain sDFA we calculate the spectral adaptation in exactly the same way as for spectral entropy using a Welch power spectrum with the same settings; but DFA rather than Shannon entropy is the algorithm applied. Applying DFA in this way reduces errors which could be introduced by a fluctuating scaling exponent during the time-series of the dataset.
Spectral Multi-Taper Method
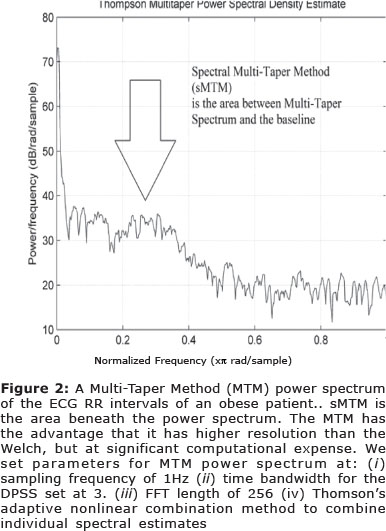
sMTM12 is founded on the increased intensity of broadband noise in power spectra generated by irregular and chaotic signals. Multi-Taper Method, (MTM)25,32 provides estimates of both line components and the continuous background of the spectrum. MTM exploits the property that these adaptive orthogonally shaped windowed power spectra are extremely accurate. These optimal tapers belong to a family of spectral functions termed Discrete Prolate Spheroidal Sequences (DPSS)33. MTM spectral estimation reduces spectral leakage and other inaccuracies compared to the single windowed non-adaptive techniques.
We set the parameters for MTM at: (i) sampling frequency of 1Hz (ii) time bandwidth for the DPSS is set to 3 (iii) FFT length of 256 (iv) Thomson's adaptive nonlinear combination method to combine individual spectral estimates. sMTM is the area between the MTM power spectrum and the baseline (See Figure 2).
Statistical Analysis
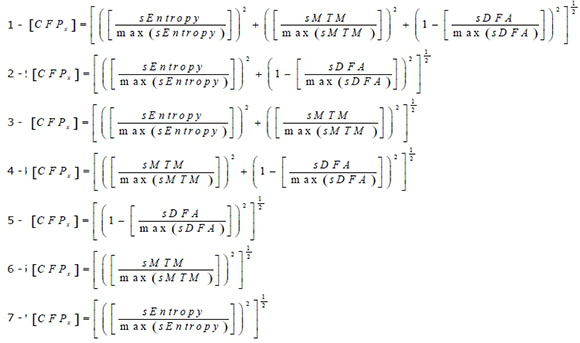
The parameter [CFPx] is referred to as Chaotic Forward Parameter where the x corresponds to obese and normal datasets. There are seven different combinations of three chaotic global parameters. Since sDFA responds to chaos in the opposite way to the others we subtract its value from unity when applying here. All three chaotic global values have equal weighting.
RESULTS
Mean Variation & Significances
Parametric statistics generally assume the data are normaily distributed, hence the use of the mean as a measure of central tendancy. If we cannot normalize the data we should not compare means. To test our assumptions of normality we apply the Anderson-Darling34 and Ryan-Joiner35 tests of normality.
The Anderson - Darling test for normality applies an empirical cumulative distribution function, whereas the Ryan-Joiner test is a correlation based test. In the majority of cases the p < 0.01; with only a few at the level p > 0.1 for both tests and so we cannot say that the observations follow a normal distribution. Therefore we have a probability plot of mainly non-normal data and so we must apply the Kruskal-Wallis36 test of significance (non-parametric) as the ANOVA37 (parametric) is unreliable for strong departures from normality.
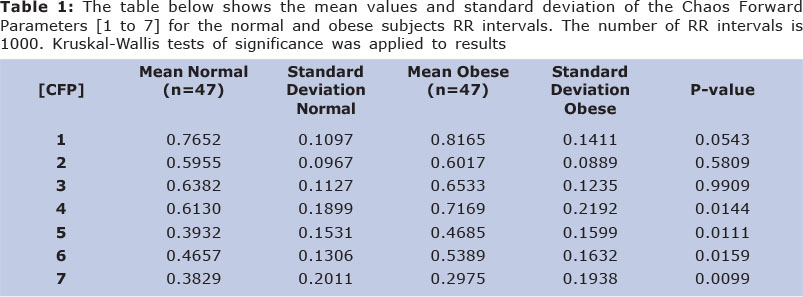
The results illustrate that there is a wide variation in both the mean values for both obese and non-obese (See Table 1). The test of significance applied is the Kruskal-Wallis test. The algorithm computes a significant statistical result for five of the seven combinations (p < 0.05). These are all combinations except 2 and 3. So increased statistical significance is achieved by [CFP]; in five combinations. Whilst, Algorithm 7 is grouped as statistically significant it is different in the sense that the [CFP] falls in magnitude.
Principal Component Analysis
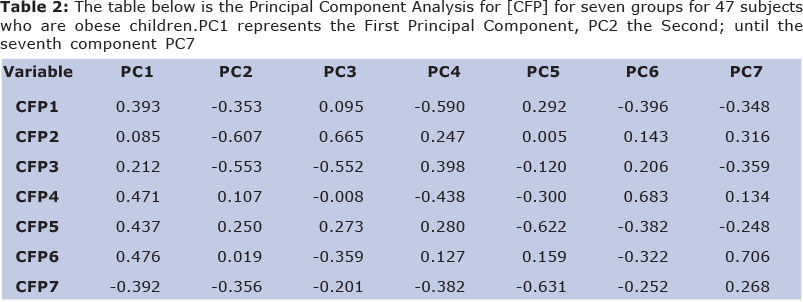
Principal Component Analysis (PCA)38 can be applied here (See Table 2). We have the values of [CFP] for seven groups for 47 subjects who are obese; hence a grid of 7 by 47 to be assessed. The First Principal Component has a variance (eigenvalue) of 4.3786 and accounts for 62.6% of the total variance.
The Second Principal Component has an eigenvalue of 2.5796 accounting for 99.4% of total variance. Therefore we can assume that most variance is acheived in the first two components. Only [CFPx 2 & 3] are not significantly different when tested by Kruskal-Wallis test (p < 0.05).
[CFPx1] has the First Principal Component (0.393) and the Second Principal Component (-0.353); whereas, [CFPx4] has the First Principal Component (0.471) and the Second Principal Component (0.107). [CFPx5] has the First Principal Component (0.437) and the Second Principal Component (0.250); [CFPx6] has the First Principal Component (0.476) and the Second Principal Component (0.019). [CFPx7] has the First Principal Component (-0.392) and the Second Principal Component (-0.356).
[CFPx7] performs best on the PCA analysis alone, however it has the higher standard deviations when compared to [CFPx1]; this must be taken into account. [CFPx4, 5 & 6] have very influential first components but lack magitude on the second component. Only the first two components need be considered due to the steep scree plot.
So, [CFPx1] which applies all three chaotic globals techniques is the best overall combination with regards to influencing the correct outcome. It is the most robust statistically when compared by p-value, PCA and standard deviations.
DISCUSSION
We have derived five functions which can take short-times series of HRV and deduce which time-series is from an obese patient and which from the normal subjects. There is a high level of significance for all five algorithms (p < 0.05). Since we are applying this novel function to the shorter time-series it should be possible to determine which time-series are obese, and which normal - more rapidly with regards to time and data duration.
The mathematical analysis is undertaken such that it is not only appropriate for online analysis but also retrospectively in the laboratory and clinical setting. Here, the analysis is done retrospectively - [CFP] is calculated for normal and obese subjects.
The first algorithm which applies all three chaotic global parameters is suggested as the most robust algorithm. Referring to Garner and Ling12; which applies the models - Duffing, Brusselator and Lorenz for the purposes of optimization. Here, [CTF] a variant of [CFPx] is the most dependable objective function when tested by PCA.
In the current study, 99.4 % of influence is achieved by the first two Principal Components and the ones which have tested for significance by statistical techniques respond sympathetically. The [CFP] with all three chaotic globals applied testing as most influencial algorithm. [CFPx7] is excluded on the basis of high standard deviation for both sets of data. Increased statistical significance is achieved by [CFP x 4, 5 & 6]. However these combinations are less appropriate when assessed by PCA.
The Autonomic Nervous System (ANS) has an important role in regulation of physiological mechanisms; such as cardiac and metabolic systems. Reduction in sympathetic and parasympathetic activity can lead to obesity39. The common mechanisms of physiologically causing paediatric obesity are: insulin resistance, dyslipidaemia, hypertension, metabolic syndrome, diabetes and cardiac hypertrophy40. The pattern of ANS dysfunction39 raises the likelihood that obesity may damage the peripheral autonomic nerves resembling non-obese diabetic children.
Further difficulty that childhood obesity41-43 can then be associated with are: pulmonary disorders such as sleep apnea and reactive airway disease, blood coagulation abnormalities, endocrine and cardiovascular disorders, arteriosclerosis and cardiac arrhythmias.
The assessment of the autonomic function is most commonly undertaken by HRV since it is reliable and cheap. Nevertheless there are two other methods namely Sympathetic Skin Response (SSR) and Quantiative Pupillography39. SSR is not so effective in children and lacks sensitivity, Quantiative Pupillography is more accurate but expensive.
Further physiological and clinical study could be centred around physical activity and duration of obesity on the ANS dysfunction on obese children. Additional non-invasive study could involve modification of the Welch power spectra for the sDFA and spectral entropy. The sampling frequency; and extent of overlap and detrending could be adjusted. A higher spectral resolution technique such as the MTM may prove beneficial. The DPSS of the MTM could be adjusted to optimize the final level of significance by its p-value. In addition the weighting of the three chaotic global parameters could be adjusted since here they have only equal weightings of unity. Also, correlation between PCA for[CFP]; and time and frequency indices could be performed.
It is noted that [CFP] responds in the opposite manner to DFA in Vanderlei 44.This is to be expected. Five results are significant and all but one, of the values represent an increase in [CFP]. This would suggest that the HRV has become more chaotic. This is contrary to current theories in complexities in physiology and diseased states. A suggestion is that children respond differently to adults when obese with regards to autonomic function and HRV.
CONCLUSION
Standard data collection technques applied to either DFA or Shannon entropy would be too time consuming. Here using the five significant [CFP] the analysis is more efficient and faster.It is the correlation with HRV that make this technique worthwhile as an indicator of percieved risk from such dynamical diseases. It is recognised that this increase in [CFP] is unusual as until now diseased states are represented by decreases in disorder, especially of the RR interval.
Conflict of Interests
The authors declare that there is no conflict of interests regarding the publication of this article
Acknowledgements
Funded by the Foundation of Support to Research of Sao Paulo State - FAPESP grant 2008/05414-0.
REFERENCES
1. Seely AJ and Macklem P (2012). Fractal variability: an emergent property of complexdissipative systems. Chaos 22 (1):013108 [ Links ]
2. Goldberger AL, Rigney DR, and West BJ (1990). Chaos and fractals in human physiology. Sci Am 262 (2):42-49 [ Links ]
3. Amaral LA, Diaz-Guilera A, Moreira AA, Goldberger AL, and Lipsitz LA (2004). Emergence of complex dynamics in a simple model of signaling networks. Proc Natl Acad Sci U S A 101 (44):15551-15555 [ Links ]
4. Costa M, Goldberger AL, and Peng CK (2005). Multiscale entropy analysis of biological signals. Phys Rev E Stat Nonlin Soft Matter Phys 71 (2 Pt 1): 021906 [ Links ]
5. Elbert T, Rockstroh B, Kowalik ZJ, Hoke M, Molnar M, Skinner JE, and Birbaumer N (1995). Chaotic brain activity. Electroencephalogr Clin Neurophysiol Suppl 44:441-9.:441-449 [ Links ]
6. Peng CK, Havlin S, Hausdorff JM, Mietus JE, Stanley HE, and Goldberger AL (1995). Fractal mechanisms and heart rate dynamics. Long-range correlations and their breakdown with disease. J Electrocardiol 28 Suppl:59-65 [ Links ]
7. Skinner JE, Molnar M, Vybiral T, and Mitra M (1992). Application of chaos theory to biology and medicine. Integr Physiol Behav Sci 27 (1):39-53 [ Links ]
8. Seitsonen ER, Korhonen IK, van Gils MJ, Huiku M, Lotjonen JM, Korttila KT, and Yli-Hankala AM (2005). EEG spectral entropy, heart rate, photoplethysmography and motor responses to skin incision during sevoflurane anaesthesia. Acta Anaesthesiol Scand 49 (3): 284-292 [ Links ]
9. Choi SR, Lim YH, Lee SC, Lee JH, and Chung CJ (2010). Spectral entropy monitoring allowed lower sevoflurane concentration and faster recovery in children. Acta Anaesthesiol Scand 54 (7):859-862 [ Links ]
10. Vakkuri A, Yli-Hankala A, Talja P, Mustola S, Tolvanen-Laakso H, Sampson T, and Viertio-Oja H (2004). Time-frequency balanced spectral entropy as a measure of anesthetic drug effect in central nervous system during sevoflurane, propofol, and thiopental anesthesia. Acta Anaesthesiol Scand 48 (2):145-153 [ Links ]
11. Johnson RW and Shore JE (1984). Which is the better entropy expression for speech processing: -S logS or log S? IEEE Trans Acoust [ Links ]
12. Garner DM and Ling BWK. Measuring and locating zones of chaos and irregularities. Journal of System Science and Complexity (in press) [ Links ]
13. Kawaguchi M, Takamatsu I, and Kazama T (2009). Rocuronium dose-dependently suppresses the spectral entropy response to tracheal intubation during propofol anaesthesia. Br J Anaesth 102 (5):667-672 [ Links ]
14. Alvarez D, Hornero R, Marcos J, Del Campo F, and Lopez M (2009). Spectral analysis of electroencephalogram and oximetric signals in obstructive sleep apnea diagnosis. Conf Proc IEEE Eng Med Biol Soc 2009:400-403 [ Links ]
15. Banzett RB, Pedersen SH, Schwartzstein RM, and Lansing RW (2008). The affective dimension of laboratory dyspnea: air hunger is more unpleasant than work/effort. Am J Respir Crit Care Med 177 (12):1384-1390 [ Links ]
16. Shumway NM, Wilson RL, Howard RS, Parker JM, and Eliasson AH (2008). Presence and treatment of air hunger in severely ill patients. Respir Med 102 (1):27-31 [ Links ]
17. Daniels SR (2009). Sleep and obesity. J Pediatr 154 (6):A3 [ Links ]
18. Daniels SR (2009). Complications of obesity in children and adolescents. Int J Obes (Lond) 33 Suppl 1:S60-S65 [ Links ]
19. Lee YS (2009). Consequences of childhood obesity. Ann Acad Med Singapore 38 (1): 75-77 [ Links ]
20. Ho TF (2009). Cardiovascular risks associated with obesity in children and adolescents. Ann Acad Med Singapore 38 (1):48-49 [ Links ]
21. Kaufman CL, Kaiser DR, Steinberger J, Kelly AS, and Dengel DR (2007). Relationships of cardiac autonomic function with metabolic abnormalities in childhood obesity. Obesity (Silver Spring) 15 (5):1164-1171 [ Links ]
22. Tonhajzerova I, Javorka M, Trunkvalterova Z, Chroma O, Javorkova J, Lazarova Z, Ciljakova M, and Javorka K (2008). Cardio-respiratory interaction and autonomic dysfunction in obesity. J Physiol Pharmacol 59 Suppl 6: 709-718 [ Links ]
23. Mackey MC and Milton JG (1987). Dynamical diseases. Annals of the New York Academy of Sciences 504 (1):16-32 [ Links ]
24. Alkan A and Kiymik MK (2006). Comparison of AR and Welch methods in epileptic seizure detection. J Med Sys 6 (30):413-419 [ Links ]
25. Percival DB and Walden AT (1993). Spectral Analysis for Physical Applications: Multitaper and Conventional Univariate Techniques. Cambridge University Press, [ Links ]
26. Stilp CE, Kiefte M, Alexander JM, and Kluender KR (2010). Cochlea-scaled spectral entropy predicts rate-invariant intelligibility of temporally distorted sentences. J Acoust Soc Am 128 (4): 2112-2126 [ Links ]
27. Hocker J, Raitschew B, Meybohm P, Broch O, Stapelfeldt C, Gruenewald M, Cavus E, Steinfath M, and Bein B (2010). Differences between bispectral index and spectral entropy during xenon anaesthesia: a comparison with propofol anaesthesia. Anaesthesia 65 (6):595-600 [ Links ]
28. Shannon CE (1948). A Mathematical Theory of Communication. The Bell System Technical Journal 27:379-423 [ Links ]
29. Zyczkowski K (2003). Renyi extrapolation of Shannon entropy. Open Systems & Information Dynamics 3 (10):297-310 [ Links ]
30. Peng CK, Havlin S, Stanley HE, and Goldberger AL (1995). Quantification of scaling exponents and crossover phenomena in nonstationary heartbeat time series. Chaos 5 (1):82-87 [ Links ]
31. Donaldson GC, Seemungal TA, Hurst JR, and Wedzicha JA (2012). Detrended fluctuation analysis of peak expiratory flow and exacerbation frequency in COPD. Eur Respir J 40 (5):1123-1129 [ Links ]
32. Ghil M (1997). The SSA-MTM Toolkit: Applications to analysis and prediction of time series. Applications of Soft Computing 3165: 216-230 [ Links ]
33. Slepian S (1978). Prolate spheroidal wave functions, Fourier analysis and uncertainty, V, The discrete case. Bell Syst Tech J 57: 1371-1430 [ Links ]
34. Anderson TW and Darling DA (1954). A test of goodness of fit. Journal of the American Statistical Association 49 (268):765-769 [ Links ]
35. Ryan TA and Joiner BL (1976). Normal probability plots and tests for normality. Minitab Statistical Software: Technical Reports. The Pennsylvania State University, State College, PA. Available from MINITAB. Inc, [ Links ]
36. Kruskal WH and Wallis WA (1952). Use of ranks in one-criterion variance analysis. Journal of theAmerican Statistical Association 260 (47): 583-621 [ Links ]
37. Hsu JC (1996). Multiple Comparisons: Theory and Methods. CRC Press, [ Links ]
38. Jolliffe IT (2002). Principal Component Analysis, Series: Springer Series in Statistics.Vol. Second Edition. Springer, New York [ Links ]
39. Baum P, Petroff D, Classen J, Kiess W, and Bluher S (2013). Dysfunction of autonomic nervous system in childhood obesity: a cross-sectional study. PloS one 8 (1):e54546 [ Links ]
40. Altuncu ME, Baspinar O, and Keskin M (2012). The use of short-term analysis of heart rate variability to assess autonomic function in obese children and its relationship with metabolic syndrome. Cardiology journal 19 (5): 501-506 [ Links ]
41. Nascimento VG, da Silva JnPC, Machado TC, Bertoli CJ, Valenti VE, and Leone C (2013). Preschool children and excess weight: the impact of a low complexity intervention in public day care centers. Journal of Human Growth and Development 23 (3):290-295 [ Links ]
42. Nascimento VG, Salvador EPr, da Silva JnPC, Bertoli CJ, de Toledo Blake M, and Leone C (2012). Overweight in preschool children: analysis of a possible intervention. Journal of Human Growth and Development 22 (1): 11-16 [ Links ]
43. de Souza NM, Rossi RC, Vanderlei FM, Vitor ALR, Bernardo AFB, Goncalves ACCR, Ferreira LL, and Vanderlei LCM (2012). Heart rate variability in obese children. Journal of Human Growth and Development 22 (3) [ Links ]
44. Vanderlei LC, Pastre CM, Junior IF, and de Godoy MF (2010). Fractal correlation of heart rate variability in obese children. Auton Neurosci 155 (1-2):125-129 [ Links ]
Manuscript submitted Jan 06 2014
Accepted for publication Jan 16 2014
Corresponding author: dgarner@brookes.ac.uk
