


Serviços Personalizados
Journal

artigo
 Inglês (pdf)
 Artigo em XML
 Referências do artigo
Indicadores
Compartilhar

 Permalink
Journal of Human Growth and Development
versão impressa ISSN 0104-1282
Rev. bras. crescimento desenvolv. hum. vol.24 no.3 São Paulo 2014
ORIGINAL RESEARCH
Risk appraisal by novel chaotic globals to HRV in subjects with malnutrition
Gláucia Siqueira BarretoI; Franciele Marques VanderleiII; Luiz Carlos M. VanderleiII; David M. GarnerIII
IFaculdade de Tecnologia Intensiva. FATECI - Fortaleza, Ceará, Brazil
IIDepartment of Physiotherapy, UNESP - Univ Estadual Paulista - Presidente Prudente, São Paulo, Brazil
IIICardiorespiratory Research Group, Department of Biological and Medical Sciences, Faculty of Health and Life Sciences, Oxford Brookes University, Gipsy Lane, Oxford OX3 0BP, United Kingdom
ABSTRACT
The aim of this study is to assess the risk of dynamical diseases in malnourished children. This is achieved by the application of novel chaotic global techniques to the RR-intervals of the electrocardiogram (ECG) in the cohort. Heart Rate Variability (HRV) is an inexpensive and non-invasive tool to measure the autonomic impulses. Here there has been a decrease in chaotic response of HRV. Seventy children were divided into equal groups and the HRV monitored for 20-25 minutes. The Chaos Forward Parameter (CFP) which applies all three chaotic global parameters is suggested to be the most robust algorithm. These three parameters are high spectral entropy (hsEntropy), high spectral detrended fluctuation analysis (hsDFA) and spectral multi-taper method (sMTM). hsEntropy is a function of the irregularity of amplitude and frequency of the power spectrums peaks. It is derived by applying Shannon entropy to the multi-taper method power spectrum. To derive hsDFA we calculate the spectral adaptation in exactly the same way as for hsEntropy using an adaptive multi-taper method power spectrum with the same settings; but DFA rather than Shannon entropy is the algorithm applied. sMTM is the area between the multi-taper method power spectrum and the baseline. After Anderson-Darling and Lilliefors tests of normality; Kruskal-Wallis was used for the statistical analysis, with the level of significance set at (p < 0.01). Principal Component Analysis (PCA) identified two components representing 100% of total variance. Autonomic imbalance measured as HRV and an increased cardiovascular risk are described for overweight children as well as for malnourished and those with anorexia nervosa. The relationship between malnourishment and complexity measures is useful in the risk assessment of dynamical diseases associated with the condition. This is supportive in treatments, assisting the determination of the level of dietary or pharmacological intervention especially in related dynamical diseases.
Keywords: malnutrition, non-linear dynamics, heart rate variability, multi-taper method.
RESUMO
O objetivo deste estudo é avaliar o risco de doenças dinâmicas em crianças desnutridas. Isto é feito por meio da aplicação de novas técnicas caóticas globais para os intervalos R-R do ECG. A variabilidade da frequência cardíaca (VFC) é uma ferramenta de baixo custo e não-invasiva que mensura os impulsos autonômicos. Na desnutrição ocorreu uma diminuição na resposta caótica da VFC. Setenta crianças foram divididas em grupos iguais e a VFC foi monitorada por 20 a 25 minutos. O parâmetro caótico avançado (CFP), que utiliza os três parâmetros caóticos globais é o algoritmo mais robusto. Estes três parâmetros são: alta entropia espectral (hsEntropia), análise da alta flutuação depurada espectral (hsDFA) e método espectral multi-taper (sMTM). hsEntropia é uma função da irregularidade da amplitude e frequência dos picos dos espectros de potência. É obtida pela aplicação da entropia de Shannon ao método multi-taper do espectro de potência. Para derivar hsDFA calculamos a adaptação espectral exatamente da mesma forma que para o hsEntropia utilizando um método adaptativo multi-taper do espectro de potência com as mesmas configurações; mas, em vez da entropia de Shannon, o DFA é o algoritmo aplicado. sMTM é a área entre o método multi-taper do espectro de potência e a linha de base. Foi utilizado o teste de normalidade de Anderson-Darling e Lilliefors. Para análise estatística foi utilizado o teste de Kruskal-Wallis com nível de significância de p<0.01. A análise de Componentes Principais (PCA) identificou dois componentes que representam 100% da variância total. Desequilíbrio autonômico mensurado pela VFC e um aumento do risco cardiovascular são descritos em crianças com excesso de peso, bem como para desnutridos e indivíduos com anorexia nervosa. A relação entre a desnutrição e as medidas de complexidade é útil na avaliação do risco de doenças dinâmicas associadas com a condição. Isto fornece suporte no tratamento, auxiliando na determinação do nível de intervenção dietética ou farmacológica especialmente em relação às doenças dinâmicas.
Palavras-chave: desnutrição; dinâmica não linear; método multi-taper; variabilidade da frequência cardíaca.
INTRODUCTION
Heart rate variability (HRV) can oscillate in a chaotic and complex way1-4. In the past, methods derived from statistical physics and thermodynamics have allowed researchers to study such systems5. HRV is a cheap and non-invasive method of monitoring the sympathetic and parasympathetic balance. Recently, study of HRV in this way has become important; and often termed 'dynamical disease study'6. High HRV is a signal of good adaptation and characterize a healthy person with efficient autonomic mechanisms. Whilst lower HRV is frequently an indicator of abnormal and insufficient adaptation of the autonomic nervous system (ANS); causing the subject low physiological function. This decrease is consistent with a dysfunctional vagus.
Typically spectral entropy7 and techniques termed spectral detrended fluctuation analysis (sDFA) and spectral multi-taper method (sMTM) are based on 'chaotic globals'8. Spectral entropy applies the standard Shannon entropy9,10 algorithm to a Welch power spectrum11. Whereas, sDFA applies the DFA algorithm in the same manner to the same power spectrum. This attempts to overcome the disadvantage of sparse data vulnerability - only phase information is lost. sMTM applies the responsive and adaptive multi-taper method (MTM)12,13 to the data. sMTM is the value of the area between the MTM spectrum and the baseline. There has been speculation14,15 that if spectral entropy and sDFA previously applied to Welch power spectra were applied to multi-taper spectra which are adaptive and more sensitive; results may have greater chaotic parametric response.
These computations are useful clinically in patients under anaesthesia16,17; or unable to communicate distress as in sleep apnea 18 or dyspnea 19-21 and the potential risk associated with diabetes mellitus 14 and obesity15 has been studied previously using these methods. This study aimed to assess the risk of dynamical disease by novel chaotic globals to HRV in subjects with malnutrition. Autonomic imbalance measured as HRV and an increased cardiovascular risk are described for overweight children as well as for malnourished and those with anorexia nervosa22. Whether those with mild to moderate malnutrition compromise the ANS and therefore HRV is less certain23.
METHODS
Population and Sample
A total of 70 volunteers of both sexes between three and five years of age were divided into two equal groups: malnourished (23 girls; 3.71 ± 0.75 years; 13.02 ± 1.71Kg; 91.53 ± 5.47cm; Z-score = -2.80 ± 0.59) or eutrophic (20 girls; 4.09 ± 0.85 years; 17.89 ± 3.04Kg; 106.83 ± 8.15 cm; Z-score = 0.191 ± 1.28). The malnourished group consisted of children less than -2 in Z score in relative the height for the age, according with the criteria for age and sex by the World Health Organization (WHO)24. The eutrophic group consisted of children with Z scores greater than or equal to -2 and less than +3, also according to WHO criteria. Excluded from the study were obese children (Z-score greater than +3) or who had at least one of the following features: children who were taking medications that would influence autonomic activity of the heart, such as propranolol and atropine. In addition to children who presented infections, metabolic diseases or known cardiorespiratory system diseases, which could affect the cardiac autonomic control.
The volunteers and parents/guardians were duly informed as to the procedures and objectives of the study and, after agreeing to participate, the parents/guardians signed terms of informed consent. All procedures received approval from the ethics committee of the Institution (Process nº 275.310).
Experimental Protocol
Prior to beginning the experimental procedure, information was recorded on age, gender, weight and height. The anthropometric measurements were undertaken following the recommendations of Lohman et al.25 Weight was determined using a digital scale (Filizzola PL 150, Filizzola Ltda., Brazil) with a precision of 0.1 kg, with the children barefoot and wearing light-weight clothing. Height was determined using a stadiometer with a precision of 0.1 cm. The data collection was performed in a room with the temperature between 21° C and 23° C and relative humidity between 40 and 60%. Data were collected between 14:00 and 17:00 to minimize the interference of circadian rhythm. After the initial evaluation, all procedures necessary for the data collection were explained on an individual basis and the children were instructed to remain at rest and avoid talking during the collection.
The heart monitor belt was then placed over the thorax, aligned with the distal third of the sternum and the Polar S810i heart rate receiver (Polar Electro, Finland) was placed on the wrist. The equipment was previously validated for monitoring beat-by-beat heart rate and the use of these data for HRV analysis in children and adults26. The children were placed in the dorsal decubitus position on a cushion and remained at rest with spontaneous breathing for 20 minutes. After the collection, the child was discharged. The HRV behavior pattern was recorded beat-by-beat throughout the monitoring process at a sampling rate of 1000 Hz. Following digital filtering complemented with manual filtering for the elimination of premature ectopic beats and artifacts, 1000 consecutive R-R intervals were used for the data analysis. Only series with more than 95% sinus rhythm were included in the study27.
CHAOTIC GLOBAL PARAMETERS
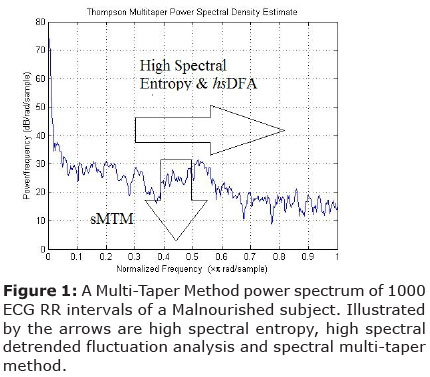
Multi-Taper Method: Power Spectrum
As mentioned in the introduction there is criticism in previous studies on diabetes and obesity with respect to chaotic global parameters in that the spectral entropy and sDFA analysis may be more sensitive if we applied the Shannon entropy and DFA algorithms to the multi-taper spectrum rather than the Welch power spectrum. Thus the spectra applied in all three chaotic global parameters would be the same.
MTM provides a useful tool for spectral estimation and signal reconstruction, of a time series of a spectrum that may contain broadband and line components. MTM is non-parametric since it does not apply an a priori, parameter dependent model of the process that generated the time series under analysis. In this sense it is similar to the Maximum Entropy Measure28,29. MTM reduces the variances of spectral estimates by using a small set of tapers. Data is pre-multiplied by orthogonal tapers created to minimize the spectral leakage owing to the finite length of the time series. A set of independent approximations of the power spectrum is calculated. Functions known as Discrete Prolate Spheroidal Sequences (DPSS) are a set of functions which optimize the tapers. They are defined as eigenvectors of a Rayleigh-Ritz minimization problem.
MTM has the following features (1) Efficient in detecting periodic components; (2) A random signal may generate many false peaks which may or may not be significant; (3) There are two ways of testing the spectrum (red-noise30 and harmonic tests).
Chaotic Globals
High spectral entropy (hs Entropy) is a function of the irregularity of amplitude and frequency of the power spectrums peaks. It is derived by applying Shannon entropy9,10 to the MTM power spectrum. The parameters for MTM are: (1) sampling frequency of 1Hz; (2) time bandwidth for the DPSS is 3; (3) FFT length of 256; (4) Thomson's adaptive nonlinear combination method to combine individual spectral estimates.
This output is then normalized so that the sum of the magnitude is equal to unity; giving a normalized power spectrum. We then calculate an intermediate parameter which is the median Shannon entropy of the value obtained from three different power spectra using the MTM power spectra under three test conditions: a perfect sine wave, uniformly distributed random variables, and finally the experimental oscillating signal.
These values are then again normalized mathematically so that the sine wave gives a value of zero, uniformly random variables give unity, and the experimental signal between zero and unity. It is this final value that corresponds to high spectral entropy.
The standard DFA algorithm 31,32 can be applied to datasets where statistics such as mean, variance and autocorrelation vary with time. The difference with the high spectral detrended fluctuation analysis (hsDFA) algorithm is that the DFA is applied to the frequency rather than time on the horizontal axis. So, once more, the x-axis is frequency and the y-axis is amplitude. To obtain hsDFA we calculate the spectral adaptation in exactly the same way as for high spectral entropy using a MTM power spectrum with the same settings; but DFA rather than Shannon entropy is the algorithm applied. Spectral Multi-Taper Method (sMTM) is founded on the increased intensity of broadband noise in power spectra generated by irregular and chaotic signals. sMTM is the area between the MTM power spectrum and the baseline.
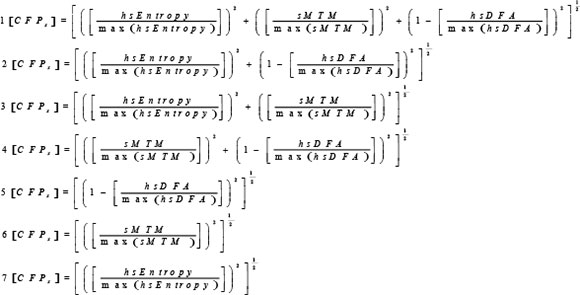
Chaotic Forward Parameter
The parameter [CFPx 1-7] is referred to as Chaotic Forward Parameter for the functions 1 to 7 below where it is applied to normal and malnourished subject datasets. Since hsDFA responds to chaos in the opposite way to the others we subtract its value from unity when applying here. All three chaotic global values have equal weightings.
RESULTS
Mean Variation & Significances
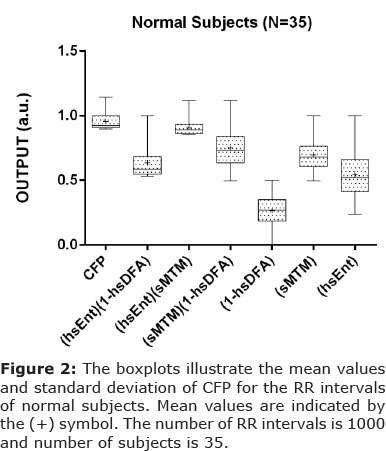
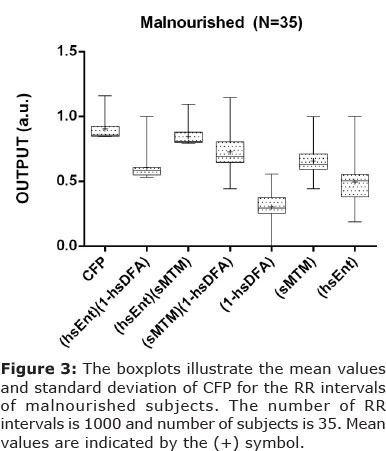
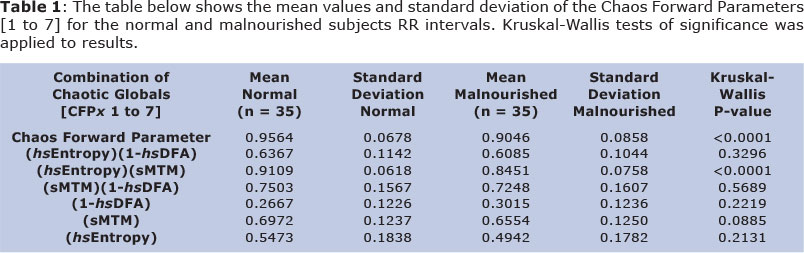
Parametric statistics generally assume the data are normally distributed, hence the use of the mean as a measure of central tendancy. If we cannot normalize the data we should not compare means. To test our assumptions of normality we apply the Anderson-Darling33 test and the Lilliefors test34. The Anderson-Darling test for normality applies an empirical cumulative distribution function. The Lilliefors test is useful in studies with small sample sizes. In the majority of cases the p<0.05; for both tests so we cannot pronounce that the observations follow a normal distribution. Therefore we have a probability plot of mainly non-normal data and so we must apply the Kruskal-Wallis35 test of significance (non-parametric) as the ANOVA136 (parametric) is unreliable for strong departures from normality. The results illustrate that there is a wide variation in both the mean values for both normal and malnourished (See Table 1). The test of significance applied is the Kruskal-Wallis test. The algorithm computes a significant statistical result for two of the seven combinations (p<0.01). These are combinations [CFPx 1 & 3]. In both cases there is a decrease in chaotic response when going from normal to malnourished subjects. Standard deviation is also reduced.
Principal Component Analysis
Principal Component Analysis (PCA) 37; a multivariate technique is applied here. We have the values of [CFP] for two groups for 35 subjects who are malnourished; hence a grid of 2 by 35 to be assessed. The First Principal Component (PC1) has a variance (eigenvalue) of 1.9 and accounts for 95% of the total variance. The Second Principal Component (PC2) has an eigenvalue of 0.1 accounting for 100% of cumulative total variance. PC2 accounting for 5% of its proportion of the variance. Therefore we can assume that most variance is acheived in the first two components. Only [CFPx 1 & 3] are significantly different when tested by Kruskal-Wallis test (p < 0.01).
[CFPx1] has the First Principal Component (0.707) and the Second Principal Component (-0.707). [CFPx3] has the First Principal Component (0.707) and the Second Principal Component (0.707). Only the first two components need be considered due to the steep scree plot. Only [CFPx 1 & 3] need to be considered due to Kruskal-Wallis statistical significance at the level p < 0.01 (Table 1).
So, both are suitable functions as deduced by the three assessments (Kruskal-Wallis, Standard Deviation and PCA). There is evidence to apply [CFPx 1] as the most robust function, as in the study which analyzes the 'inverse problem' posed by Garner and Ling8. This in addition to forward problems in obesity15, diabetes mellitus14 and chronic obstructive pulmonary disease 38,39.
DISCUSSION
The first algorithm which applies all three chaotic global parameters is suggested as the most robust algorithm. Referring to Garner and Ling 8; which uses three models - Duffing, Brusselator and Lorenz for the purposes of optimization; [CTF] a variant of [CFPx] is the most reliable objective function when tested by PCA. This is reinforced here by PCA applied to the two adaptations of [CFP] for malnourished subjects. Here 100% of influence is achieved by the first two Principal Components; with the [CFP] with all three chaotic globals applied testing as most influencial algorithm.
Future development could involve DPSS of the MTM being adjusted to optimize the final level of significance. In addition the weighting of the three chaotic global parameters could be attuned since here they have only equal weightings of unity. It would also be statistically favourable to have larger, but equal datasets for both normal and malnourished subjects.
We have developed two robust functions which can take short time-series of HRV and discriminate between the control and experimental groups. There is a very high level of significance for these algorithms (p < 0.0001). By applying either of these novel functions to the shorter time-series via spectrally determined parameters it should be possible to determine which are malnourished or normal. This achieved more rapidly and efficiently with regards to time and data length. There has been a decrease in chaotic response of HRV in malnourishment. The relationship between malnourishment and complexity measures is useful in the risk assessment of dynamical diseases associated with the condition. It identifies severity of the situation from a cheap and reliable method of monitoring the ANS. This is helpful in treatments, assisting the determination of the level of dietary or pharmacological intervention especially in related dynamical diseases. For example, autonomic neuropathy measured by HRV in Vitamin B12 deficiency appears to precede other neurological tests40. Nevertheless, proceeding cautiously, since the subject's autonomic modulation may be critical. Moreover, it is noted that there are other conditions which could cause the complexities correlation.
In conclusion, there has been a decrease in chaotic response of HRV in malnutrition children. The parameter which applies all three parameters is the most influential and statistically more significant. This method is useful in the risk assessment of dynamical diseases associated with malnourishment.
Competing interests
The authors declare that there is no conflict of interests regarding the publication of this article.
REFERENCES
1. Seely AJ, Macklem P. Fractal variability: an emergent property of complex dissipative systems. Chaos 2012;22(1):013108. DOI: 10.1063/1.3675622. [ Links ]
2. Goldberger AL, West BJ. Chaos and order in the human body. MD Comput 1992;9(1): 25-34. [ Links ]
3. Goldberger AL. Cardiac chaos. Science 1989;243(4897):1419. DOI: 10.1126/science.2928773. [ Links ]
4. Elbert T, Ray WJ, Kowalik ZJ, Skinner JE, Graf KE, Birbaumer N. Chaos and physiology: deterministic chaos in excitable cell assemblies. Physiol Rev 1994;74(1):1-47. DOI: MD5:764bd488f011be86fbf44bdeb3c29845. [ Links ]
5. Ho M-W. The rainbow and the worm: The physics of organisms. Singapore: World scientific; 2008. [ Links ]
6. Mackey MC, Milton JG. Dynamical diseases. Ann NY Acad Sci 1987;504(1):16-32. DOI: 10.1111/j.1749-6632.1987.tb48723.x [ Links ]
7. Johnson R, Shore J. Which is the better entropy expression for speech processing:-S log S or log S? IEEE Trans Acoust, Speech, Signal Processing 1984;32(1):129-37. DOI: 10.1109/TASSP.1984.1164296. [ Links ]
8. Garner DM, Ling BWK. Measuring and locating zones of chaos and irregularity. J Syst Sci Complex 2014;27(3):494-506. DOI: 10.1007/s11424-014-2197-7. [ Links ]
9. Shannon CE. A mathematical theory of communication. ACM Mob Comput Commun Rev 2001;5(1):3-55. DOI: 10.1145/584091.584093. [ Links ]
10. Zyczkowski K. Renyi extrapolation of Shannon entropy. Open Sys & Information Dyn 2003;3(10):297-310. DOI: 10.1023/A: 1025128024427. [ Links ]
11. Alkan A, Kiymik MK. Comparison of AR and Welch methods in epileptic seizure detection. J Med Syst 2006;30(6):413-9. DOI: 10.1007/s10916-005-9001-0. [ Links ]
12. Ghil M. The SSA-MTM Toolkit: Applications to analysis and prediction of time series. Appl Soft Comput 1997;3165:216-30. DOI: 10.1117/12.279594. [ Links ]
13. Percival DB, Walden AT. Spectral Analysis for Physical Applications: Multitaper and Conventional Univariate Techniques. New York: Cambridge University Press; 1993. DOI: 10.1017/CBO9780511622762. [ Links ]
14. Souza NM, Vanderlei LC, Garner DM. Risk evaluation of diabetes mellitus by relation of chaotic globals to HRV. Complexity 2014. DOI: 10.1002/cplx.21508. [ Links ]
15. Vanderlei FM, Vanderlei LC, Garner DM. Chaotic global parameters correlation with heart rate variability in obese children. J Hum Growth Dev 2014;24(1):24-30. [ Links ]
16. Kawaguchi M, Takamatsu I, Kazama T. Rocuronium dose-dependently suppresses the spectral entropy response to tracheal intubation during propofol anaesthesia. Br J Anaesth 2009;102(5):667-72. DOI: 10.1093/bja/aep040. [ Links ]
17. Morgaz J, Granados MD, Dominguez JM, Navarrete R, Fernandez A, Galan A, et al. Evaluation of spectral entropy to measure anaesthetic depth and antinociception in sevoflurane-anaesthetised Beagle dogs. Vet J 2010; 188(3):352-5. DOI: 10.1016/j.tvjl.2010.06.001. [ Links ]
18. Alvarez D, Hornero R, Marcos J, Del Campo F, Lopez M. Spectral analysis of electroencephalogram and oximetric signals in obstructive sleep apnea diagnosis. Conf Proc IEEE Eng Med Biol Soc 2009;2009:400-3. DOI: 10.1109/IEMBS.2009.5334905. [ Links ]
19. Moosavi SH, Topulos GP, Hafer A, Lansing RW, Adams L, Brown R, et al. Acute partial paralysis alters perceptions of air hunger, work and effort at constant P(CO(2)) and V(E). Respir Physiol 2000;122(1):45-60. DOI: 10.1016/S0034-5687(00)00135-3. [ Links ]
20. Banzett RB, Lansing RW, Reid MB, Adams L, Brown R. 'Air hunger' arising from increased PCO2 in mechanically ventilated quadriplegics. Respir Physiol 1989;76(1):53-67. DOI: 10.1016/0034-5687(89)90017-0. [ Links ]
21. Binks AP, Vovk A, Ferrigno M, Banzett RB. The air hunger response of four elite breath-hold divers. Respir Physiol Neurobiol 200;159(2):171-7. DOI: 10.1016/j.resp.2007.06.014. [ Links ]
22. Dippacher S, Willaschek C, Buchhorn R. Different nutritional states and autonomic imbalance in childhood. Eur J Clin Nutr 2014; 1-3. DOI: 10.1038/ejcn.2014.198. [ Links ]
23. Srivastava D, Singh K, Misra R, Prakash A. Comparison of cardiac autonomic activity between malnourished and healthy children. Indian J Physiol Pharmacol 2012; 56(3)-222-8. [ Links ]
24. World Health Organization, UNICEF. WHO child growth standards and the identification of severe acute malnutrition in infants and children: joint statement by the World Health Organization and the United Nations Children's Fund. 2009. [ Links ]
25. Lohman TG, Roche AF, Martorell R. Anthropometric standardization reference manual. 1988. [ Links ]
26. Vanderlei LC, Silva RA, Pastre CM, Azevedo FM, Godoy MF. Comparison of the Polar S810i monitor and the ECG for the analysis of heart rate variability in the time and frequency domains. Braz J Med Biol Res 2008;41(10):854-9. DOI: http://dx.doi.org/10.1590/S0100-879X2008005000039. [ Links ]
27. Godoy MF, Takakura IT, Correa PR. Relevância da análise do comportamento dinâmico não linear (Teoria do Caos) como elemento prognóstico de morbidade e mortalidade em pacientes submetidos à cirurgia de revascularização miocárdica. Arq Ciênc Saúde 2005;12(4):167-71. DOI: http://dx.doi.org/10.1590/S0102-76382009000200018. [ Links ]
28. Grassberger P. Information flow and maximum entropy measures for 1-D maps. Physica D 1985;14(3):365-73. DOI: 10.1016/0167-2789(85)90095-8. [ Links ]
29. Landau HJ. Maximum entropy and maximum likelihood in spectral estimation. IEEE Trans Inform Theory, 1998;44(3):1332-6. DOI: 10.1109/18.669428. [ Links ]
30. Mann ME, Lees JM. Robust estimation of background noise and signal detection in climatic time series. Clim Chang 1996;33(3):409-45. DOI: 10.1007/BF00142586. [ Links ]
31. Donaldson GC, Seemungal TA, Hurst JR, Wedzicha JA. Detrended fluctuation analysis of peak expiratory flow and exacerbation frequency in COPD. Eur Respir J 2012;40(5):1123-9. DOI: 10.1183/09031936.00180811. [ Links ]
32. Peng CK, Havlin S, Stanley HE, Goldberger AL. Quantification of scaling exponents and crossover phenomena in nonstationary heartbeat time series. Chaos 1995;5(1):82-7. DOI: http://dx.doi.org/10.1063/1.166141. [ Links ]
33. Anderson TW, Darling DA. A test of goodness of fit. J Am Statist Assoc 1954;49(268):765-9. DOI: 10.1080/01621459.1954.10501232. [ Links ]
34. Razali NM, Wah YB. Power comparisons of shapiro-wilk, kolmogorov-smirnov, lilliefors and anderson-darling tests. J Statist Model Analyt 2011;2(1):21-33. [ Links ]
35. Kruskal WH, Wallis WA. Use of ranks in one-criterion variance analysis. JAm Statist Assoc 1952;47(260):583-621. DOI: 10.2307/2280779. [ Links ]
36. Hsu JC. Multiple comparisons in the general linear model. Multiple Comparisons. Springer; 1996. p. 181-226. DOI: 10.2307/1390767. [ Links ]
37. Jolliffe IT. Principal Component Analysis, Series: Springer Series in Statistics. New York: Springer; 2002. DOI: 10.1007/b98835. [ Links ]
38. Bernardo AFB, Vanderlei LCM, Garner DM. HRV Analysis: A clinical and diagnostic tool in Chronic Obstructive Pulmonary Disease. International Scholarly Research Notices 2014; 673232:6. DOI: http://dx.doi.org/10.1155/2014/673232. [ Links ]
39. Roque AL, Valenti VE, Massetti T, da Silva TD, Monteiro CB, Oliveira FR, et al. Chronic obstructive pulmonary disease and heart rate variability: a literature update. Int Arch Med 2014;7(1):43. DOI: 10.1186/1755-7682-7-43. [ Links ]
40. Sucharita S, Sowmya S, Thomas T, Kurpad AV, Vaz M. Plasma Vitamin B 12, Methylmalonic Acid and Heart Rate Variability in Healthy Young Indian Adults. Int J Vitam Nutr Res 2013;83(3):147-53. DOI: 10.1024/0300-9831/a000155. [ Links ]
Manuscript submitted Dec 10 2013
Accepted for publication Oct 10 2014
Corresponding author: dgarner@brookes.ac.uk
