


Services on Demand
article
 text in
  English (pdf)
 Article in xml format
 Article references
Indicators

Share

 Permalink
Journal of Human Growth and Development
Print version ISSN 0104-1282
Rev. bras. crescimento desenvolv. hum. vol.24 no.3 São Paulo 2014
ORIGINAL RESEARCH
Waist/height ratio: a marker of nutritional alteration in preschool children"
Claudio LeoneI; Viviane Gabriela NascimentoI, II; Janaína Paula Costa da SilvaI, III; Ciro João BertoliI, IV
IProfessor Titular do Departamento de Saúde Materno-Infantil da Faculdade de Saúde Pública da Universidade de São Paulo
IINutricionista, Pós-doutora pelo Departamento de Saúde Materno-Infantil da Faculdade de Saúde Pública da Universidade de São Paulo. Docente da Universidade Paulista
IIINutricionista, Doutora do Departamento de Saúde Materno-Infantil da Faculdade de Saúde Pública da Universidade de São Paulo
IVProfessor Doutor do Departamento de Medicina da Universidade de Taubaté
ABSTRACT
INTRODUCTION: The prevalence of obesity in Brazil is progressively increasing among children. In obese individuals, the concentration of fat in the abdominal region is a predictive marker for future health problems. Among the indicators of central adiposity, the waist-to-height ratio (WHR) has been shown to be more sensitive for predicting future health hazards than waist circumference alone.
OBJECTIVE: To analyze the relationship between the WHR and the classification of nutritional status of preschool children.
METHODS: A cross-sectional study with 711 preschool children in daycare in Taubate, SP. The sampling was probabilistic, having the nursery as the sampling unit. The weight, height and waist circumference of each child were measured. For classifying children with excess weight (risk of overweight, overweight or obesity), or with overweight or obesity the cut-off points of the Z-scores of Body Mass Index (zBMI), proposed by the Ministry of Health (2009), were used, from the point of view of the World Health Organization. The data were analyzed using the ROC (Receiver Operator Curve.
RESULTS: The area under the curve (AUC) of WHR for excess weight was 0.851 (p< 0.0001), and for overweight or obesity together was 0.886 (p< 0.0001). Values of 0.52 and 0.54 of the WHR were the cut-off points for optimization of Sensitivity/Specificity respectively for excess weight or overweight or obesity.
CONCLUSION: The WHR is a useful tool in basic health care for children at the beginning of preschool age, for the assessment of nutritional status and central adiposity.
Key words: waist circumference, obesity, overweight, adiposity, preschool.
INTRODUCTION
The prevalence of obesity is increasing even among children, causing numerous health problems that are becoming public health issues, affecting societies in various parts of the world today. This trend is characterised as an epidemic with pandemic tendencies, not just in industrialised regions but also in less developed areas such as Central and South America1-3.
Brazil is going through a period of epidemiological transition with demographic and nutritional changes. A study of municipal nurseries in Brazil, with a probabilistic and random sample of 447 preschool children showed a prevalence of excess weight of 28.9%, concluding that the population of children aged two and three years of age is already showing a high prevalence of overweight1.
Obesity and even overweight are generally not difficult to recognise, but a more accurate diagnosis requires that the levels of risk are identified. This often requires some form of measurement such as imaging techniques (MRI, CT scan and absorptiometry using dual energy X-ray (DXA)), which provide greater accuracy in the evaluation of fat accumulation; however, these methods require expensive equipment and technological sophistication, which prevents their use in population studies and routine clinical diagnostics4,5.
Estimates of excess weight which detect possible health risks are often reported based on Body Mass Index (BMI), which is the most commonly used method for anthropometric assessment of nutritional status, being a simple and low-cost measurement that shows good agreement between the indicators of adiposity in the diagnosis of overweight and obesity, without the need to determine body composition6,7.
It is known that central obesity, i.e., concentration of fat in the abdominal region has a higher predictive sensitivity for diseases and health problems. Among the indicators of central obesity, waist circumference together with the waist-to-height ratio (WHR) have been shown to be more sensitive in predicting health risks than waist circumference in isolation.8-11
The measurement of waist circumference (WC) is an indicator used in measuring the centralised distribution of adipose tissue in individual and collective evaluations; however, differences in body composition at different ages and in different racial groups hinder the development of universal cutoff points. Knowing these cutoff points could be useful in detecting the risk of developing diseases in health monitoring, clinical diagnosis and population studies.12
The waist-to-height ratio (WHR) has been proposed as an additional anthropometric measurement for assessing obesity and central adiposity, as this ratio, regardless of the condition of body weight, is associated with an increased risk of cardiovascular disease (CVD). This measurement would be beneficial for the early identification of children at nutritional risk. Several studies have shown that this parameter is a better predictor of cardiovascular risk in older children and adolescents, when compared to the isolated use of BMI.13-16
In Brazil, there are currently no studies comparing WHR with the anthropometric indicators of obesity in the population of preschool children. As a consequence, it is important to study whether a relationship exists between WHR and the classification of nutritional status proposed by the Ministry of Health (MOH) and the World Health Organization (WHO) in children of preschool age.
METHODS
This was a cross-sectional study with pre-school children from two up until four years old, enrolled and attending municipal nursery schools in the city of Taubate, Sao Paulo State. The sampling was probabilistic and randomised by clusters, with the nursery as the sampling unit from a universal list of 59 nurseries provided by the Department of Education and Culture from the Municipal Government of Taubaté. In total, nine nurseries were randomly selected, which provided the necessary quantity of children for this study.
Considering a test power of 95% and an alpha of 5%, for an area under the curve (AUC) of at least 10 percentage points above the null hypothesis (area under the curve equal to 50%), it was estimated that a minimum number of 692 children were required for the sample.
The nine randomly selected nurseries resulted in a total sample of 711 children. Data collection took place between March 2011 and March 2013. All children included in the sample received signed consent from parents or guardians in order to participate in the study.
The children were submitted to anthropometric measurements of weight, height and waist circumference, performed by previously trained nutritionists and nutrition students under the supervision of the researchers.
The anthropometric measurements were performed in the nursery itself, on previously scheduled days. To obtain the weight measurement, a portable digital scale was used of the SECA® (Seca® 803) brand, with a capacity of 150kg and a precision of 100g. Children were weighed without shoes and wearing as little clothing as possible. Height was measured using a portable stadiometer of the WISO® brand, attached to the wall and graduated in centimetres and millimetres. Each child was measured without shoes or hair ornaments, in an orthostatic position, with their arms beside their body, shoulders relaxed, heels together, and their head placed in the horizontal Frankfurt plane.17
For the waist circumference, the children were placed in an upright position, wearing as little clothing as possible. The measurement was made using an inelastic tape measure at the average distance between the last floating rib and the iliac crest.
To classify the children as excess weight (risk of overweight, overweight or obese), we used the cutoff point ≥ +1 of the Z score of the Body Mass Index (zBMI), and to identify overweight or obese we used the cutoff point ≥ +2 zBMI, according to the reference values of the World Health Organization (2006)18 and the standards of the Ministry of Health (2009).19
For statistical data analysis, MedCalc version 13.0.1.0 and SPSS version 15.0 software were used. The frequencies, proportions, and averages were calculated according to their relevance. From the data for each child, we constructed an ROC curve (Receiver Operator Curve),estimating the area under the curve and statistical significance (also from the curve)for some cutoff points, sensitivity, specificity (identifying the point of optimisation between sensitivity/specificity) and positive and negative predictive values. The level of significance was set at 0.05 and confidence intervals (CI) were estimated at 95%.
This study followed CNS Resolution 196/96, and was approved by the Ethics Committee of the Faculty of Public Health, University of São Paulo, COEP Document No.361/09, and by the Ethics Committee in Research of the University of Taubaté, CEP/UNITAU No. 0002/05.
RESULTS
The average age of the 711 preschool children studied was 39.9 months, with a standard deviation (SD) of 4.0 months and CI 95% of 39.5 - 40.2 months. Of the total number of children assessed, 47.8% (n = 340) were female.
Regarding nutritional status, we found a prevalence of eutrophic children (normal weight) of 69.2% (n = 492), with a risk of overweight of 18.3% (n = 130), overweight of 8.6% (n = 61) and obese of 3.9% (n = 28).
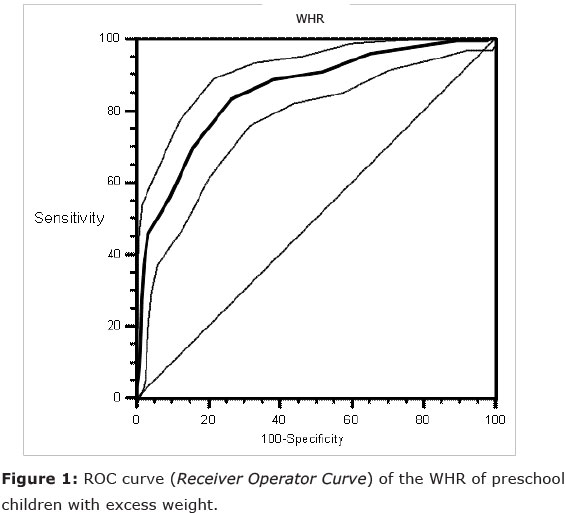
The area under the ROC curve for excess weight (≥ 1 + zBMI) was 0.851 with 95%CI of 0.823-0.877 (p < 0.0001). (Figure 1)
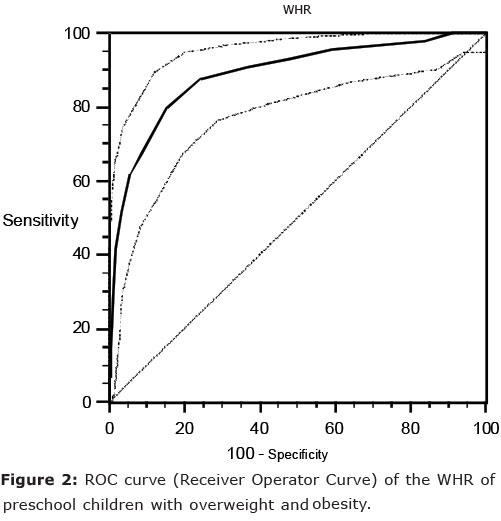
For overweight or obese (≥ + 2 zBMI), the area under the ROC curve was 0.886 with 95%CI of 0.861-0.909 (p < 0.0001). (Figure 2)
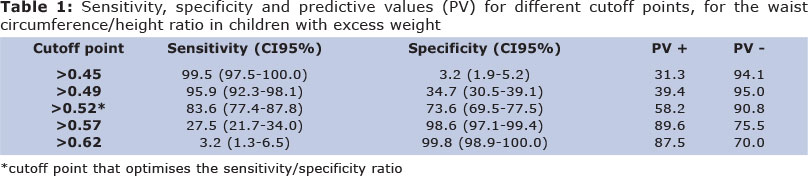
From the sensitivity and specificity values and their confidence intervals calculated from the ROC curve for children with excess weight (Table 1), we verified a cutoff point of 0.52, which presented simultaneously the highest values of sensitivity and specificity. At this cutoff point, 0.52, the estimated Relative Risk of excess weight among the preschool children was 2.3 (CI95% 2.04-2.60).
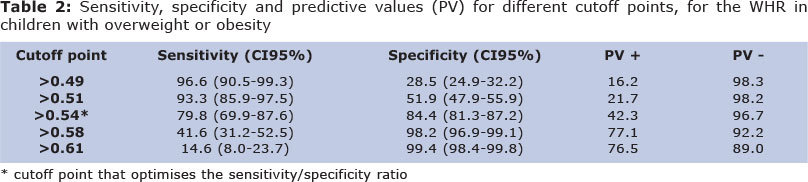
From the values of sensitivity and specificity and their confidence intervals calculated from the ROC curve for children with excess weight (Table 2), we verified a cutoff point of 0.54, which presented simultaneously the highest values of sensitivity and specificity. At this cutoff point, 0.54, the estimated Relative Risk of overweight or obese among preschool children was 3.5 (CI 95% 3.0 - 4.1).
DISCUSSION
This study demonstrated a prevalence of 30.8% of excess weight in 711 preschool children, confirming that the obesity epidemic continues to grow in increasingly younger ages. This fact is a concern in the area of health, because it is known that excess weight in childhood contributes to a higher incidence of morbidity and mortality, especially from cardiovascular causes, in early adulthood.20
Excess body fat may be associated with a set of important metabolic disorders such as dyslipidaemia, hypertension, and hyperinsulinae-mia, problems which, in adults, characterise metabolic syndrome. The association between obesity and metabolic syndrome may be even more important when adiposity presents intra-abdominally, or "centrally" as it is termed.21,22
The isolated measurement of waist circumference has been studied as a possible marker of the quantity of abdominal adipose tissue; however, to date, there are no specific standardised or widely accepted cutoff points to assess and classify abdominal adiposity in children of different age groups. As a consequence, its use as a routine tool, impacting on basic health actions in the area of public health, has been limited.23
The waist circumference to height ratio is an index that indicates the existing proportionality between the waist circumference (a possible indicator of central fat accumulation) and the height of an individual, thus minimising any erroneous assessments of the health risk in individuals who have the same waist circumference but who are different heights, and controlling any differences due to age and/or gender of the child. This index has been demonstrated to be adequately sensitive for analyzing the risk of obesity between different sexes, age groups and ethnicities.9
The analysis of sensitivity and specificity through the use of ROC curves has been recommended in epidemiological studies to determine cutoff points. This type of analysis enables the evaluation, through determining the area under the curve, of the power of discrimination and/or identification, which the marker presents in relation to a particular outcome and enables the definition of the best cutoff point to be used according to the desired objective24. These are public health care, which are conventionally considered in the diagnosis, treatment and prevention of diseases and other physical and mental impairments in humans25.
Among the preschool children evaluated at two or three years old, the area under the ROC curve (0.851 with CI95% of 0.861 -0.909,p < 0.0001) showed a high capacity for identification of excess weight (≥ + 1zBMI). Regarding the analysis of the group of preschool children with overweight or obese (≥ 2 + zBMI), the area under the ROC curve (0.886 with CI95% of 0.823 - 0.877, p < 0.0001) also proved a useful marker for identifying these nutritional alterations.
The WHR of 0.52 and 0.54 were observed, respectively, as the cutoff points that optimised the relationship between sensitivity and specificity in identifying the preschool children with excess weight or the group with overweight or obesity. The identification of preschool children with WHR of these values (or greater) assigns them relative risks of 2.3 or 3.5 respectively, to be suffering from excess weight or overweight or obese.
However, if the objective of using WHR is to screen for suspected cases of these nutritional alterations, thus favoring sensitivity, the most appropriate cutoff points of waist circumference/height ratio for excess weight as a whole or for the group of overweight or obesity, are 0.45 or 0.49 respectively.
No specific cutoff point values of WHR for preschool children were found in the review of the literature; however, the results obtained in this study indicate the need for further research to establish more precisely appropriate cutoff points for this age group.
For its ease of implementation, WHR presents itself as a useful tool for routine nutritional status assessments in children of early preschool age, being equally or even more simple to use than the determination of a zBMI score in these children. Furthermore, WHR also offers an estimate of central adiposity, which is not the case with the use of BMI alone.
Since there is no data in the literature for this age group, we suggest, as an initial proposal, the use of the cutoff point values established in this study in the routine assessment of preschool children, either in association with BMI or not, prospectively re-evaluating their validity or establishing new values of WHR that are better suited to primary care for children.
REFERENCES
1. Nascimento, VG et al. Prevalência de sobrepeso em crianças pré-escolares em creches públicas: um estudo transversal. Sao Paulo Med J 2012,130(4): 225-229. [ Links ]
2. Heseker H, Schmid A. Epidemiology of obesity. Ther Umsch 2000, 57(8):478-81. [ Links ]
3. Wyatt HR. The prevalence of obesity. Prim Care 2003, 30(2):267-79. [ Links ]
4. Stolk RP, Wink O, Zelissen PM, Meijer R, van Gils AP, Grobbee DE. Validity and reproducibility of ultrasonography for the measurement of intra-abdominal adipose tissue. Int J Obes Relat Metab Disord 2001, 25:1346-51. [ Links ]
5. Erselcan T, Candan F, Saruhan S, Ayca T. Comparison of body composition analysis methods in clinical routine. Ann Nutr Metab 2000, 44:243-8. [ Links ]
6. Sousa TF et al. Fatores associados à obesidade central em adultos de Florianópolis, Santa Catarina. Rev Bras Epidemiol 2011, 14(2): 296-309. [ Links ]
7. Giugliano R, Melo ALP. Diagnóstico de sobrepeso e obesidade em escolares: utilização do índice de massa corporal segundo padrão internacional. J Pediatr 2004; 80:129:34. [ Links ]
8. Ashwell M. Obesity risk: importance of the waist-to-height ratio. Nursing Standard 2009; 23(41): 49-54. [ Links ]
9. Ashwell M, Hsieh SD. Six reasons why the waist-to-height ratio is a rapid and effective global indicator for health risks of obesity and how its use could simplify the international public health message on obesity. Int J Food Sci Nutr 2005; 56(5): 303-7. [ Links ]
10. Pitanga FJG, Lessa I. Razão cintura-estatura como discriminador do risco coronariano de adultos. Rev Assoc Med Bras 2006; 52(3): 157-61. [ Links ]
11. Haun DR, Pitanga FJG, Lessa I. Razão cintura/estatura comparado a outros indicadores antropométricos de obesidade como preditor de risco coronariano elevado. Rev Assoc Med Bras 2009; 55(6): 705-11. [ Links ]
12. OMS. Obesidade: prevenindo e controlando a epidemia global. Relatório da consultoria da OMS. Tradução: Andréa Favano; revisão científica: Sérgio Setsuo Maeda. São Paulo: Roca; 2004. [ Links ]
13. Must A, Hollander SA, Economos CD. Childhood obesity: a growing public health concern. Expert Rev Endocrinol Metab 2006; 1: 233-54. [ Links ]
14. Savva SC, Tornaristis M, Savva ME, Kourides Y, Panagi A, Silikiotou N, et al. Waist circumference and waist-to-height ratio are better predictors of cardiovascular disease risk factors in children than body mass index. Int J Obes Relat Metab Disord 2000; 24:1453-8. [ Links ]
15. Kahn HS, Imperatore G, Cheng YJ. A population based comparison of BMI percentiles and waistto-height ratio for identifying cardiovascular risk in youth. J Pediatr 2005; 146:482-8. [ Links ]
16. McCarthy HD, Ashwell M. A study of central fatness using waist-to-height ratios in UK children and adolescents over two decades supports the simple message - 'keep your waist circumference to less than half your height'. Int J Obes Relat Metab Disord 2006; 30: 988-92. [ Links ]
17. Lohman TG, Roche AF, Matorell R. Anthropo-metric standardization reference manual. 1988. Ilinois: Human Kinetics Publishers. [ Links ]
18. World Health Organization. Measuring change in nutritional status. Geneva; WHO; 1993. 101 p. [ Links ]
19. Ministry of Health (Ministério da Saúde). Department of Basic Care, http://nutricao.saude.gov.br/sisvan.php?conteudo=curvas_cresc_oms Accessed on 01/08/2009. [ Links ]
20. Sinaiko AR, Donahue RP, Jacobs DR, Prineas RJ. Relation of weight and rate of increase in weight during childhood and adolescence to body size, blood pressure, fasting insulin, and lipids in young adults. The Minneapolis Childrens Blood Pressure Study. Circulation 1999; 99:1471-6. [ Links ]
21. Nathan BM, Moran A. Metabolic complications of obesity in childhood and adolescence: more than just diabetes. Curr Opin Endocrinol Diabetes Obes. 2008;15:21-9. [ Links ]
22. Morrison JA, Friedman LA, Harlan WR, Harlan LC, Barton BA, Schreiber GB, et al. Development of the metabolic syndrome in black and white adolescent girls: a longitudinal assessment. Pediatrics. 2005;116:1178-82. [ Links ]
23. Botton J, Heude B, Kettaneh A, Borys JM, Lommez A, Bresson JL, et al. Cardiovascular risk factor levels and their relationships with overweight and fat distribution in children: the Fleurbaix Laventie Ville Sante II study. Metabolism. 2007;56: 614-22. [ Links ]
24. Schisterman EF, Faraggi D, Reiser B, Trevisan M. Statistical inference for the area under the receiver operating characteristic curve in the presence of random measurement error. Am J Epidemiol. 2001;154: 174-9. [ Links ]
25. Atrash HK, Carpentier R. The evolving role of public health in the delivery of health care. J. Hum. Growth Dev. 2012; 22(3): 396-399 [ Links ]
Manuscript submitted Jul 05 2014
Accepted for publication Oct 28 2014
Corresponding author: leone.claudio@gmail.com
