


Serviços Personalizados
artigo
 texto em
  Inglês (pdf)
 Artigo em XML
 Referências do artigo
Indicadores

Compartilhar

 Permalink
Journal of Human Growth and Development
versão impressa ISSN 0104-1282
Rev. bras. crescimento desenvolv. hum. vol.25 no.1 São Paulo 2015
http://dx.doi.org/10.7322/JHGD.96800
ORIGINAL RESEARCH
Somatic growth of brazilian children and adolescents with Down Dyndrome
Fábia FreireI, II; Regina Alves ThonII; Leonardo Trevisan CostaIII; Edison DuarteIV; José Irineu GorlaIV
IDoutoranda em Atividade Física Adaptada - UNICAMP
IIProfa. Ma. da Universidade Paranaense. Rua Santos Dumont, 2171 - Centro. CEP: 85903-170 - Toledo, Pr - Brasil
IIIProf. Ms. do Centro Universitário de Votuporanga. Rua Pernambuco, 4196 - Centro. CEP: - 15500-006 - Votuporanga, SP - Brasil
IVProf. Dr. do Departamento de Estudos de Atividade Física Adaptada da Universidade Estadual de Campinas. Érico Veríssimo, 701 - Cidade Universitária. CEP: 13083-581 - Campinas, SP - Brasil
ABSTRACT
INTRODUCTION: growth as a significant indicator of child health has been widely studied. However, the number of studies regarding this indicator in children and adolescents with Down syndrome (DS) in Brazil is still limited
OBJECTIVE: the purpose of this study is to analyse the somatic growth of Brazilian children and adolescents with DS
METHODS: a cross-sectional descriptive study. The sample was comprised of 68 children, 37 boys and 31 girls with DS, from nine to eleven years old. The anthropometric measurements taken were : body weight, height and skinfold thickness. Children with mosaicism and severe heart disease were excluded. For statistical analysis, the value of p <0.05 was adopted
RESULTS: increases in body mass, height and body mass index (BMI) were identified, according to increasing age for both genders. Regarding height, boys had higher values than did girls. However, at age of eleven , there was a slight inversion of the data because the average stature in girls was higher. Regarding body mass, there was a significant difference for boys at nine and eleven years old
CONCLUSION: boys are taller than girls, with a slight inversion at the age of eleven years old. Further, it was verified that children with normal growth have behaviour similar to children with DS. Significant differences were observed in both genders in relation to BMI and body mass. However, there was no difference in relation to Tricipital and Subscapular skinfolds, as well as to BMI measurements
Key words: growth, Down syndrome, body height, body weight and skinfold thickness.
INTRODUCTION
Down syndrome (DS) is the most common genetic disorder, resulting from an extra chromosome in pair 21. John London Down identified the condition in 18661. The literature indicates that this disorder leads to changes in development, with the following characteristics: congenital heart disease, hearing and vision problems, atlantoaxial instability, thyroid disorders, obesity, muscular hypotonia, etc.2,3. Disturbances in visual and motor functions are also frequent among this population 2.
Physical growth is characterised by a sum of cellular, biological, biochemical and morphological phenomena, whose interaction is performed by a predetermined genetic plan, which is influenced by the environment4,5. Physical growth is considered an important study variable and major international health agencies recommend the monitoring of physical growth as a routine in the medical care of children6.
The most widely used method for growth evaluations is growth curves7. Growth curves were prepared for various ethnic groups and specific populations, among them, children and adolescents with DS8. Growth curves for American children and adolescents with SD were the first to be created, becoming one of the worldwide benchmarks for monitoring and tracking the physical growth of people with DS9.
Given that growth is one of the most important health indicators of the child, after publication of the American study, further investigations were conducted in order to develop growth curves for children and adolescents with DS in different countries, including Sweden, Japan, United Kingdom, Republic of Ireland, Sicily, the Netherlands, and Egypt, among others10. In Brazil, a study elaborated height and weight curves for children with DS from the urban area of the city of São Paulo. Considering the first growth curve of the Brazilian population with DS, however, the age used was limited to a range of 0-8 years old11.
Thus, to monitor the physical growth, in the clinical and public health areas, anthropometric measures of body weight and height have traditionally been used, which have international acceptance for detecting the social, economic and policy quality of the environment5,12. Therefore, the identification of these variables provides concrete base, along with the establishment of appropriate intervention measures if abnormalities or disorders are observed10.
Due to a lack of theoretical framework concerning the growth of Brazilian children with DS older than eight, this study aims to identify growth patterns related to height and body mass in children with DS between nine-eleven years old. Considering the importance and relevance of this topic and the lack of studies in the Brazilian context involving the population with DS, this study is important for identifying these variables and implementing appropriate intervention measures.
METHODS
A cross-sectional descriptive study, using 68 children with DS, was conducted. Of the 68 children, 31 were girls and 37 were boys, aged between nine and eleven years old. The children were from municipality specialised institutions in the state of São Paulo.
The sampling process was done using a convenience technique, because the specific characteristics of the sample were not known, as well as due to the difficulty of locating members of this specific population, as most of them were included in the regular school system. Data collection occurred in 2010 and 2011, with a total sample of 85 children and a loss of 20%. Data relating to sexual maturation were not considered, since studies show that menarche in girls with DS appears, on average, between the ages of 11.5 and 12.5 years13,14. The exclusion criteria were: (a) diagnosis of mosaicism and/or translocation, (b) severe cardiac diseases, (C) diagnosis of physical limitations and (d) not being present in one of the stages of data collection.
The Research Ethics Committee of UNICAMP (Protocol No 492/2010) approved this study. Parents or guardians signed the consent form, according to resolution 196/96 of the National Health Council. For data collection purposes, the researchers requested prior authorisation from directors of the specialised institutions.
An experienced professional, always in the presence of those responsible from the institution, performed the measurements. A digital weighing machine, Wiso W801, accurate to 100g with a measuring capacity of 180 kg was used to measure body mass (kg). To measure the height (cm2), a compact stadiometer, Wiso, accurate to 0.1cm, was used. The children were individually evaluated, barefoot, wearing minimal clothing. Just after weighing, the height was measured in a standing position, looking to the horizon, heels together, and head, trunk and buttocks against the vertical plane of the stadiometer.
Body composition was obtained using the skinfold thickness technique for the Tricipital (TR) and Subscapular (SE) folds. The compass Harpenden® (Harpenden Instruments, Marsden, UK) was used. To minimise possible errors, the measurements were performed by the same examiner and collected three times at each point of the body's right side, with the average value considered15.
Analysis
Regarding the statistical analysis, an identification spreadsheet was initially made. This spreadsheet included the data of individuals regarding body mass, height and skinfold thickness. Later, the BMI calculations were performed, as well as body fat percentages and the elaboration of growth curves according to percentile values.
Data analysis was performed using the statistical package SPSS 17.0. For normality verification, the Shapiro-Wilk test was used. After confirming the normality of the data, descriptive tests were performed (mean and standard deviation) to compare the different age groups and the ANOVA one-way test was performed, followed by the post hoc Bonferroni to identify the following variables: body weight, height, BMI, and tricipital and subscapular skinfolds. The test assessed the values between the ages of nine, ten and eleven years old. The significance level was p < 0.05.
RESULTS
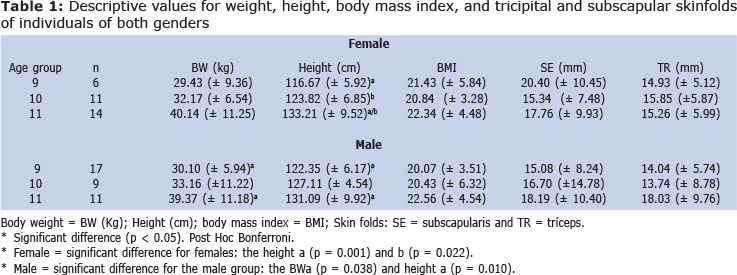
The descriptive data, represented as mean and SD, are shown in Table 1, along with the sample's characteristics, by gender and age, ranging from nine to eleven years old. There were significant differences found using the ANOVA. The differences among the female group were: body mass (kg) (F = 3.574, p = 0.041) and height (F = 9.901, p = 0.001). For the male group, the differences were: body mass (kg) (F = 3.475, p = 0.042) and height (F = 5.042, p = 0.012). In the BMI and subscapular and triceps, no differences were found (Table 1).
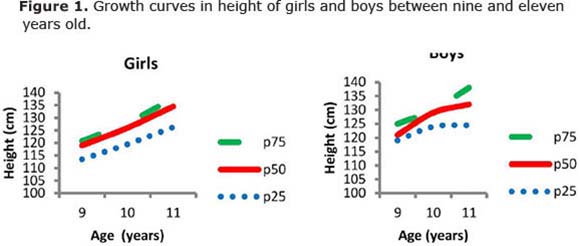
Growth curves identify the values of height relative to age, from nine to eleven in children with DS, as compared by gender (Figure 1), and represented as percentiles. There were higher mean values in nine and ten year old boys than in eleven-year-old girls.
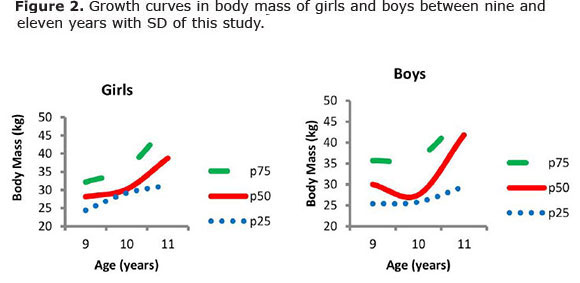
The growth curves identify the values of body mass (Kg), depending on the age of the children with DS, and are represented by percentages. The data indicate that males have slightly higher mean values between nine and ten years compared to females, and, at age of eleven, there is an inversion (Figure 2).
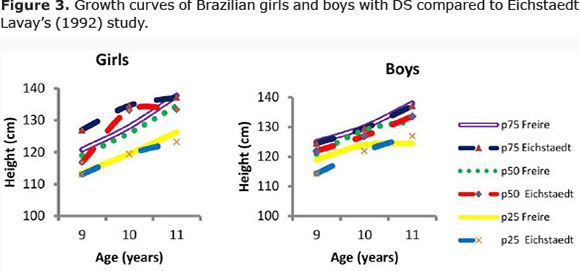
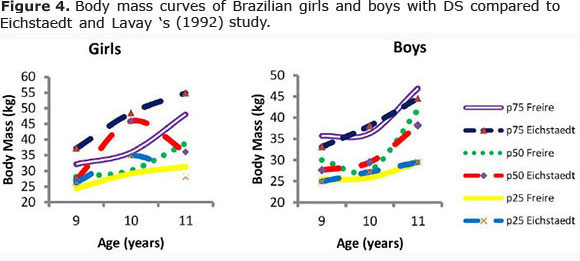
Figures 3 and 4, respectively, show the growth curves of children with DS relative to the height (cm) and body weight (kg) published in the reference study 16.
DISCUSSION
Regarding the physical growth of children with Down syndrome, it is assumed that the mean height of the subjects is reduced for both genders, at approximately -1.5 to -4 standard deviations, or lower than the fifth percentile, since the highest growth deficits occur early in life and during puberty10. Growth curves identify the height values between the ages of nine and eleven in children with DS and compared by gender (Figure 1). The highest mean value for boys was between nine and ten years old , and for girls, it was at eleven years old. This statement corroborates other studies17 with respect to individual characteristics related to the height of boys with typical development. It was identified that between the ages of nine and eleven years old, there was a progression of values. However, from twelve to 13 years old, the height and speed ceased to evolve, the same as growth x height graphs.
By comparing the height (cm) represented, in Figure 3, to the reference study data16, there is a difference in the percentile (p50) of 7 cm for ten years old females, and 2 cm for males.
Post birth, there is a reduction of growth of approximately 20% between the 3rd and 36th month of life for both genders, 5% between three and ten years for girls and 10% for boys aged between three and twelve years9. Thus, height is an individual characteristic, and may follow specific patterns on growth charts18.
In people with mild to moderate intellectual disabilities and those without disabilities, height is similar. However, children and adolescents with DS are, on average, about 12 cm shorter16. There is a consensus in the literature on the lower height of the population with DS compared to the population without DS9,19-22 due to an higher prevalence of diseases, such as coeliac disease, hypothyroidism, congenital heart disease caused by dietary nutritional problems, etc.10. However, a study of the Turkish population with SD23 showed no statistically significant differences between the groups with or without severe heart disease and or hypothyroidism.
In relation to body composition, there is, in the international literature, a higher prevalence of excess body weight and obesity in children with DS compared to people without SD24, 25. In the national literature, studies also show higher values of excess body weight and obesity in young people with SD26. Growth curves identified body mass (kg) values in children with DS that were between the ages of nine and 10 years. The data indicated that males have slightly higher mean values between nine and ten years old compared to females, and, at the age of eleven, there is an inversion (Figure 2).
Figure 4 indicates that differences in body mass (kg) at ten years old, were observed in studies of females. American girls showed higher values of, approximately, 15 kg. Regarding males, there was a difference of between 1 and 3 kg between the genders. Children with SD are, on average, 5 kg heavier, compared to the population without mild intellectual disability syndrome16.
For females, the subscapular skinfolds reached the highest mean value at age nine and, for males, at ten and eleven years old. The triceps skinfolds differed at ages nine and ten, and females had higher averages. On the other hand, subscapular skinfolds for females showed differences at nine and eleven years old, remaining the same at ten years old and, for males, there was no difference at eleven years old. The results of the triceps skinfolds showed differences at ten and eleven years old for girls and in all age groups for boys (Table 01).
A study27 mentions that measures of skinfolds have high associations with measures of adiposity, especially between ten and 15 years of age. In the literature, the authors used and recommended the use of skinfold protocols using the subscapular and triciptal folds in children aged between nine and twelve years old, indicating that these measures are reliable and efficient28.
CONCLUSION
This study reinforces the need for data representation by means of specific growth curves for children with DS that contribute to health monitoring, as well as to monitoring of their nutritional status and growth during development. The identification of growth variables in children with DS becomes an important theoretical framework for supporting professionals and parents of this population.
REFERENCES
1. Allt JE, Howell CJ. Down's syndrome. BJA CEPD Reviews. 2003; 3(3): 83-86. Doi: 10.1093/bjacepd/mkg083. [ Links ]
2. Costa A, Herrero D. Perspectives on the use of mouse models of Down Syndrome in translational research involving visual and motor functions. J Hum Growth Dev. 2014; 24(2): 123-125. [ Links ]
3. Barbosa EL, Fernandes PR, Fernandes Filho J. Anthropometry, muscular strength and dermatoglyphics of individuals with Down's Syndrome. Fit Perf J. 2009; 8(4): 269-278. Doi: 10.3900/fpj.8.4.269.p. [ Links ]
4. Rogol AD, Clark PA, Roemmich JN. Growth and pubertal development in children and adolescents: effects of diet and physical activity. Am J Nutr. 2000; 72(2): 521S-8. [ Links ]
5. Petroski EL, Silva RJS, Pelegrini A. Crescimento físico e estado nutricional de crianças e adolescentes da região de Cotinguiba. Rev Paul Pediatr. 2008; 26(3): 206-11. [ Links ]
6. Zeferino AMB, Barros Filho AA, Bettiol H, Barbieri MA. Monitoring growth. J Pediatr. 2003; 79(Suppl 1): 23-32. Doi: 10.1590/S0021-75572003000700004 [ Links ]
7. Pires BS, Akutsu RC, Coelho LC, Asakura L, Sachs A, Abrão ACVF, et al. Comparação entre curvas de crescimento do Center for Disease Control and Prevention e da Organização Mundial da Saúde para lactantes com idade de seis a 12 meses. Rev Paul Pediatr. 2012; 28(4): 314-319. Doi: 10.1590/S0103-05822010000 400005. [ Links ]
8. Gameren-Oosteron HBMV, Dommelen PV, Oudesluys-Murphy AM, Buitendijk SE, Buuren SV, Wouve JPV. Healthy Growth in Children with Down Syndrome. PLoS ONE. 2012; 7(2): doi:10.1371/journal.pone.0031079 [ Links ]
9. Cronk C, Crocker AC, Pueschel SM, Shea AM, Zackai E, Pickens G, et al. Growth charts for children with down syndrome: 1 month to 18 years of age. Pediatrics. 1988; 81(1): 102-110 [ Links ]
10. Gorla JI, Duarte E, Costa LT, Fábia F. Crescimento de crianças e adolescentes com Síndrome de Down - uma breve revisão de literatura. Rev Bras Cineantropom Desempenho Human. 2011; 13(3): 230-237. Doi:10.5007/1980-0037.2011v13n3p230 [ Links ]
11. Mustacchi Z. Curvas padrão pôndero-estatural de portadores de Síndrome de Down procedentes da região urbana da cidade de São Paulo. [Tese de Doutorado - Programa de Pós-graduação em Farmacêuticas]. São Paulo (SP): Universidade de São Paulo; 2000. [ Links ]
12. Glaner MF. Physical growth in adolescents of the North gaúcho and West catarinense. Rev Bras Ci Mov. 2005; 13:15-20. [ Links ]
13. Boroni BM, Oliveira ACV, Renattini TSM, Sant'Anna MJC, Coates V. Síndrome de Down na adolescência: limites e possibilidades. Rev Adolescência Saúde. 2009; 6(2): 51-56. [ Links ]
14. Merrick J, Kandel I, Vardi G. Adolescents with Down syndrome. Int J Adolesc Med Health. 2004; 16(1): 13-19. [ Links ]
15. Slaughter MH, Lohman TG, Boilea RA, Stillman RJ, Van Loan M, Horswill CA, et al. Influence of maturation on relationship of skinfolds to body density: a cross-sectional study. Human Biology. 1984; 56: 681-689. [ Links ]
16. Eichstaedt CB, Lavay BW. Physical activities for individuals with Mental Retardation - Infancy through adulthood. Human Kinetics Book: Champaign: Illinois; 1992. [ Links ]
17. Moraes-Macêdo M, Roquetti-Fernandes P, Fernandes-Filho J. Tabelas de referências das qualidades físicas básicas de meninos de 9 a 14 anos. Rev Salud Pública. 2011; 13(4): 654-662. [ Links ]
18. Malina, R. M., Bouchard, C., Bar-or, O. Crescimento, maturação e Atividade Física. São Paulo: Phorte; 2009. [ Links ]
19. Su X, Lau JTF, Yu CM, Chow CB, Lee LP, But BWM, et al. Growth charts for Chinese Down syndrome children from birth to 14 years. Arch Dis Child. 2014. doi:10.1136/ archdischild-2013-304494 [ Links ]
20. Melville CA, Cooper SA, McGrother Fernandes A, Mourato AP, Xavier MJ, Andrade D, Fernandes C, Palha M. Characterization of the somatic evolution of Portuguese children with Trisomy 21 - Preliminary results. Downs Syndr Res Pract. 2001; 6(3):134-138. [ Links ]
21. Styles ME, Cole TJ, Dennis J, Preece MA. New cross sectional stature, weight, and head circumference references for Down's syndrome in the UK and Republic of Ireland. Arch Dis Chil. 2002; 87(2): 104-108. [ Links ]
22. Kimura J, Tachibana K, Imaizumi K, Kurusawa K, Kuroki Y. Longitudinal growth and heigth velocity of Japanese children with Down's syndrome. Acta Paediatr. 2003; 92(9): 1039-42. [ Links ]
23. Tüysüz B, Göknar NT, Oztürk B. Growth charts of Turkish children with Down syndrome. Am J Med Genet A. 2012; 158A(11): 2656-64. Doi: 10.1002/ajmg.a.35710. [ Links ]
24. Melville CA, Cooper SA, McGrother CW, Thorp CF, Collacott R. Obesity in adults with Down syndrome: a case-control study. J Intellect Disabil Res. 2005; 49(Pt 2): 125-33. Doi: 10.1111/j.1365-2788.2004.00616.x. [ Links ]
25. Loveday SJ, Thompson JMD, Mitchell EA. Bioelectral impedance for measuring percentage body fat in young persons with Down Syndrome: validation with dual-energy absorptiometry. Acta Paediatr. 2012; 101(11): 491-495. Doi; 10.1111/ j.1651-2227.2012. 02821.x [ Links ]
26. Freire F, Costa LT, Gorla JI. Indicadores de obesidade em jovens com síndrome de down. Motricidade. 2014; 10(2): 2-10. doi: dx.doi.org/10.6063/motricidade.10(2).1196. [ Links ]
27. Sardinha LB, Going SB, Teixeira P, Lohman T. Receiver operating characteristic analysis of body mass index, triceps, skinfold thickness, and arm girth for obesity screening in children and adolescents. Am J Clin Nutr. 1999; 70(6): 1090-1095. [ Links ]
28. Mcardle, W. D., Katch, F. I., Katch, V. L. Fisiologia do Exercício - Energia, Nutrição e Desempenho Humano. Editora Guanabara Koogan; 1998. [ Links ]
Manuscript submitted May 18 2014
Accepted for publication Sep 20 2014
Corresponding author: fabiafreire@uol.com.br
