


Serviços Personalizados
artigo
 texto em
  Inglês (pdf)
 Artigo em XML
 Referências do artigo
Indicadores

Compartilhar

 Permalink
Journal of Human Growth and Development
versão impressa ISSN 0104-1282versão On-line ISSN 2175-3598
J. Hum. Growth Dev. vol.26 no.1 São Paulo 2016
http://dx.doi.org/10.7322/jhgd.113728
ORIGINAL RESEARCH
Influence of diabetes on autonomic function in children: analysis through the geometric indices
Influência da diabetes na função autonômica de crianças: análise por meio dos índices geométricos
Thais Roque GiaconI, *; Franciele Marques VanderleiII; Anne Kastelianne França da SilvaI; Natália Turri da SilvaI; Vitor Engrácia ValentiIII; Luiz Carlos Marques VanderleiII
IPrograma de Pós Graduação em Fisioterapia. Faculdade de Ciências e Tecnologia (FCT/UNESP) - Presidente Prudente (SP), Brazil
IIProfessor Doutor do Departamento de Fisioterapia. Faculdade de Ciências e Tecnologia (FCT/UNESPS) - Presidente Prudente (SP), Brazil
IIIProfessor Doutor do Departamento de Fonoaudiologia. Faculdade de Filosofia e Ciências (FFC/UNESP) - Marília (SP), Brazil
ABSTRACT
INTRODUCTION: Diabetes mellitus type 1 has been established as one of the most common noncommunicable diseases among children, diabetic autonomic dysfunction presenting as one of its most frequent complications, however, few studies have evaluated autonomic modulation through heart rate variability in diabetic children.
OBJECTIVE: To analyze the autonomic modulation in children with diabetes mellitus type 1.
METHODS: Data from 36 children of both sexes were analyzed, who were divided into two groups: Diabetes mellitus type 1, n = 13 (11.62 ± 2.18) with a diagnosis of Diabetes mellitus type 1 and control, n = 23 (11.04 ± 1.02) without the disease. Initially personal data, weight, height, heart rate and blood pressure were collected. Subsequently, for the analysis of autonomic modulation, the heart rate beat-to-beat was captured using a heart rate monitor in the supine position for 30 minutes. The geometric indices (RRtri, TINN, Poincaré plot) were calculated to analyze autonomic modulation. The Student t test for parametric data or the Mann-Whitney test for nonparametric data, with a 5% significance level, were used for comparison between groups.
RESULTS: The results demonstrated a reduction in RRtri, TINN, SD1 and SD2 in diabetic children. The SD1/SD2 ratio was similar between groups. In the qualitative analysis of the Poincaré plot, the children with Diabetes mellitus type 1 presented a figure with less dispersion of the points when compared to the control children.
CONCLUSION: Children with diabetes mellitus type 1 have reduced overall variability and parasympathetic modulation.
Keywords: Diabetes Mellitus Type 1, Child, Autonomic Nervous System.
INTRODUCTION
Diabetes mellitus type 1 (DM1), characterized as being an autoimmune disease that results from the destruction of pancreatic beta cells due to a genetic alteration that causes a deficiency in insulin secretion1, is becoming increasingly common in childhood. It is estimated that worldwide there are nearly 500,000 children under 15 years of age with the disease2,3.
DM1 entails several complications1, diabetic autonomic neuropathy being one of the most common, which generally manifests itself initially in the cardiovascular system, triggering cardiovascular autonomic neuropathy (CAN)4,5.
CAN may represent an important negative factor as it generates an unbalanced condition of the autonomic nervous system (ANS)5. Thus, studying the dynamics of this system could generate knowledge on how neuropathies are established and how they can alter the sympathetic and parasympathetic branches of ANS5,6.
One way to assess the ANS is through heart rate variability (HRV)7, which describes the fluctuations of intervals between consecutive heart beats (RR intervals) and provides information on the diagnosis and prognosis of several diseases7,8.
Among the methods used for the analysis of HRV are the geometrical methods - triangular index (RRtri), the triangular interpolation of NN intervals histogram (TINN) and the Poincaré plot - which convert RR intervals into geometric patterns and allow the analysis of HRV through the geometric or graphic properties of the resulting patterns9.
RRtri and TINN are calculated from the construction of a density histogram of normal RR intervals, where the duration of RR intervals is represented in the x axis and the frequency with which they occur in the y axis. The union of the points of the histogram columns forms a figure similar to a triangle from which these indices are extracted10,11.
The Poincaré plot is considered by some authors as a nonlinear method, representing the nature of time series fluctuations12-14. It is constructed by plotting each RR interval against the following interval15, and can be analyzed in a quantitative way through the SD1, SD2 and SD1/SD2 ratio, or qualitatively by analyzing the figure formed by its attractor, which is useful for showing the degree of complexity of RR intervals13,14.
HRV is altered in many pathological conditions, due to an imbalance between the sympathetic and parasympathetic components7, as occurs in individuals with DM15. Studies indicate that a reduction in the overall HRV and vagal modulation occurs in this population16.
However, few studies have evaluated the autonomic modulation by means of HRV in diabetic children17-19 and the studies that were found only evaluated the HRV through indices in the time and frequency domains17-20. No studies were found that analyzed geometric and nonlinear indices in this population.
Thus, with the aim of adding elements to the literature related to the above topic, this study intended to analyze the effect of autonomic modulation in children with DM1. We hypothesized that HRV indices obtained through these methods could identify alterations in the autonomic modulation of children with DM1.
METHODS
Population
To perform this study the data of 39 children were evaluated, of both sexes with an age range of 7 to 15 years. The children were divided into two groups: DM1 and control. To define the sample size a sample calculation was carried out based on the RMSSD index. The magnitude assumed a significant difference of 19 ms, considering a standard deviation of 16 ms, with an alpha risk of 5% and beta of 80%, the sample size resulted in at least 11 children in each group.
The diabetic group was selected by convenience from the patients attended by the Regional Hospital of Presidente Prudente. For this selection, 50 telephone contacts of diabetic children were initially made available by the hospital, of these, 28 children were excluded because they were unable to participate. Of the 22 remaining children, 3 did not attend the data collections and 3 were excluded due to an error greater than 5% in the series of RR intervals. To form the control group 30 healthy children were recruited from the LAR Santa Filomena of Presidente Prudente. Of these children, 7 were excluded, 4 presented an error greater than 5% in the tracing and 3 who were overweight or obese.
Children who presented any of the following characteristics were excluded from the study: use of medications that could influence the autonomic modulation of the heart, such as propranolol or atropine, infections, metabolic diseases, except DM1, or known cardiorespiratory system diseases. The study also excluded children who did not comply with the recommendations made 24 hours before the test, those who presented series of RR intervals with an error greater than 5% and those who were overweight or obese.
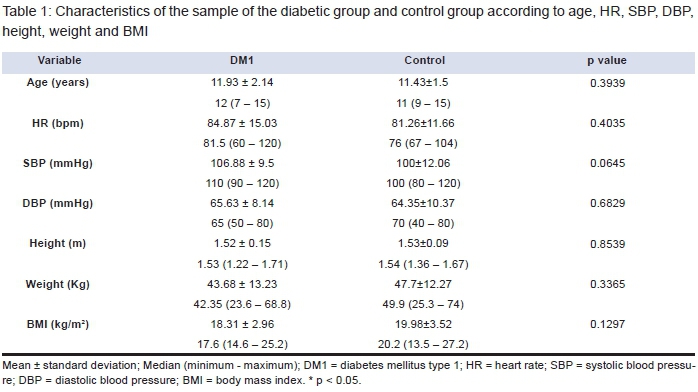
The characteristics of the included children (age, weight, height, body mass index, blood pressure and heart rate) can be seen in Table 1.
All procedures in this study were approved by the Institutional Ethics Committee (CAAE: 30935414.1.0000.5402/818.293) and the children and their parents or guardians were duly informed about the procedures and objectives of this study. After agreeing to participate, the parents or guardians signed a consent form and the children a term of assent, forming the sample.
Experimental Design
Before the experimental procedure the children were identified by collecting the following information: age, sex, race, possible symptoms and presented pathologies.
The data collection was performed in a room with a temperature between 21°C and 23°C and humidity between 40% and 60%. The children were instructed not to consume drinks that stimulate the ANS such as coffee, tea and chocolate drinks for 12 hours prior to the evaluation and, on the assessment day, they were instructed to remain silent and awake at rest, breathing spontaneously, for 30 minutes in the supine position before the autonomic evaluation.
Following identification of the children, weight, height, blood pressure and heart rate were verified, after which a capture strap was placed on the distal of the sternum of the child and a heart rate receiver, Polar S810i (Polar, Finland), was placed on the wrist, to capture heart rate beat-to-beat. After placement of the equipment the child was placed in the supine on a mat at rest with spontaneous breathing for 30 minutes and then released.
Cardiovascular Parameters Assessment
Heart rate was captured by means of a Polar S810i (Polar, Finland), previously validated for the collection of RR intervals as well as HRV analysis, using the series of intervals obtained21,22. The measurement of blood pressure was performed once, indirectly, using a stethoscope (Littman, USA) and an aneroid sphygmomanometer (Welch Allyn, USA) in the left arm, after completing the anamnesis record, in accordance with the criteria established by VI Brazilian Guidelines for Hypertension23.
Body Composition Assessment
The body composition assessment included measurement of weight and height of the children to obtain the body mass index (BMI). The weight was measured by means of a digital scale (Welmy R/I 200, Brazil) and the height using a stadiometer (Sanny, Brazil). The BMI was calculated using the formula of mass (kg) divided by height (meters) squared24.
Autonomic Assessment
For autonomic assessment, a capture strap was positioned at the distal third of the sternum of the children and the heart rate receiver, Polar S810i (Polar, Finland), at the wrist21,22. Heart rate beat-to-beat was recorded throughout the experimental protocol.
The series of RR intervals was subjected to digital filtering complemented by manual to eliminate premature ectopic beats and RR artifacts and only series with more than 95% sinus beats were included in the study25,26. For HRV analysis 1000 RR intervals were used and the indices obtained through geometric methods were calculated using Kubios HRV software (version 2.0)27.
The RRtri, TINN and Poincaré plot, which was analyzed quantitatively (SD1, SD2 and SD1/SD2) and qualitatively, were calculated.
The RRtri was calculated from the construction of the density histogram of the normal RR intervals, thus it was obtained by dividing the total number of RR intervals used for construction of the histogram by the modal frequency of the same (RR interval value that most frequently appeared in the RR series)9,14.
The TINN constitutes the width of the baseline of distribution measured as the base of a triangle, approaching the distribution of all RR intervals, and the difference of least squares was used to determine the triangle. The RRtri and TINN express the overall variability9,14.
The Poincaré plot allows that each RR interval is represented in function of following interval15. For quantitative analysis of the plot the following indices were calculated: SD1 (standard deviation of the instantaneous variability beat-to-beat), SD2 (standard deviation of the long-term continuous RR intervals) and the SD1/SD2 ratio13.
The qualitative analysis of the plot was carried out through the analysis of the figures formed by its attractor, the following standards being considered: I) Figure in which an increase in the dispersion of RR intervals is observed with increases in the intervals, characteristic of a normal plot; II) Figure with small global dispersion beat-to-beat and without increases in the dispersion of long-term RR intervals, characteristic of a plot with less variability28.
Data analysis
Descriptive statistics were used to characterize the population and the results presented as mean, standard deviation, median, minimum and maximum values. For comparison of the characteristics of the groups and geometric indices of HRV, initially the data normality was determined using the Shapiro-Wilk test. For data with normal distribution the Student t test for unpaired data was used. When normal distribution was not accepted the Mann-Whitney test was used. In all tests differences were considered statistically significant with p values less than 0.05.
RESULTS
Table 1 presents the characteristics of the sample of both groups according to age, HR, systolic blood pressure (SBP), diastolic blood pressure (DBP), height, weight and BMI. There were no statistically significant differences between groups.
The DM1 group consisted of 16 volunteers with a medical diagnosis of DM1 (11 boys and 5 girls) and a time of disease diagnosis of 4.58 ± 2.7 years, and the control group consisted of 23 healthy children (14 boys and 9 girls). The 16 DM1 children in the sample were treated only with insulin. (Table 1).
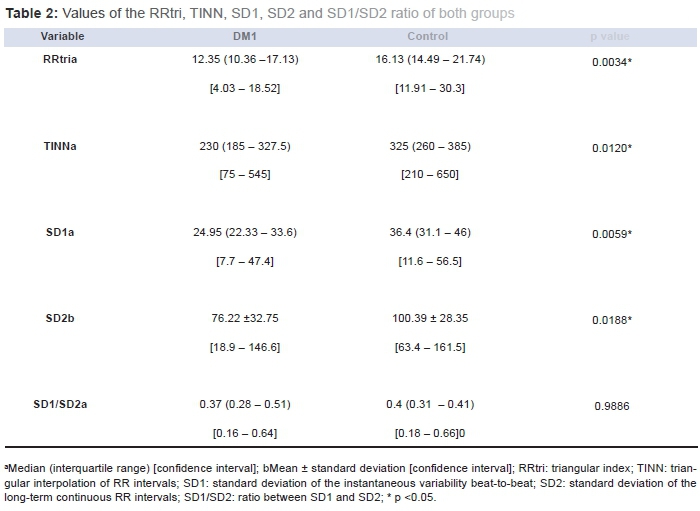
The RRtri, TINN, SD1, SD2 and SD1/SD2 ratio geometric indices are presented in Table 2. Significantly lower values were observed for the diabetic group compared to the control group, except for the SD1/SD2 ratio which did not present a significant difference between the groups. (Table 2)
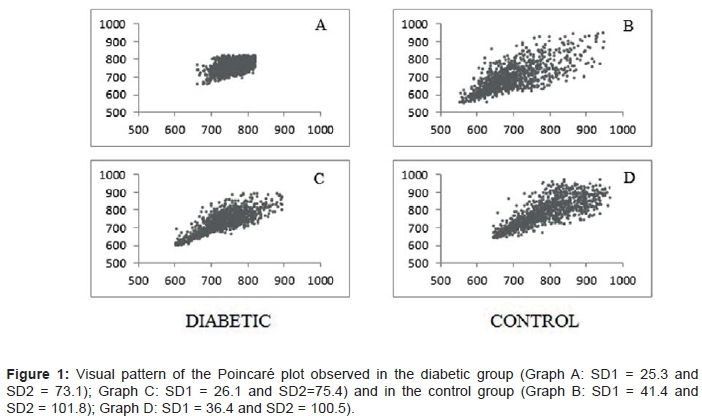
Figure 1 presents the qualitative representation of the Poincaré plot of two diabetic volunteers and two healthy volunteers, taken as representative of the other study volunteers.
DISCUSSION
In the present study, the geometric indices of HRV were evaluated in children with DM1. The results indicate a reduction in the RRtri, TINN, SD1 and SD2 in the diabetic children. The SD1/SD2 ratio was similar between groups. In the qualitative analysis of the Poincaré plot the children with DM1 presented a figure with less dispersion of the points when compared to the control children. These findings suggest that HRV is reduced in children with DM1.
The SD1 index, which represents the standard deviation of the instantaneous variability beat-to-beat and indicates the influence of the parasympathetic nervous system on the sinus node9, was lower in the diabetic children, suggesting that parasympathetic modulation is reduced in these children.
Reduction in parasympathetic modulation in children with DM1 has also been reported by other authors using HRV indices in the time and frequency domains17,18. According to Kardelen et al.18, children with DM1 (mean age: 12.0±4.0 years) demonstrated a significant reduction in the RMSSD and HF (ms2) indices and Chen et al.17 observed lower values of the LnHF index in children with DM1 (mean age: 10.3±1.6 years) compared with healthy children, both indicating reduced parasympathetic modulation.
There is evidence that autonomic dysfunction in diabetics begins in the parasympathetic nervous system (PNS), as it is believed that CAN affects the longest nerve fibers, related to vagus nerve damage, first and thus influences the parasympathetic modulation5,20. These results suggest that indices that assess the PNS are important for detecting early alterations in the autonomic modulation of these patients.
The analysis of SD2, RRtri and TINN, which evaluate the overall variability of RR intervals9, demonstrated a reduction in the children with diabetes compared to the healthy children, suggesting that this population also presents reduced overall HRV, corroborating data presented by other studies.17
Kardelen et al.18 evaluated the overall variability of RR intervals of children with DM1 and found a significant reduction in SDNN, suggesting a reduction in the overall variability of the RR intervals. Ozgur et al.20 also assessed the overall variability through the SDNN index and found no significant differences between the groups, however, lower values were observed in the group of diabetic children compared to the healthy group.
In relation to the SD1/SD2 ratio, the analysis showed that there were no significant differences in this index when comparing the group of children with DM1 and the group of healthy children, which is justified by the reduction in the SD1 and SD2 indices in the children with DM1.
Corroborating the above findings, the visual analysis of the Poincaré plot also suggested a reduction in the overall HRV of children with DM1. In these children the analyses demonstrated a lower dispersion of RR intervals both beat-to-beat and long-term, compared to healthy children.
Similar results were found in a study with obese children aged 8 to 13 using the Poincaré Plot for qualitative analysis. This study found a smaller dispersion of RR intervals both beat-to-beat and long-term in the group of obese children compared to the control group14.
It is known that the metabolic needs of the organism are regulated by the HRV, so a high HRV reflects the ability of the body to adapt, reflecting a good state of health, whereas when damage or disturbances occur in the control of this system, the HRV is reduced29,30. This reduction in HRV may be the first indication of CAN in diabetic patients5.
In summary, it was observed that the presence of DM1 in children causes alterations in the dynamics of ANS; this fact should be prevented and treated, since autonomic neuropathy is associated with a worsening in the prognosis and quality of life4,20.
Thus, it is understood that early detection of alterations in the ANS is important so that treatment strategies can be developed in a more direct manner, contributing to the prevention of the onset of complications or preventing the evolution of the clinical condition, providing a better prognosis to the patient17,31.
As study limitations, we can mention its transversal nature, which makes it impossible to monitor the autonomic behavior of these children, limiting the assessment of the temporal evolution of the disease. In addition, the time of diagnosis was different among the diabetics, which might have influenced the analyzed indices. Future studies should be performed longitudinally with this population in order to verify the progression of autonomic changes and assess whether the disease diagnosis time influences the indices that assess autonomic modulation.
In conclusion, children with diabetes mellitus type 1 have reduced overall variability and parasympathetic modulation. The results indicate that the indices used are effective for clinical evaluation of autonomic manifestations of the disease and monitoring therapeutic procedures performed in these patients.
REFERENCES
1. Sociedade Brasileira de Diabetes (SBD). Diretrizes da Sociedade Brasileira de Diabetes: 2013-2014. São Paulo: Grupo Editorial Nacional; 2014. [ Links ]
2. Patterson C, Guariguata L, Dahlquist G, Soltész G, Ogle G, Silink M. Diabetes in the young - a global view and worldwide estimates of numbers of children with type 1 diabetes. Diabetes Res Clin Pract. 2014;103(2):161-75. DOI: http://dx.doi.org/10.1016/j.diabres.2013.11.005 [ Links ]
3. Britto TB, Sadala MLA. Diabetes mellitus juvenil: a experiência de familiares de adolescentes e pré-adolescentes. Ciênc Saude Coletiva. 2009;14(3):947-60. DOI: http://dx.doi.org/10.1590/S1413-81232009000300031 [ Links ]
4. Alves RL, Freitas FM, Fernandes ASN, Ferraz SC, Silva E, Côrrea CL, et al. Modulação autonômica e capacidade funcional em indivíduos portadores de diabetes. J Hum Growth Dev. 2012;22(3):321-7. DOI: http://dx.doi.org/10.7322/jhgd.46396 [ Links ]
5. Balcioğlu AS, Müderrisoğlu H. Diabetes and cardiac autonomic neuropathy: clinical manifestations, cardiovascular consequences, diagnosis and treatment. Worl J Diabetes. 2015;6(1):80-91. DOI: http://dx.doi.org/10.4239/wjd.v6.i1.80 [ Links ]
6. Pop-Busui R. Cardiac autonomic neuropathy in Diabetes. A clinical perspective. Diabetes Care. 2010;33(2): 434-41. DOI: http://dx.doi.org/10.2337/dc09-1294 [ Links ]
7. Abreu LC. Variabilidade da frequência cardíaca como marcador funcional do desenvolvimento. J Hum Growth Dev. 2012;22(3): 279-82. DOI: http://dx.doi.org/10.7322/jhgd.46712 [ Links ]
8. Santana MDR, Souza ACA, Abreu LC, Valenti VE. Association between oral variables and heart rate variability. Int Arch Med. 2013;6(1):49. DOI: http://dx.doi.org/10.1186/1755-7682-6-49 [ Links ]
9. Silva SAF, Guida HL, Antônio AMS, Vanderlei LCM, Ferreira LL, Abreu LC, et al. Auditory stimulation with music influences the geometric indices of heart rate variability in men. Int Arch Med. 2014;7:27. DOI: http://dx.doi.org/10.1186/1755-7682-7-27 [ Links ]
10. Rajendra AU, Paul JK, Kannathal N, Lim CM, Suri JS. Heart rate variability: a review. Med Bio Eng Comput. 2006;44(12):1031-51. DOI: http://dx.doi.org/10.1007/s11517-006-0119-0 [ Links ]
11. Task Force of the European Society of Cardiology and the North American Society of Pacing and Electrophysiology. Heart rate variability: standards of measurement, physiological interpretation and clinical use. Circulation. 1996;93(5):1043-65. DOI: http://dx.doi.org/10.1161/01.CIR.93.5.1043 [ Links ]
12. Voss A, Baier V, Schuluz S, Bar KJ. Linear and nonlinear methods for analyses of cardiovascular variability in bipolar disorders. Transl Psychiatry. 2006;8(5 Pt 1):441-52. DOI: http://dx.doi.org/10.1111/j.1399-5618.2006.00364.x [ Links ]
13. Vanderlei FM, Rossi RC, Souza NM, Sá DA, Gonçalves TM, Pastre CM, et al. Heart rate variability in healthy adolescentes at rest. J Hum Growth Dev. 2012;22(2);173-78. [ Links ]
14. Vanderlei LCM, Pastre CM, Freitas Júnior IF, Godoy MF. Índices Geométricos de Variabilidade da Frequência Cardíaca em Crianças Obesas e Eutróficas. Arq Bras Card. 2010;95(1):35-40. DOI: 10.1590/S0066-782X2010005000082 [ Links ]
15. Guzik P, Piskorski J, Krauze T, Schneider R, Wesseling KH, Wykretowicz A, et al. Correlations between the poincaré plot and conventional heart rate variability parameters assessed during paced breathing. J Physiol Sci. 2007;57(1):63-71. DOI: http://doi.org/10.2170/physiolsci.RP005506 [ Links ]
16. Gardim CB, Oliveira BAP, Bernardo AFB, Gomes RL, Pacagnelli FL, Lorençoni RMR, et al. Variabilidade da frequência cardíaca em crianças com diabetes melito tipo 1. Rev Paul Pediar. 2014;32(2):279-85. DOI: http://doi.org/10.1590/0103-0582201432215513 [ Links ]
17. Chen S, Lee Y, Chiu H. Impact of physical activity on heart rate variability in children with type 1 diabetes. Childs Nerv Syst. 2008;24(6):741-7. DOI: http://doi.org/10.1007/s00381-007-0499-y [ Links ]
18. Kardelen F, Akçurin G, Ertug H, Akçurin S, Bircan I. Heart rate variability and circadian variations in type 1 diabetes mellitus. Pediatr Diabetes. 2006;7(1):45-50. DOI: http://doi.org/10.1111/j.1399-543X.2006.00141.x [ Links ]
19. Lucini D, Zuccotti G, Malacarne M, Scaramuzza A, Riboni S, Palombo C, et al. Early progression of the autonomic dysfunction observed in pediatric type 1 diabetes mellitus. Hypertension. 2009;54(5):987-94. DOI: http://doi.org/10.1161/hypertensionaha.109.140103 [ Links ]
20. Özgür S, Ceylan Ö, Senocak F, Örün UA, Dogan V, Yilmaz O, et al. An evaluation of heart rate variability and its modifying factors in children with type 1 diabetes. Cardiol Young. 2014;24(5):872-9. DOI: http://doi.org/10.1017/S1047951113001224 [ Links ]
21. Vanderlei L, Silva R, Pastre C, Azevedo F, Godoy M. Comparison of the Polar S810i monitor and the ECG for the analysis of heart rate variability in the time and frequency domains. Braz J Med Biol Res. 2008;41(10):854-59. DOI: http://doi.org/10.1590/S0100-879X2008005000039 [ Links ]
22. Gamelin F, Berthoin S, Bosquet L. Validity of the polar s810 heart rate monitor to measure R-R intervals at rest. Med Sci Sports Exerc. 2006;38(5):887-93. DOI: http://doi.org/10.1249/01.mss.0000218135.79476.9c [ Links ]
23. Sociedade Brasileira de Cardiologia; Sociedade Brasileira de Hipertensão; Sociedade Brasileira de Nefrologia. VI Diretrizes brasileiras de hipertensão. Arq Bras Cardiol. 2010; 95(1 supl 1):1-3. DOI: http://dx.doi.org/10.1590/S0066-782X2010001700001 [ Links ]
24. Associação Brasileira para o Estudo da Obesidade e da Síndrome Metabólica (Abeso) Diretrizes Brasileiras de Obesidade: 2009/2010. 3ed. São Paulo: AC Farmacêutica; 2009; p.1-83. [ Links ]
25. Porto LG, Junqueira Jr LF. Comparison of time-domain short-term heart interval variability analysis using a wrist-worn heart rate monitor and the conventional electrocardiogram. Pacing Clin Electrophysiol. 2009;32(1):43-51. DOI: http://dx.doi.org/10.1111/j.1540-8159.2009.02175.x [ Links ]
26. Vanderlei FM, Vanderlei LCM, Garner DM. Heart rate dynamics by novel chaotic globals to HRV in obese youths. J Hum Growth Dev. 2015;25(1):82-8. DOI: http://dx.doi.org/10.7322/jhgd.96772 [ Links ]
27. Niskasen JP, Tarvainen MP, Ranta-Aho PO, Karjalainen PA. Software for advanced HRV analysis. Comput Methods Programs Biomed. 2004;76(1):73-81. DOI: http://dx.doi.org/10.1016/j.cmpb.2004.03.004 [ Links ]
28. Tulppo MP, Huikuri HV, Tutungi E, Kimmerly DS, Gelb AW, Hughson RL, et al. Feedback effects of circulating norepinephrine on sympathetic outflow in healthy subjects. Am J Physiol Heart Circ Physiol. 2005;288(2):705-10. DOI: http://dx.doi.org/10.1152/ajpheart.00540.2004 [ Links ]
29. Barreto GS, Vanderlei FM, Vanderlei LCM, Garner DM. Risk Appraisal by novel chaotic globals to HRV in subjects with malnutrition. J Hum Growth Dev. 2014;24(3):243-8. DOI: http://dx.doi.org/10.7322/jhdg.88900 [ Links ]
30. Souza ACA, Cisternas JR, Abreu LC, Roque AL, Monteiro CBM, Adami F, et al. Fractal correlation property of heart rate variability in response to the postural change maneuver in healthy women. Int Arch Med. 2014;7:25. DOI: http://dx.doi.org/10.1186/1755-7682-7-25 [ Links ]
31. Ranasinghe DC, Ranasinghe P, Jayawardena R, Matthews DR, Katulanda P. Evaluation of physical activity among adults with diabetes mellitus from Sri Lanka. Int Arch Med. 2014;7:15. DOI: http://dx.doi.org/10.1186/1755-7682-7-15 [ Links ]
Manuscript submitted: Feb 16 2016
Accepted for publication Feb 22 2016.
* Corresponding author: Thais Roque Giacon - E-mail: thaisgiacon@hotmail.com

