


Services on Demand
article
 text in
  English (pdf)
 Article in xml format
 Article references
Indicators

Share

 Permalink
Journal of Human Growth and Development
Print version ISSN 0104-1282On-line version ISSN 2175-3598
J. Hum. Growth Dev. vol.28 no.1 São Paulo Jan./Mar. 2018
http://dx.doi.org/10.7322/jhgd.138687
ORIGINAL ARTICLE
Growth and biochemical markers of preterm newborns up to six months of corrected age
Grasiely Masotti Scalabrin BarretoI; Sandra Lucinei BalboII; Milene Sedrez RoverI; Beatriz Rosana Gonçalves de Oliveira TosoII; Hugo Razini de OliveiraIII; Cláudia Silveira VieraII
IUnidade de Terapia Intensiva Neonatal - Hospital Universitário do Oeste do Paraná-PR, Brazil
IIColegiado de Enfermagem. Mestrado de Biociências e Saúde. Universidade Estadual do Oeste do Paraná, Cascavel-PR, Brazil
IIISecretaria Municipal de Saúde - SESAU. Cascavel- PR, Brazil
ABSTRACT
INTRODUCTION: Due to advances in recent decades in maternal-foetal and neonatal medicine, a greater survival of preterm infants with progressively smaller birth weight and gestational age is observed, increasing the risk of future morbidities on those infants. Among these morbidities, alterations in growth and metabolism are found.
OBJECTIVE: To analyze the evolution of the growth and the metabolic profile of preterm infants' cohort from birth at six months of corrected age (CA)
METHODS: A descriptive and prospective study with a sample of 107 mothers and 115 preterm infants at birth and 72 preterm infants and 68 mothers at the end of follow-up. Growth (body weight, height, cephalic perimeter) was evaluated at six time points. Plasma concentrations of cholesterol, triglycerides, glucose and insulin of premature infants were assessed during three periods, from birth to 6 months of CA. Comparative analysis of the initial sample and the sample that finished the follow-up was used in chi-square family tests. To Evaluate the growth over the 6-month period by using repeated measurements.
RESULTS: Sociodemographic variables and maternal biochemical profile without statistical differences in the comparison of the mothers of the initial sample with those who completed the follow-up. Linear growth of preterm infants at six months of CA, however without recovery of growth. Plasma concentrations of triglycerides (birth = 48.1, 6 months = 151.1) and cholesterol (birth = 82.7, 6 months = 139.9) increased during the evaluations. Glycaemia remained stable (birth 80.4, 6 months = 83.3) and insulin decreased from 11.0 to 4.2.
CONCLUSION: Growth of preterm infants, although linear, was lower than expected for age. Lipid profiles presented an ascending curve from birth onward. Therefore, this group is prone to delayed growth and to developing cardiovascular changes throughout life.
Keywords: premature infant, growth, lipids, blood glicose, insulin.
INTRODUCTION
With the scientific and technological advances of recent decades, an increase in the survival of premature new-borns (PT) has been identified, each time with a lower gestational age (GA). Consequently, these PT remain for long periods in neonatal intensive care units (NICU). Despite the intensive care offered, these children are subject to complications due to prematurity and to the procedures and manipulations they undergo, both during hospitalization and after discharge from the NICU.
Still associated with the adversities of the extra-uterine environment, the foetal period is often experienced in a sub-optimal intrauterine environment, so PTs are subject to injuries throughout their lives1. Among them are those that affect growth, which is a continuous process resulting from the interaction of genetic, hormonal, environmental and nutritional factors2.
Intrauterine malnutrition and low birth weight associated with changes in growth in the first year of life predispose the individual to metabolic alterations in adulthood3. Changes in postnatal growth may lead to growth retardation4 and chronic problems in childhood, adolescence and adulthood5. In this context, the development of obesity, cardiovascular diseases, hypertension, diabetes mellitus type 2 (DM2) and dyslipidaemia are highlighted. All these diseases characterize the metabolic syndrome (MS), whose basis for all these alterations is resistance to insulin. This situation corroborates the current understanding that diseases in adulthood may be of foetal origin6.
The phenomenon of early catch-up, that is, the acceleration in the PT growth rate, although beneficial to neurodevelopmental outcomes, is also related to adverse metabolic consequences in adulthood7. Premature infants are at a high risk of accelerated weight gain in the postnatal period leading to obesity later in life as well as the development of diseases linked to MS8. Studies show an increasing association between the risk of obesity and metabolic disease in adulthood, influenced by the intrauterine environment experienced in the foetal period and in the postpartum period9-11.
Despite these lines of evidence, in Brazil, the continuity of health care for PT in the first years of life presents gaps in the literature regarding the repercussions of the PT growth rate and the evolution of the lipid and glycaemic profiles in the first weeks of life and in the long run. Knowing these aspects in this group is urgent: on one hand, there is a need to increase the weight of these children to reduce the nutritional deficit that causes greater morbidity and mortality in the first years of life and brings with it positive neurological repercussions; on the other hand, the accelerated weight gain is associated with risks of cardiovascular diseases and MS later in life12,13.
In this sense, the routine follow-up of PT after discharge from the NICU should include the monitoring of growth evolution combined with the analysis of the metabolic profile of these children in the corrected first year of age to identify the health risks of these PTs and to prevent the onset of obesity and its comorbidities in adult life.
Considering the scientific evidence about the PT growth rate and the health repercussions, and because the national literature presents few studies demonstrating the lipid and glycaemic parameters in prematurity, this study aims to characterize the evolution of growth and the metabolic profile of a PT cohort from birth to 6 months of corrected age (CA).
METHODS
This was a prospective study, developed in a university hospital in Paraná, from June 2015 to December 2016. The study population consisted of mothers and their PT admitted to the NICU.
Participants who met the following inclusion criteria were included in the first stage of the study upon admission to the NICU: less than 37 weeks of GI, childbirth that occurred in the institution, absence of malformation and minimum of 7 days' stay in the NICU.
In the second stage, all those selected in the first stage who returned to the outpatient clinic were included, and four follow-up appointments were scheduled as follows: 7-10 days, 1 month and 3 months after discharge from hospital and at 6 months of CA.
The mothers and PTs included in the study at the time of PT admission to the NICU were called the initial sample, and all those PTs and their mothers who attended the follow-up visits at 6 months of CA were identified as the final sample. Thus, the study sample was obtained by convenience sampling, in which an initial sample was obtained, totalling 107 mothers and 115 PTs. The loss at follow-up was 37.39%; therefore, the final sample consisted of 72 PTs and their respective mothers (n = 68 due to twin births). For the evaluation of PT data, the chi-square family test with a sample power of 0.99 and a mean effect size of 0.25 was used. All statistical analyses were performed in the Statistica 7.0 program14.
For the evaluation of growth over the 6-month period, the 72 PTs were evaluated through six measures, corresponding to the admission period; discharge from the NICU; evaluation 1, 7-10 days after discharge; evaluation 2, 1 month after discharge from the NICU; evaluation 3, in the third month after discharge and evaluation 4, at 6 months of corrected age. This sample was analysed by means of a repeated measures design and, for this, the effect size was 0.15, the probability of a type I error was 0.05 and the sampling power was 0.99.
Data collection was performed by a trained team of researchers who followed daily work schedules, collecting the maternal sociodemographic information and clinical data of the PTs through a previously tested instrument and feeding the database with double checking, updated daily.
The study participants' enrolment began with the consent of the pregnant woman in preterm labour at the Obstetric Centre (OC). At the time of enrolment in the study, analysis of the glycaemic (glucose and insulin) and lipid (total and triglycerides) profiles was conducted from routine blood samples taken at routine admission examinations of pregnant women in the OC.
Up to 72 hours after birth, a blood sample was obtained from the routine collection in the NICU to perform the biochemical analyses for glucose, triglycerides, total cholesterol and PT insulin. The maternal biochemical and PT assays were performed by the dry chemical method with a sensitivity of 10 mg/dL for triglycerides, 20 mg/dL for glycaemia and 50 mg/dL for total cholesterol. Insulin levels were measured using the electrochemiluminescence method with a sensitivity of 0.03 nIU/mL. The same analyses were performed on PT at the time of discharge from the NICU and at outpatient return at 6 months of CA.
The anthropometric data collected were cephalic perimeter (CP), weight and height verified on admission to the NICU and weekly, following the standard operating procedure established for the unit. The anthropometric measurements at the time of discharge from the NICU were recorded.
Data analysis used the chi-square test for independent samples using the Monte Carlo permutation method for qualitative variables. The quantitative variables were evaluated by analysis of variance for repeated measures, followed by Fisher's least significant difference test to verify the differences between the averages at each evaluation time point of the biochemical data, with a significance level of 5% (p = 0.05).
RESULTS
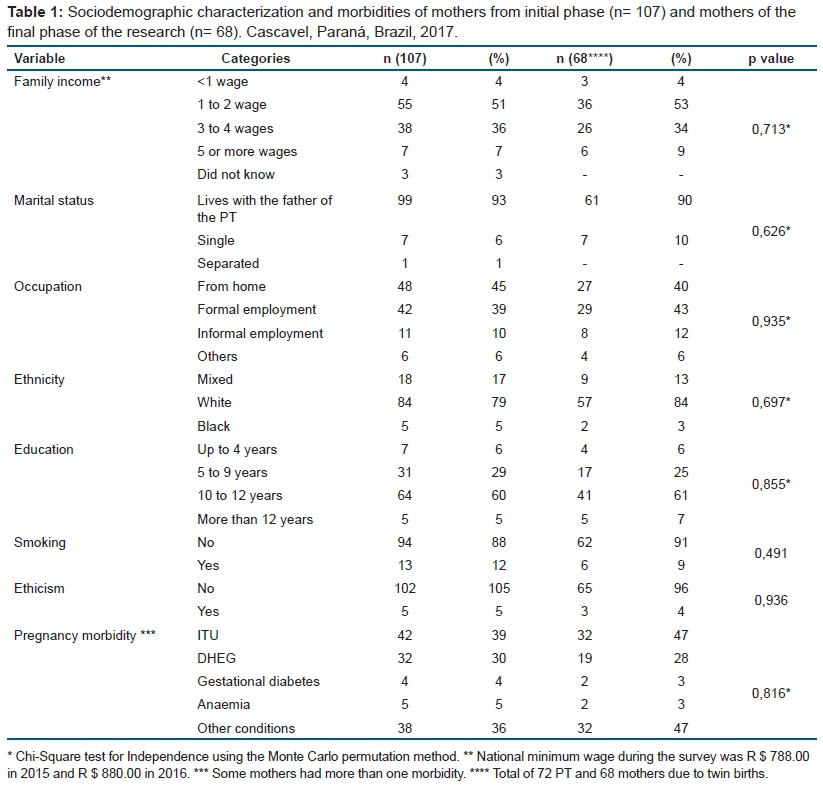
The maternal characterization showed no significant differences between the group of mothers in the initial sample (n = 107) and the final sample (n = 68) for maternal sociodemographic data (p > 0.05). The mothers had a mean age of 26 ± 7 years, with a minimum age of 15 years and a maximum of 43 years. Regarding maternal biochemical parameters, a comparison of the biochemical profiles between the mothers who started and finished the follow-up did not produce a statistically significant difference (p > 0.05), with mean values of 102 ± 39 for glycaemia, 22 ± 34 for insulin, 201 ± 78 for triglycerides and 211 ± 48 for cholesterol.
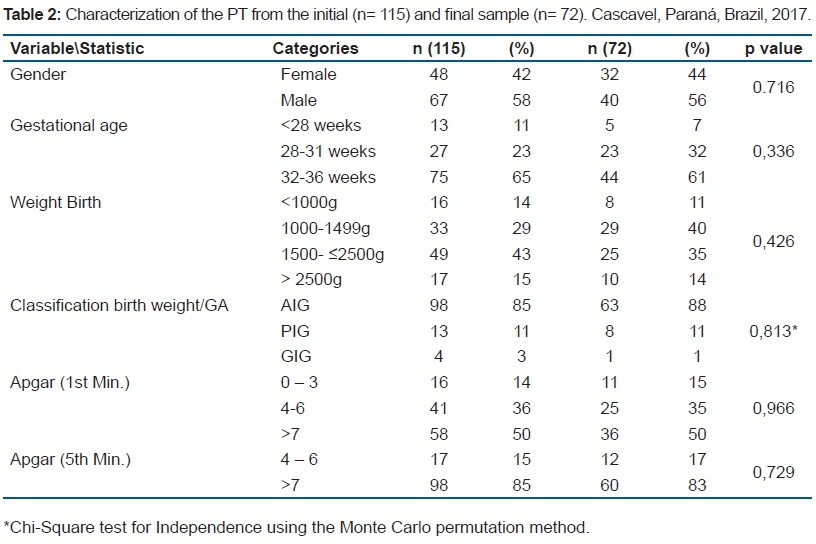
Regarding PT, there was no statistically significant difference between the initial sample allocated at NICU admission and the one that completed the follow-up with respect to birth characteristics (Table 2), and the mean length of hospital stay was 24 days (minimum = 7 days, maximum = 93 days). The variables gender, birth weight, birth weight classification, Apgar score at 1 min and Apgar score at 5 min did not present statistically significant differences between the initial and final samples (p > 0.05). However, the highest frequency in the final sample occurred in those PTs with birth weight between 1000 and 1499 g, which comprised 40% of occurrences.
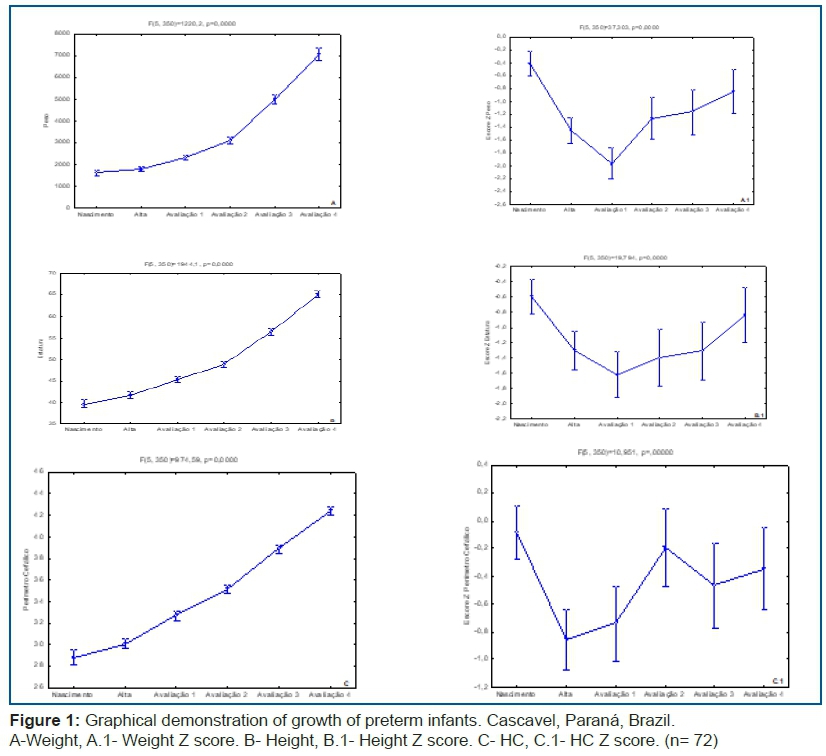
Figure 1 shows the variables related to PT anthropometry that ended the follow-up at 6 months of HF, as well as the Z score for each anthropometric variable from birth, hospital discharge and the four outpatient follow-up visits (n = 72).
The data presented in the graphs of PT longitudinal growth show a statistically significant (p < 0.0001) evolution in all variables (weight, CP and height) as a function of the moments evaluated [birth, discharge from hospital, first week and first and third month after hospital discharge and at 6 months of CA (Figure 1)].
Regarding Z scores, all variables presented a significant difference (p<0.0001). However, there were moments of deceleration and stagnation of growth between one evaluation and the next one, denoting that growth recovery was lower than expected for the CA. The growth of these PTs showed decreases in mean Z-score in the period between birth and the first evaluation after discharge, recovering the growth between this period until the first month of CA however, between the third and sixth month of CA, with a slow progression of less than 0.67 SD between two consecutive Z scores.
Regarding the type of diet received by the 72 PTs who completed the follow-up, at 6 months of HF, most of the sample (59.7%) was on infant formula, while 15.3% was on mixed breastfeeding, and 25% of the total PT sample was exclusively breastfed.
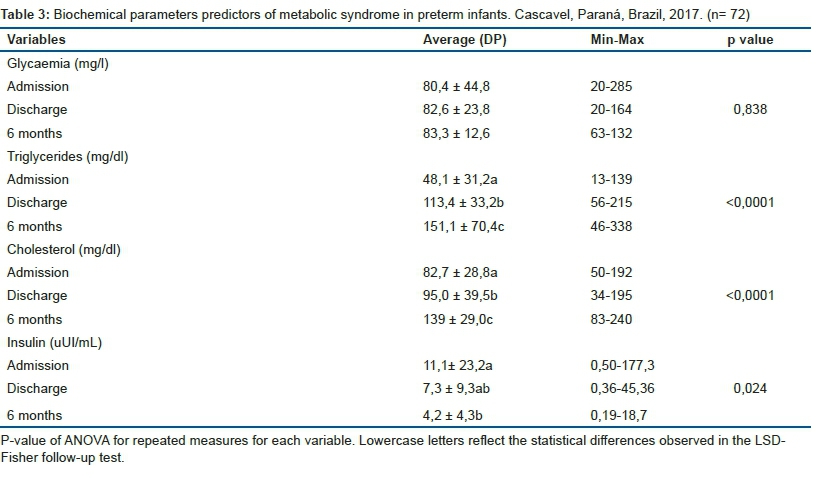
Table 3 shows the biochemical profile of PTs who comprised the final study sample (n= 72), describing glycemia, insulinaemia, total plasma cholesterol and triglyceride concentrations.
The PT blood glucose from admission to the NICU until 6 months of CA remained stable and was not statistically significant (p = 0.838). However, plasma concentrations of triglycerides and cholesterol were significantly different (p <0.0001) with a gradual increase during this period, whereas insulinaemia decreased during the same evaluation period (p = 0.024).
DISCUSSION
The growth dynamics of PT consist of maximum acceleration between 36 and 40 weeks of post-conceptional age, presenting the highest catch-up, that is, the greatest growth velocity between 24 and 36 months, when they reach normal percentiles on the reference curves. Extremely low-birth-weight PTs recover even more slowly; however, they attain lower-than-expected percentiles on the growth curves15. In the present study, the mean Z score also showed a reduction between birth and the first evaluation, with recovery of the Z score from the 2nd evaluation, but remaining lower than expected, that is, the gain was less than 0.67 standard deviations.
For CP, the variation was -0.12±0.11 and -0.40±0.17, with a strong decline in the means up to the first evaluation. The highest mean was observed in the second evaluation, with a significant decrease in the third evaluation (p<0.05). Growth velocity acceleration is expected with initial CP recovery, followed by height and last weight, so that the PT reaches a growth equilibrium and reaches, after this recovery, the adequate growth channel, indicated by the growth curves as a Z score between the Z-2 and the Z-score16. The growth of the PTs evaluated had not yet stabilized; therefore, they did not fully present the acceleration of growth velocity, especially for the CP, which should be the first to enter the appropriate growth channel.
In a study conducted in Australia with extremely premature infants and a control group of term new-borns, the differences in birth weight score were significantly lower at discharge and were progressively reduced up to 18 years of age17.
The growth of a premature infant should follow that of a foetus of the same GI, both in growth rate and body composition17. The extrauterine growth retardation, which results in a lower than expected growth, in the first weeks of life occurs in the first weeks of life, the lower the GI and the birth weight, as well as the associated morbidities, the greater weight loss in the first days of life and delay in recovery due to intercurrent hospitalization.
Longitudinal growth assessment is a fundamental reference in the follow-up of children born prematurely and is essential to minimize the consequences for their development originating in the RCEU13. In this study, the deceleration of CP growth in the first and third month after hospital discharge with slow recovery until the sixth month of CA is a cause for concern. The literature18 points out that prematurity and low birth weight are factors that exert a strong influence on growth and growth deficits in childhood, with repercussions in adult life. Therefore, observations indicate that the study sample is vulnerable to growth delays and possibly altered development throughout childhood.
Studies on the lipid, glycaemic and insulinemic profiles of PT are not common in the literature; therefore, there are no standard values for premature children. Thus, the study used as a reference data from the American Academy of Pediatrics19, which indicate that in healthy new-borns it is common to find glycaemia with values of 30mg/dl for up to 1-2 hours after birth. Plasma concentrations above 125mg/dL are characterized as hyperglycaemia; however, other authors20 use 180mg/dl as a reference. The insulinemic rates were within the parameters considered normal for age.
According to the Brazilian Society of Clinical Analyses by the recent Brazilian Consensus for the regulation of the lipid profile of 201621, cholesterol levels ≥170mg/dl and triglycerides ≥75mg/dl fasted and ≥85 mg/dl without fasting are considered high. Thus, the PT of the study sample presented cholesterolaemia within normal parameters from birth; however, the concentration of triglycerides was higher than expected from hospital discharge onward, which reinforces the association between prematurity and the development of some compromised health conditions in both children and adults22. High triglyceride concentrations in PT increase the risk of developing cardiovascular diseases in the future; therefore, we must invest in actions that promote adequate nutrition for these children from birth to minimize the risks of future chronic diseases23. Moreover, this evidence indicates that during the follow-up of this group in the first years of life, the evolution of the lipid profile should be followed, since at 2 years of age the child will have the cholesterol levels he or she will maintain in the first 10 years of life24.
When born prematurely, the PT does not have the opportunity to accumulate the requisite energy deposits by the end of the gestational period. Therefore, those who have experienced intrauterine growth restriction need to use endogenous reserves, activating lipid metabolism to generate energy and promote gluconeogenesis. The long-term consequences of these metabolic adaptations will lead to an increase in the prevalence of cardiovascular diseases, hypertension and DM2 in this group25.
From the lipid profiles obtained in this study and based on evidence from international studies, like Adamkin19, Ghaemi et al.22 Ramaraj et al.23, it is identified that these PT can be considered as at risk for cardiovascular impairment and development of MS throughout their lives.
Recognizing the vulnerability of PT to developing MS, it is necessary to take action aimed at reducing this risk. One such initiative is to encourage exclusive breastfeeding after discharge from the NICU, since this is considered a protective factor against the development of MS, both in childhood and in adulthood26.
Therefore, the data observed in our study, in combination with the literature, evidences that children born prematurely are prone to delayed growth and to developing cardiovascular changes throughout life.
Close monitoring of the growth and development of preterm infants, primarily in their first year of life, may contribute to the prevention of future complications. The results of anthropometric evaluation during the follow-up of PT indicate an evolution of growth in relation to the measurements themselves. However, their scores compared with those of full-term-born infants of the same CA followed a downward curve from birth to hospital discharge27, which resulted in extrauterine growth retardation, indicating slowness in attaining the expected parameters for age when they reached the sixth month of CA.
The lipid profile of PT showed a gradual increase in plasma concentrations from birth to 6 months of CA, and triglycerides showed high concentrations relative to those in the literature. Thus, PTs are part of a population at risk for the development of cardiovascular problems throughout their lives.
Therefore, during the follow-up of preterm infants during hospitalization, as well as throughout their first years of life, it is essential to evaluate their glycaemic and lipid profile correlating with the evolution of growth in the period to promote early interventions that may contribute to reduction of damage in adult life, as well as prevent the development of chronic conditions such as obesity, diabetes mellitus and cardiovascular problems.
However, because it is a follow-up study, we have as a limitation of the work the loss of the participants until the final outcome of the evaluation period.
In view of the survival of infants born preterm and understanding that this group is vulnerable to develop in later stages of their life problems such as CVD, DM2 and obesity, it is pointed out as contributions to the field of public health that one must consider the aspects that involve the perinatal period in the prevention of future chronic conditions. In order to reduce the risk of premature and low birth weight infants being exposed to the development of chronic no communicable diseases, which increases mortality in adulthood and is extremely costly to the public health service.
CONCLUSION
This study, by describing the evolution of the growth associated to the evolution of the metabolic profile in the first six months of corrected age, showed that the extrauterine growth retardation is a reality for this group and that the lipid profile is altered to the serum concentration of triglycerides.
REFERENCES
1. Harding JE, Derraik JG, Berry MJ, Jaquiery AL, Alsweiler JM, Cormack BE, et al. Optimum feeding and growth in preterm neonates. J Dev Orig Health Dis. 2013;4(3):215-22. DOI: http://dx.doi.org/10.1017/S2040174412000736 [ Links ]
2. Modi M, Saluja S, Kler N, Batra A, Kaur A, Garg P, et al. Growth and neurodevelopmental outcome of VLBW infants at 1 year corrected age. Indian Pediatr. 2013;50(6):573-7. DOI: http://dx.doi.org/10.1007/s13312-013-0170-5 [ Links ]
3. Hernández MI, Mericq V. Metabolic syndrome in children born small-for-gestational age. Arq Bras Endocrinol Metabol. 2011;55(8):583-9. DOI: http://dx.doi.org/10.1590/S0004-27302011000800012 [ Links ]
4. Sassa AH, Higarashi IH, Bercini LO, Arruda DC, Marcon SS. Bebê de risco: acompanhando o crescimento infantil no primeiro ano de vida. Acta Paul Enferm. 2011;24(4):541-9. DOI: http://dx.doi.org/10.1590/S0103-21002011000400015 [ Links ]
5. Farooqi A, Hagglof B, Sedin G, Serenius F. Impact at age 11 years of major neonatal morbidities in children born extremely preterm. Pediatrics. 2011; 127(5):1247-57. DOI: http://dx.doi.org/10.1542/peds.2010-0806 [ Links ]
6. Balci MM, Acikel S, Akdemir R. Low birth weight and increased cardiovascular risk: Fetal programming. Int J Cardiol. 2010;144(1):110-11. DOI: http://dx.doi.org/10.1016/j.ijcard.2008.12.111 [ Links ]
7. Singhal A. Long-term adverse effects of early growth acceleration or catch-up growth. Ann Nutr Metab. 2017;70(3):236-240. DOI: http://dx.doi.org/10.1159/000464302 [ Links ]
8. Coelli AP, Nascimento LR, Mill JG, Molina MCB. Prematuridade como fator de risco para pressão arterial elevada em crianças: uma revisão sistemática. Cad Saúde Pública. 2011; 27(2):207-18. DOI: http://dx.doi.org/10.1590/S0102-311X2011000200002 [ Links ]
9. Parkinson JR, Hyde MJ, Gale C, Santhakumaran S, Modi N. Preterm birth and the metabolic syndrome in adult life: a systematic review and meta-analysis. Pediatrics. 2013;131(4):e1240-63. DOI: http://dx.doi.org/10.1542/peds.2012-2177 [ Links ]
10. Guerrero-Romero F, Aradillas-García C, Simental-Mendia LE, Monreal-Escalante E, de la Cruz Mendoza E, Rodríguez-Moran M. Birth weight, family history of diabetes, and metabolic syndrome in children and adolescents. J Pediatr. 2010;156(5):719-23. DOI: http://dx.doi.org/10.1016/j.jpeds.2009.11.043 [ Links ]
11. Belfort MB, Gillman MW, Buka SL, Mccormick MC. Preterm infant linear growth and adiposity gain: trade-offs for later weight status and intelligence quotient. J Pediatr. 2013;163(6):1564-9. DOI: http://dx.doi.org/10.1016/j.jpeds.2013.06.032 [ Links ]
12. Brown LD, Hay WW. The Nutritional dilemma for preterm infants: how to promote neurocognitive development and linear growth, but reduce the risk of obesity. J Pediatr. 2013;163(6);1543-5. DOI: http://dx.doi.org/10.1016/j.jpeds.2013.07.042 [ Links ]
13. Jaiswal A, Reddy A, Gaddam P, Murki S. Growth and nutritional status at corrected term gestational age in very low birth weight infants. Indian J Pediatr. 2011;78(6):673-8. DOI: http://dx.doi.org/10.1007/s12098-010-0347-z [ Links ]
14. Statsoft, INC. Programa computacional Statistica 7.0. E.A.U. 2004. [ Links ]
15. Sociedade Brasileira de Pediatria. Seguimento Ambulatorial do Prematuro de risco. Porto Alegre: Arte e Composição, 2012; p.22-27. [ Links ]
16. Roberts G, Cheong J, Opie G, Carse E, Davis N, Duff J, et al. Growth of extremely preterm survivors from birth to 18 years of age compared with term controls. Pediatrics. 2013;131(2):e439-45. DOI: http://dx.doi.org/10.1542/peds.2012-1135 [ Links ]
17. Agostoni C, Buonocore G, Carnielli VP, De Curtis M, Darmaun D, Decsi T, et al. Enteral nutrient supply for preterm infants: Commentary from the European Society for Paediatric Gastroenterology, Hepatology, and Nutrition Committee on Nutrition. J Pediatr Gastroenterol Nutr. 2010;50(1):85-91. DOI: http://dx.doi.org/10.1097/MPG.0b013e3181adaee0 [ Links ]
18. Freitas B, Priore S, Lima L, Franceschini S. Extrauterine growth restriction: Universal problem among premature infants. Rev Nutr. 2016;29(1):53-64. DOI: http://dx.doi.org/10.1590/1678-98652016000100006 [ Links ]
19. Committee on Fetus and Newborn, Adamkin DH. Committee on fetus and newborn. Postnatal Glucose Homeostasis in Late-Preterm and Term Infants. Pediatrics. 2011;127(3):575-9. DOI: http://dx.doi.org/10.1542/peds.2010-3851 [ Links ]
20. Van der Lugt NM, Smits-Wintjens VE, van Zwieten PH, Walther FJ. Short and long term outcome of neonatal hyperglycemia in very preterm infants: a retrospective follow-up study. BMC Pediatr. 2010;10:52. DOI: http://dx.doi.org/10.1186/1471-2431-10-52 [ Links ]
21. Sociedade Brasileira de Análises Clínicas (SBAC). Consenso Brasileiro para a normatização da determinação laboratorial do perfil lipídico. [cited 2017 jan 15] Available from: http://www.sbac.org.br/acompanhamento-politico/consenso-brasileiro-para-a-normatizacao-da-determinacao-laboratorial-do-per%EF%AC%81l-lipidico/ [ Links ]
22. Ghaemi S, Najafi R, Kelishadi R. Cord blood lipoprotein profile in term, preterm, and late preterm newborns. J Res Med Sci. 2014;19(11):1038-40. [ Links ]
23. Ramaraj SM, Bharath AP, Sanjay KM. Lipid profile in neonates and its relation with birth weight and gestational age. Indian J Pediatr. 2015; 82(4):375-7. DOI: http://dx.doi.org/10.1007/s12098-014-1661-7 [ Links ]
24. Rabelo LM. Fatores de risco para doença aterosclerótica na adolescência. J Pediatr. 2001;77(supl. 2):153-64. [ Links ]
25. Shenoy J, Reddy V, Baliga KN. Serum Lipid Profile in Preterm and Term Appropriate for Gestational Age Indian Newborns: A Hospital Based Comparative Study. J Neonatal Biol. 2014;3 3:156. DOI: http://dx.doi.org/10.4172/2167-0897.1000156 [ Links ]
26. Ikeda N, Shoji H, Murano Y, Mori M, Matsunaga N, Suganuma H, et al. Effects of breastfeeding on the risk factors for metabolic syndrome in preterm infants. J Dev Orig Health Dis. 2014;5(6):459-64. DOI: http://dx.doi.org/10.1017/S2040174414000397 [ Links ]
27. Ehrenkranz RA. Extrauterine growth restriction: is it preventable? J Pediatr. 2014;90(1):1-3. DOI: http://dx.doi.org/10.1016/j.jped.2013.10.003 [ Links ]
 Correspondence:
clausviera@gmail.com
Manuscript received: October 2017
Manuscript accepted: January 2017
Version of record online: March 2018

