


Serviços Personalizados
Journal

artigo
 Inglês (pdf)
 Artigo em XML
 Referências do artigo
Indicadores
Compartilhar

 Permalink
Journal of Human Growth and Development
versão impressa ISSN 0104-1282versão On-line ISSN 2175-3598
J. Hum. Growth Dev. vol.32 no.1 Santo André jan./abr. 2022
https://doi.org/10.36311/jhgd.v32.12613
ORIGINAL ARTICLE
doi: 10.36311/jhgd.v32.12613
Sleep quality of urban public transport drivers in a city in the Western Amazon, Brazil
Carlos Roberto Teixeira FerreiraII, IV; Maura Bianca Barbary de DeusII, IV; Mauro José de Deus MoraisI, II, III, IV; Romeu Paulo Martins SilvaV; Janine SchirmerVI
IPós-Graduação em Ciências da Saúde do Centro Universitário Saúde do ABC (FMABC) - São Paulo, Brazil
IICentro de Ciências da Saúde e do Desporto. Campos Rio Branco-AC. Universidade Federal do Acre (UFAC) - Acre, Brazil
IIILaboratório de Delineamento de Estudos e Escrita Cientifica (FMABC) - São Paulo, Brazil
IVLaboratório Multidisciplinar de estudos e Escrita Científica das Ciências da Saúde (LAMEECCS), UFAC - Acre, Brazil
VUniversidade Federal de Catalão - Goiás, Brazil
VIDepartamento de Enfermagem em Saúde. Universidade de São Paulo-UNIFESP - São Paulo, Brazil
ABSTRACT
INTRODUCTION: problems related to sleep have destructive effects on psychomotor skills, memory, decision making and concentration, which can influence the occurrence of accidents and errors. Bus drivers are subject to the company's strict rules in respecting timetables, caring for the vehicle and being responsible for the daily transport of people
OBJECTIVE: to analyze the sleep quality of urban public transport drivers in the city of Rio Branco, Acre, Brazil
METHODS: this is a cross-sectional study developed in the city of Rio Branco, Acre, Brazil. The sample consisted of 80 drivers. To check the quality of sleep, the Pittsburg Sleep Quality Questionnaire was used. The anthropometric variables used were neck circumference, waist circumference, skinfolds, and body mass index. The non-parametric test of Spearmand 0.05 (5%) was used to associate
RESULTS: participants were aged between 24 and 60 years, male. 81.25% of drivers had poor sleep quality according to the Pittsburg Sleep Quality Questionnaire (>5). 75% of participants have excessive body mass index and 67.5% with risky waist circumference. The neck circumference, 60% had increased values and 78.75% with the percentage of fat above the recommended. There was a strong correlation between all components and with the Pittsburg Sleep Quality Questionnaire
CONCLUSION: an association between poor sleep and body mass index and neck circumference has been demonstrated. It also showed a strong correlation between all components with the result of the Pittsburg Sleep Quality Questionnaire
Keywords: sleep apnea, body composition, body mass index.
Authors summary
Why was this study done?
This is a cross-sectional study developed in the city of Rio Branco, Acre, Brazil. The sample was intentional, consisting of 80 drivers. To check the quality of sleep, the Pittsburg Sleep Quality Questionnaire (PSQI) was used. The anthropometric variables with sleep were used measures of neck circumference, waist circumference, skinfolds, and body mass index (BMI). There was a strong correlation between all components and with the PSQI.
What did the researchers do and find?
This is a cross-sectional study developed in the city of Rio Branco, Acre, Brazil. The sample was intentional, consisting of 80 drivers. To check the quality of sleep, the Pittsburg Sleep Quality Questionnaire (PSQI) was used. The anthropometric variables with sleep were used measures of neck circumference, waist circumference, skinfolds, and body mass index (BMI). There was a strong correlation between all components and with the PSQI.
What do these findings mean?
A strong association between poor sleep and body mass index and neck circumference has been demonstrated. It also showed a strong correlation between all components with the final result of the PSQI, demonstrating that care should be taken in preventive treatments in this working class.
INTRODUCTION
Sleep is a physiological state of decreased responsiveness in which individuals awaken spontaneously. It is of primary importance in human life and has the function of restoring, conserving energy and protecting. Its lack can affect the individual's daily activities in the short or long term1.
In terms of behavior, human sleep is characterized by a reclined position, closed eyes, decreased movement, and less response to the internal and external environment2. The long-term consequences of sleep deprivation include increased morbidity and mortality, increased car accidents, heart disease, obesity, type 2 diabetes mellitus, memory loss and depression3.
Sleep-related disorders have been growing and affect millions of individuals around the world. The American Academy of Sleep Medicine estimates that billions of dollars are spent each year on sleep disorder problems4. The Institute of Medicine estimates that 50 to 70 million adult Americans have chronic sleep disorders that contribute to poor health. About 1 in 3 adult Americans are sleeping less than 7 hours a night (37.1%)5.
Sleep is a basic function and an important biological phenomenon in the maintenance of human health. Sleep-related problems have destructive effects on psychomotor skills, memory, decision making, concentration and learning, which can influence the occurrence of accidents and errors6.
Regarding urban bus drivers, long working hours and traffic stress cause physiological damage in addition to changes in sleep quality. These professionals are subject to the rules of the company they work for, in addition to strict rules on meeting schedules, caring for the vehicle and responsibility for the daily transport of people7.
In this profession, the problem related to sleep is one of the important aspects in the occurrence of accidents and errors in traffic. Another problem is poor sleep quality, which increases the risk of accidents on roads and avenues in cities8. For this reason, the risk of bus accidents is 2 and 7 times higher in individuals with poor sleep quality or drowsiness9.
Generally, drivers who report problems sleeping, staying asleep or having short night sleep tend to be at higher risk of accidents. In addition, the perception of poor sleep quality by drivers is correlated with their regularity in driving while sleepy10. Driver insomnia also tends to be associated with a high risk of sleep-related accidents11. Factors associated with drowsiness is a growing concern in low- and middle-income countries, where drivers are vulnerable to less regulated working conditions, and the socioeconomic pressures to drive for long periods without adequate rest12.
Recently, Brazil developed a new traffic code, but still, it continues to have high levels of car accidents, mainly involving bus drivers. Most of these accidents are related to failures in decision making and lack of attention from drivers13.
This professional is constantly exposed to a workload that can damage health and enhance sleep-related changes. Knowing the quality of sleep can provide an opportunity to investigate the sleep condition in this population, which can occasionally lead to work-related accidents. Therefore, the aim of this study is to analyze the sleep quality of urban public transport drivers.
METHODS
Study design
This is a cross-sectional study on sleep quality and anthropometric variables of urban public transport drivers.
Place and period of study
The work was carried out in the bus drivers' union located in the urban terminal of Rio Branco, Acre, Brazil. The location was chosen because it is a resting place and where the drivers change shifts. The collection period was in January of two thousand and fourteen.
Population and sample
300 drivers belonging to two urban public transport companies took part in the study. To approximate the sample size, the formula of Barbetta14 was used, expressed by the equation: n0=1/E02, with a sampling error of 5% (0.05). The previous calculation was corrected by the formula n = N. n0/N + n after knowing the population size. The sample size was calculated at 171 individuals, 91 were excluded, (7 due to sick leave, 32 refused to participate, 8 were on vacation and 44 did not attend the data collection site).
Exclusion and inclusion criteria
Exclusion: Absent from the company for personal reasons; absent from the company for health reasons; being on vacation during data collection; be female.
Inclusion: Have signed the consent form; being present on the day of the assessment; over 18 years of age; male.
Research instruments
Sleep Quality Questionnaire (PITTSBURGH - PSQI)
The Pittsburg-PSQI Sleep Quality Index is an instrument aimed at measuring the subjective quality of sleep and the occurrence of sleep disorders. The questionnaire consists of ten questions, of which questions one to four are open and five to ten are semi-open, and form seven components: 1 - subjective sleep quality; 2 - sleep latency; 3 - sleep duration; 4 - habitual sleep efficiency; 5 - sleep disorders; 6 - use of medication to sleep; 7 - daytime sleepiness and daytime disturbances. The component can vary on a scale from 0 to 3, with 0 indicating very good quality and 3 indicating very bad quality. The sum of the maximum score of this instrument is 21 points, so the higher the score, the worse the sleep quality. A score ≥5 indicates that the individual has "bad" sleep and <5 as "good" sleep15.
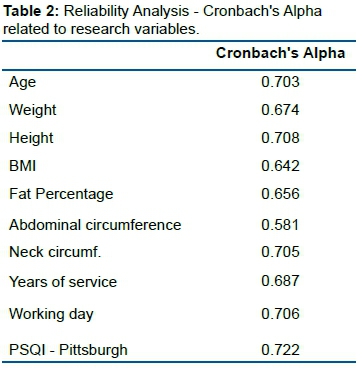
The PSQI development study showed internal consistency results of 0.722 (Cronbach's reliability correlation coefficient, which has a substantial variation of 0.61 to 1.0) for its 7 components and the global PSQI showed a sensitivity of 89 .6% and specificity of 86.5% (Kappa index=0.75; p<0.01) distinguishing normal sleep from poor quality sleep15.
Anthropometric variables
Body mass
The drivers were weighed on a Tanita® brand digital scale, with a capacity of 150 kg and 100g precision. At the time of measurement, the driver was asked to wear as little clothing as possible, without shoes, and positioned in the center of the scale, in order to distribute the body mass, observing the procedures recommended by Petroski16.
Height
To measure height, a Sanny® portable stadiometer with a capacity of up to 210 cm was used. A movable metal square was used to position the head. Measurements were taken with individuals wearing light clothing and no shoes. The driver was instructed to position himself just below the stadiometer, distributing his weight evenly on both feet and keeping his eyes fixed straight ahead. The driver kept the line of sight perpendicular to the body (Frankfurt plane). Arms remained relaxed at the sides of the trunk, with the palms facing the trunk, observing the procedures recommended by Petroski16.
To classify the nutritional status, the Body Mass Index (BMI) was used, calculated by dividing body mass (Kg) by height (m2). The Body Mass Index (BMI) was classified according to the World Health Organization17.
Abdominal circumference
Waist circumference was measured with the subject in an orthostatic position, with a flexible and inextensible anthropometric tape, passing through the umbilical scar16. To classify the abdominal risk, the classification table of the Brazilian Association for the Study of Obesity and Metabolic Syndrome was used18.
Neck circumference
Neck circumference was measured with an anthropometric tape at the midpoint of the neck and below the laryngeal prominence (Adam's apple). The cutoff point used was <40 cm for low risk and ≥40 cm for increased risk19.
Skinfolds
Triceps
The triceps fold was measured in the midline of the posterior part of the arm, over the triceps muscle, at the midpoint between the acromion and the lower level of the olecranon process of the ulna in the longitudinal direction20. The subscapular fold was measured in an inferolateral sloping diagonal, approximately 45° from the horizontal plane and 1 cm below the inferior angle of the scapula. Skinfold is measured in the midaxillary line just above the iliac crest. It is a diagonal fold, approximately 45° from the horizontal. The vertical bend is made on the medial surface of the leg, at the point of greatest circumference and with the feet flat on the floor.
The protocol used for the calculation of fat percentage was proposed by Petroski16, according to the equation, generalized to estimate body density in Brazilian male adults aged between 18 and 66 years.
D = 1,10726863 - (0,00081201(X4)) + (0,00000212(X4)2) -(0,00041761(age)) In which: X4 = Sum of 4 skinfolds (triceps, subscapularis, suprailiac and calf).
To calculate the percentage of fat (%F) the Siri formula was used21,22:
%G = [(4,95/D) - 4,50] x 100
Skinfold measurements were performed using a Lange® brand adipometer with a precision of 1 mm and constant pressure of 10 g/mm2. The classification of the percentage of body fat used in this study was that of Lohaman (1999)23.
Blood pressure
Blood pressure measurement was performed with the HEM-742INT automatic blood pressure device (Omron®, China), with the individual in a sitting position with legs uncrossed, arm supported at heart level, cuff according to arm size and in the left upper limb.
Data collection
Initially, a visit was made to the companies to obtain authorization from the responsible director. Then, the research procedures were explained to the volunteers and, if they agreed to participate, they were asked to sign the Informed Consent Form (FICF). The collections were carried out in the drivers' union room located in the urban terminal. The place is justified, as it is the place of rest and shift change between drivers.
Data collection was carried out individually in the room provided by the union between the morning and afternoon shifts. First, the purpose of the research was explained and those who agreed to participate signed the Informed Consent Form. Soon after, the drivers were subjected to collection of anthropometric measurements. The Pittsburg Sleep Quality Index (PSQI) questionnaire was applied by the researcher through questions and then marked the answers.
Statistical analysis
The data were initially tabulated in a database in the computer program Excel, from Microsoft Office® and transferred to the free software R, for analysis purposes. Data normality was verified by the Kolmogorov-Smirnov test and the comparison between the interviewed drivers' data was made by the non-parametric Mann-Whitney test.
To associate anthropometric variables with sleep quality, Spearman's non-parametric correlation test was used, with the level of significance set at 0.05 (5%) and 0.01 (0.0%).
Ethical procedures
In compliance with the recommendations in Resolution No. 466/2012, on research involving human beings24, the project was submitted and approved by the Research Ethics Committee of the Federal University of São Paulo on October 4, 2013, as per opinion No. 415.643.
RESULTS
The sample was intentional, composed of 80 drivers, aged between 24 and 60 years, and an average of 38.37 years, all male.
The data presented in table 1 show that most drivers were under 40 years of age (63.75%), characterizing the study sample as young adults. The length of service at the company was less than 10 years (67.50%), with a working day of 8 hours a day (51.25%). The highest percentage of workers were married individuals (65%) and with a family income of 2 minimum wages (80%). Most drivers had completed high school (55%), did not practice any physical activity (76.25%) and the main driver to go to work was the motorcycle (38.75%).

Table 2 demonstrates the reliability of the variables analyzed through the analysis of Cronbach's Alpha with the PSQI result. Which shows that the data is within a reliable standard.
According to the results presented in table 3, most workers in the studied sample had blood pressure less than or equal to 120x80 mmHg (47.50%). It was also observed that 45.50% of the volunteers had borderline values and 10% altered values. That is, 55.1% of the evaluated sample had altered blood pressure values.
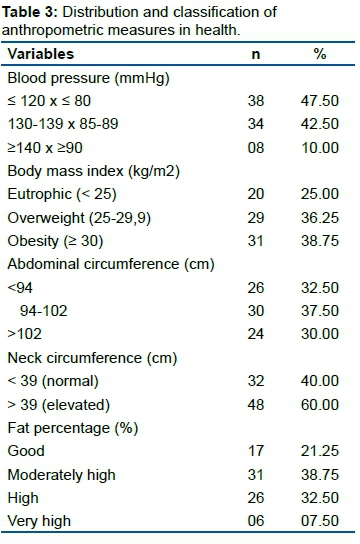
As for the anthropometric risk values, 68% of the workers had a BMI for overweight and obesity above the recommended and 67.5% with increased risk waist circumference and at risk.
In the evaluation of the neck circumference, 60% showed increased values and 78.75% with the percentage of fat above the recommended. On the other hand, 30.4% of the population studied was overweight.
It was observed that 16.2% of workers had insomnia problems and that 22.1% reported at least one sleep disorder. The fatigue score showed a very homogeneous distribution in the studied sample, with 34.1% of the workers having scores between 47 and 0 points.
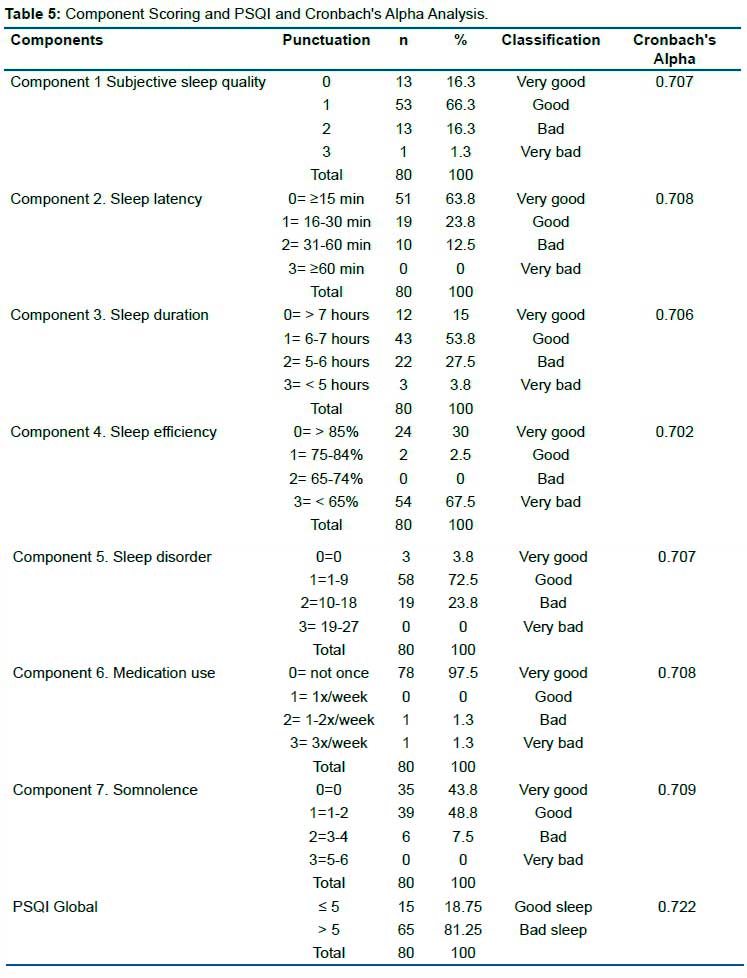
Among the evaluated drivers, 81.25% had poor sleep quality according to the PSQI results (> 5), which allows us to verify that the majority of the investigated motorists had impaired sleep (table 4).

In component 1 (objective sleep quality), it identified a very good and good classification, respectively, of the interviewees. With a low percentage in the classification "bad" and "very bad". Most drivers took 15 minutes or less to fall asleep, followed by between 31 and 60 minutes to start resting, according to component 2 (sleep latency) of the instrument applied. In relation to these two components, a high level of reliability of Cronbach's Alpha was demonstrated, giving a reliable index for the research (table 5).
In component 3 (sleep duration), there was a low index that they managed to sleep more than 7 hours in the last month. Most were located between the 6-7 hour interval and a smaller percentage were those who slept less than 6 hours a day (table 5).
Component 4, which concerns the habitual sleep efficiency of workers, which prevailed was the classification "very bad". In the evaluation of component 5, most scored in the range between 1-9 in the PSQI score, demonstrating that those investigated, at least once a week, had some complaint that hindered their sleep performance in the last month, such as snoring or poor sleep (table 5).
Most of the drivers surveyed did not use medication to aid sleep and only two respondents used medication to sleep in component 6. In drowsiness, component 7, it was possible to identify that they had problems with drowsiness at least once a week and were willing to working hours (table 5).
In the same table it was identified that when analyzing the final result of the PSQI of a predominance of bad sleep in the general classification. And when looking at the general level of Cronbach's Alpha reliability of the PSQI-related components, all give a very good level of confidence.
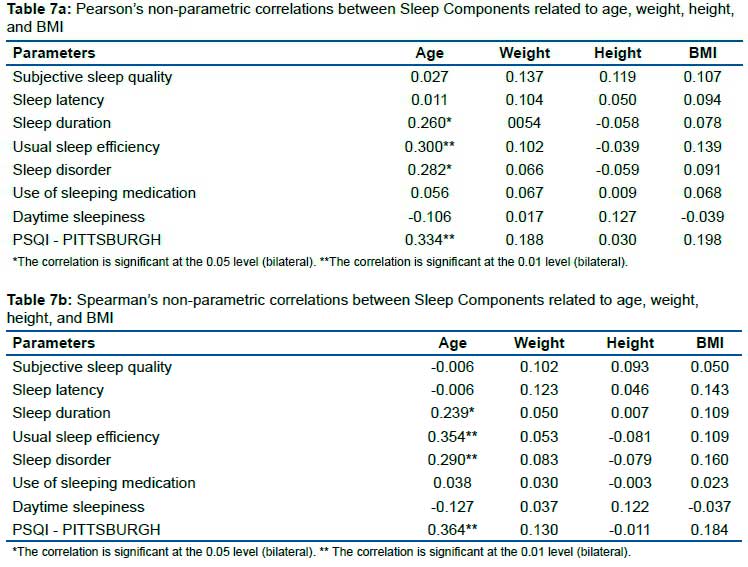
A strong correlation was identified, both in Pearson's and Spearman's analyses, between the final PSQI result with all analyzed sleep components, most of which was at the level of 0.01.
When analyzing the components and the PSQI with the anthropometric assessments of the percentage of fat, waist circumference and neck circumference, what most correlated was the percentage of fat in the two assessments involving the components "usual sleep efficiency" and "sleep disturbance", as well as with the PSQI. Followed by waist circumference with PSQI. Neck circumference did not correlate with any of the components (table 6).
In table 7, a strong correlation appeared on the variable age with sleep duration, habitual sleep efficiency, sleep disturbance and PSQI, both in Pearson's and Spearman's analysis. The other variables showed no correlation.
DISCUSSION
As the main result among the evaluated drivers, 81.25% had poor sleep quality according to the PSQI results (≥5). An association between poor sleep and body mass index and neck circumference has been demonstrated. Which allows us to see that most of the motorists investigated had impaired sleep. Sleep quality is an important component of quality of life. Poor quality sleep is a cardiovascular and metabolic risk factor that contributes to increased mortality and reduced life expectancy25. Poor sleep quality, including interrupted sleep or non-restorative sleep, is associated with a number of negative consequences, including health-related problems26.
The main characteristics of the sample showed that most drivers were under 40 years of age (63.75%), characterizing them as young adults. The length of service at the company was less than 10 years (67.50%), with a working day of 8 hours a day (51.25%). The highest percentage of workers were married individuals (65%) and with a family income of 2 minimum wages (80%). Most drivers had completed high school (55%), did not practice any physical activity (76.25%) and the main driver to go to work was the motorcycle (38.75%).
It was identified that most workers in the studied sample had blood pressure less than or equal to 120x80 mmHg (47.50%). It was also observed that 45.50% of the volunteers had borderline values, that is, 55.1% of the evaluated sample had altered blood pressure values. As for the anthropometric risk values, 68% of the workers had a BMI for overweight and obesity above the recommended and 67.5% with increased risk waist circumference and at risk. In the evaluation of the neck circumference, 60% had increased values and 78.75% with the percentage of fat above the recommended. These findings are in line with the main results of our research regarding the PSQI.
Regarding this study, 81.25% of bus drivers have poor sleep quality according to the PSQI, with an average sleep of 6±1.44 h per day. This data is relevant because, in addition to affecting sleep, the consequence of poor sleep contributes to harming work performance and increasing traffic accidents27. Corroborating this finding in the cross-sectional study carried out between 2006 and 2007, among 175 bus drivers of a transport company in Tehran, capital of Iran, it was found that the average sleep duration among these drivers was 6.37±1.62 h per day and being rated as poor sleep quality28. A study29 with truck drivers throughout Brazil showed that 46% of individuals had poor sleep quality.
In the present work, the body mass index (BMI), 36.25% were classified as overweight and 31.75% as obese. Overweight and obesity are associated with increased risk for cardiovascular disease, diabetes and metabolic syndrome30. The study by Lemos31 investigated 443 truck drivers and found that 45% were overweight and 17.3% were obese.
A survey with 53 urban bus drivers in the city of Montes Claros-MG showed that 50.9% were overweight32. Among 47.4% of the 133 urban public transport drivers in Fortaleza, Ceará were assessed as being overweight by Rocha33, showing similarity with the data found in the current survey.
Among the methods used to determine an individual's abdominal obesity, we can mention the measurement of the circumference of the abdomen34. In the present study, it was found that 37.50% of the drivers were at increased risk and 30% were at high risk, through that assessment, in addition to an association with poor sleep being observed. Corroborating these findings, Rocha35, in his research, obtained an increase in abdominal circumference associated with alterations in the function of pulmonary mechanics. In that study, 37.7% of bus drivers were in the increased risk range in relation to waist circumference.
In a study carried out with professional freight transport drivers it was found that 27% were at increased risk and 31% at high risk36, and 57% of the professional drivers of an interstate bus company were obese37.
Neck circumference is an important indicator for the accumulation of central fat in the body38. It showed that 39.2% had neck circumferential measurements above 40 cm36. In the sample with 241 interstate drivers in the city of Zonguldak, Turkey, there was an average of 39.7±2.9 cm in the neck circumference39.
In Thailand, when evaluating interstate drivers from 2007 to 2008, it was found that the average neck circumference was 40 cm for individuals with obstructive sleep apnea40.
The results also indicated that 60% of drivers have an elevated neck circumference (>39 cm). This percentage of individuals with a circumference classified as high constitutes a worrying fact, considering that they are at increased risk in the type of profession they exercise daily. The increase in obesity has shown a progressive decrease in sleep duration. Epidemiological studies have shown an inverse relationship between short or disturbed sleep and obesity. During adulthood, positive energy balance promotes metabolic and neuroendocrine changes that coincide with sleep disorders41.
Insufficient sleep can compromise the maintenance of fat-free body mass and promote fat retention, when people aim to reestablish their normal weight after life events associated with excessive food intake and increased adiposity42.
The anthropometric data identified in this research are significantly altered and when correlating with the sleep components the percentage of fat, along with the abdominal circumference, are strongly related to the final result of the PSQI, showing that the lack of body control directly affects the quality of the sleep of these professionals.
Health actions are needed for these workers that aim to promote health, seeking to interact with the educational actions to be developed by professionals, in particular, from primary health care43. The importance of optimizing public health policies that have ways for this population to be directed to programs that work with the quality of life in health is also highlighted44.
Another interesting fact was the strong correlation of all components with the final PSQI, showing that all components are negatively compromised, which may imply the need for special attention to this audience in order to provide strategies for changing behavior of these drivers in order to improve their quality of life. Thus, there is a need to establish actions to promote and prevent future complications regarding the health of these workers.
CONCLUSION
The analysis of the sleep quality of urban public transport drivers is poor, as well as the body mass index, waist circumference, neck circumference and percentage of body fat. Furthermore, there is an association between poor sleep and body mass index and neck circumference.
There was a strong correlation between all components with the final result of the PSQI which preventive care should be taken.
Author contributions
CRTF, data collection, conducting the experiments and writing the manuscript; MBBD, writing the manuscript, following the guidelines of the journal and reviewing the statistical analyses; IMPB, writing the manuscript, following the guidelines of the journal and reviewing the statistical analyses; LCA, writing the manuscript, following the guidelines of the journal and reviewing statistical analyses; MJDM collects data, conducts the experiments and writes the manuscript; RPMS, writing the manuscript, following the guidelines of the journal and reviewing the statistical analyses; JS, data collection, conducting the experiments and writing the manuscript.
Acknowledgments:
We thank the Acre State Health Secretariat (SESACRE), Acre, Brazil, the Federal University of Acre (UFAC), Acre, Brazil, and the Centro Universitário FMABC (FMABC), Santo André, São Paulo, Brazil. All researchers, undergraduate, master's and doctoral students from the Study Design and Scientific Writing Laboratory of the FMABC University Center, Santo André, São Paulo
Conflict of interest
We declare no potential conflict of interest.
REFERENCES
1.Gisele S. Moura L. Neves ASG, Patricia Florido, Marleide da Mota Gomes. Transtornos do sono: visão geral. Rev Bras Neurol. 2013; 49(2): 57-71. [ Links ]
2.Markov D, Goldman M, Doghramji K. Normal Sleep and Circadian Rhythms: Neurobiological Mechanisms Underlying Sleep and Wakefulness. Sleep Medicine Clinics. 2012; 7(3): 417-426. [ Links ]
3. Chokroverty S. Overview of sleep & sleep disorders. Indian J Med Res. 2010; 131: 126-140. [ Links ]
4. Chung MH, Kuo TBJ, Hsu N, Chu H, Chou KR, Yang CCH. Recovery after Three-shift Work: Relation to Sleep-related Cardiac Neuronal Regulation in Nurses. Ind Health. 2012; 50(1): 24-30. [ Links ]
5. Faith S. Luyster PJS, Jr., Phyllis C. Zee, James K. Walsh. Sleep: A Health Imperative. Journal Sleep. 2012; 35(6): 727-734. DOI: 10.5665/sleep.1846 [ Links ]
6. Torbjörn Åkerstedt KPWJ. Sleep Loss and Fatigue in Shift Work and Shift Work Disorder. Sleep Med Clin. 2009 4(2): 257-271. [ Links ]
7. BATTISTON M, CRUZ, R. M.,HOFFMANN,M.H. Condições de trabalho e saúde de motoristas de transporte coletivo urbano. Estudos de Psicologia. 2006; 11(3): 333-343. [ Links ]
8.RAZMPA E, NIAT, K.S., SAEDI, B. Urban Bus Drivers' Sleep Problems and Crash Accidents. Indian J Otolaryngol Head Neck Surg. 2011;63(3):269-273. Doi: 10.1007 / s12070-011-0235-5. [ Links ]
9. Karimi M, Eder DN, Eskandari D, Zou D, Hedner JA, Grote L. Impaired vigilance and increased accident rate in public transport operators is associated with sleep disorders. Accident Analysis & Prevention. 2013; 51(0): 208-214. DOI: 10.1016 / j.aap.2012.11.014 [ Links ]
10.Lucidi F, Mallia L, Violani C, Giustiniani G, Persia L. The contributions of sleep-related risk factors to diurnal car accidents. Accident Analysis & Prevention. 2013; 51(0): 135-140. doi.org/10.1016/j.aap.2012.11.015 [ Links ]
11.Philip P, Sagaspe P, Lagarde E, et al. Sleep disorders and accidental risk in a large group of regular registered highway drivers. Sleep Medicine. 2010; 11(10): 973-979. DOI: 10.1016/j.aap.2012.11.015 [ Links ]
12.Akerstedt T. Consensus Statement: Fatigue and accidents in transport operations. Journal of Sleep Research. 2000; 9(4): 395-395. [ Links ]
13.Brasil Santos D, Gonçalves Bittencourt L, de Assis Viegas CA, Gaio E. Daytime sleepiness and attention in city bus drivers of two capitals of Brazil. Revista Portuguesa de Pneumologia (English Edition). 2013; 19(4): 152-156. DOI: 10.1016 / j.rppnen.2013.06.003 [ Links ]
14.Barbetta PA. Estatística aplicada às ciências sociais. 4 ed. Florianópolis: UFSC; 2001. [ Links ]
15.Buysse DJ, Reynolds Iii CF, Monk TH, Berman SR, Kupfer DJ. The Pittsburgh sleep quality index: A new instrument for psychiatric practice and research. Psychiatry Research. 1989; 28(2): 193-213. [ Links ]
16.Petroski EL. Antropometria:técnicas e padronizções. Porto Alegre, 2009. [ Links ]
17.OMS. Obesity: preventing and managing the global epidemic. In: Organization WH, ed. Geneva, 2000. [ Links ]
18.Metabólica ABpoEdOedS. Diretrizes brasileiras de obesidade 2009/2010. In: Metabólica ABpoEdOedS, ed. 3.ed. ed2009-2010:13. [ Links ]
19.Ben-Noun L, Sohar E, Laor A. Neck Circumference as a Simple Screening Measure for Identifying Overweight and Obese Patients. Obesity Research. 2001; 9(8): 470-477. [ Links ]
20.Fontoura ASF, C.M.;Abech, E. A. Guia prático de avaliação física:uma abordagem didática,abrangente e atualizada. São Paulo2008. [ Links ]
21.Siri WE. Body composition from fluids spaces and density: analyses of methods. National Academy of Science and Natural Resource Council. 1961. [ Links ]
22.Brožek J, Grande F, Anderson JT, Keys A. DENSITOMETRIC ANALYSIS OF BODY COMPOSITION: REVISION OF SOME QUANTITATIVE ASSUMPTIONS. Annals of the New York Academy of Sciences. 1963; 110(1):113-140. [ Links ]
23.Glaner MF, Rodriguez-Añez CR. Validação de procedimentos antropométricos para estimar a densidade corporal e percentual de gordura em militares masculinos. Revista Brasileira de Cineantropometria & Desempenho Humano. 1999; 1(1): 24-29. Doi: https://doi.org/10.1590/%25x [ Links ]
24.Williamson A, Lombardi DA, Folkard S, Stutts J, Courtney TK, Connor JL. The link between fatigue and safety. Accident Analysis & Prevention. 2011; 43(2): 498-515. Doi: 10.1016 / j.aap.2009.11.011 [ Links ]
25.Tworoger SS, Yasui Y, Vitiello MV, et al. Effects of a yearlong moderate-intensity exercise and a stretching intervention on sleep quality in postmenopausal women. Sleep. 2003;26(7):830-836. http://doi.org/10.1093/sleep/26.7.830 [ Links ]
26.Hannah K. Knudsen LJD, Paul M. Roman. Job stress and poor sleep quality: Data from an American sample of full-time workers. Social Science & Medicine. 2007;64:1997-2007. Doi: 10.1016 / j.socscimed.2007.02.020 [ Links ]
27. Vaisberg MM, M.T. . Exercício na saúde na doença. Barueri2010. [ Links ]
28.Ebrahim Razmpa KSN, Babak Saedi. Urban Bus Drivers' Sleep Problems and Crash Accidents. Indian Journal of Otolaryngology and Head & Neck Surgery. 2011; 63(3): 269-273. DOI: 10.1007/s12070-011-0235-5 [ Links ]
29. Pinho RS. Uso de estimulantes, queixas do sono e estado de humor em motoristas profissionai de caminhão. Repositório UFC. 2005:7-83. [ Links ]
30.Carvalho JAMM, M. Manual de atividades físicas para prevenção de doenças. Rio de Janeiro: Elsevier; 2012. [ Links ]
31.Lemos LC. Prevalência de queixas de dores osteomusculares em motoristas de caminhão que trabalham em turnos irregulares, Universidade de São Paulo; 2009. [ Links ]
32. Alquimim AF, Barral ABCR, Gomes KC, Rezende MCd. Avaliação dos fatores de risco laborais e físicos para doenças cardiovasculares em motoristas de transporte urbano de ônibus em Montes Claros (MG). Ciência & Saúde Coletiva. 2012; 17: 2151-2158. [ Links ]
33. Rocha VC, Carvalho Z, Araújo M, Marques M. Fatores de risco para acidente vascular encefálico em motoristas de ônibus urbano de Fortaleza-CE. Paper presented at: Anais do VI Congresso Internacional de Cardiologia, 2009. [ Links ]
34.Dwyer GBD, S.E. ACSM's health-related physical fitness assessment manual. Pennsylvania, 2006. [ Links ]
35.Rocha VC CZ, Araújo MFM, Marques MB. Fatores de risco para acidente vascular encefálico em motoristas de ônibus urbano de Fortaleza-CE. In. Anais do VI Congresso Internacional de Cardiologia. Fortaleza-CE2009: 1-3. [ Links ]
36.Hirata RP, Cerra JC, Macedo CR, et al. Prevalência de obesidade e hipertensão arterial em uma população de motoristas profissionais rodoviários interestaduais de ônibus. ConScientiae Saúde. 2011; 10(3): 494-499. DOI: 10.5585/conssaude.v10i3.3046 [ Links ]
37.Hirata PR. Prevalência de obesidade e hipertensão arterial em uma população de motoristas profissionais rodoviários interestaduais de ônibus. ConScientiae Saúde. 2011; 10(3): 494-499. Available from: http://www.redalyc.org/pdf/929/92920013012.pdf [ Links ]
38.Robert J 0 Davies NJA, John R Stradling. Neck circumference and other clinical features in the diagnosis of the obstructive sleep apnoea syndrome. THORAX. 1992; 4(2): 101-105. [ Links ]
39.Akkoyunlu ME. Investigation of obstructive sleep apnoea syndrome prevalence among long-distance drivers from Zonguldak, Turkey. Multidisciplinary Respiratory Medicine. 2013; 8(10): 1-6. [ Links ]
40.Ting H. valuation of Candidate Measures for Home-Based Screening of Sleep Disordered Breathing in Taiwanese Bus Drivers. Sensors. 2014; 14(5): 8126-8149. DOI: 10.3390 / s140508126 [ Links ]
41.Gonnissen HK, Adam TC, Hursel R, Rutters F, Verhoef SP, Westerterp-Plantenga MS. Sleep duration, sleep quality and body weight: parallel developments. Physiology & behavior. 2013; 121: 112-116. [ Links ]
42.Krotkiewski M. Loss of total body potassium during rapid weight loss does not depend on the decrease of potassium concentration in muscles. Different methods to evaluate body composition during a low energy diet. International Journal of Obesity. 2000; 24: 101-107. DOI: doi.org/10.1038/sj.ijo.0801092 [ Links ]
43.Bezerra IMP, Reis AOA, de Melo Monteiro CB, et al. 30 years of the Journal of Human Growth and Development: scientific communication in the several areas of knowledge. Journal of Human Growth and Development. 2020; 30(3): 331-334. DOI: http://doi.org/10.7322/jhgd.v30.11058 [ Links ]
44.de Abreu LC. Integrated actions and strengthening of public health system in Brazil in a time of pandemic. Journal of Human Growth and Development. 2020; 30(1): 05-08. DOI: https://doi.org/10.7322/jhgd.v30.9980 [ Links ]
 Correspondence:
Maura Bianca Barbary de Deus
maurodedeus@outlook.com
Manuscript received: november 2020
Manuscript accepted: april 2021
Version of record online: january 2022

