


Services on Demand
article
 text in
  English (pdf)
 Article in xml format
 Article references
Indicators

Share

 Permalink
Journal of Human Growth and Development
Print version ISSN 0104-1282On-line version ISSN 2175-3598
J. Hum. Growth Dev. vol.32 no.1 Santo André Jan./Apr. 2022
http://dx.doi.org/10.36311/jhgd.v32.11542
ORIGINAL ARTICLE
doi: 10.36311/jhgd.v32.11542
Establishing a normative table for classifying body fat percentage in adolescents
Regiane de Paula SenaI; Isabella Caroline SantosI, II, III; Fabiano Mendes de OliveiraI, II, III; Fábio Ricardo AcencioII, III; Carina Bertoldi FrancoI, II, IV; Braulio Henrique Magnani BrancoI, II, III, IV
IResearch Group in Physical Education, Physiotherapy, Sports, Nutrition and Performance of the University Center of Maringa (GEFFEND/UniCesumar), Maringa, Brazil
IIInterdisciplinary Laboratory for Intervention in Health Promotion (LIIPS/UniCesumar), Maringa, Brazil
IIIPostgraduate Program in Health Promotion (PPGPS/UniCesumar), Maringa, Brazil
IVThe Medical school of UniCesumar, Maringa, Brazil
ABSTRACT
BACKGROUNG: The World Health Organization (WHO) recommends the use of the body mass index (BMI) as a cost-effective method to assess the nutritional status at the population level. The increase of BMI is linked to a higher risk of other chronic non-communicable diseases (NCDs), particularly hypertension, type 2 diabetes mellitus (T2DM), dyslipidemias, and some types of cancer. The prevalence of obesity has increased worldwide, and this condition has dramatically affected children and adolescents. Obesity at a young age increases the chances of severe obesity and its complications in adults
OBJECTIVE: This study aimed to establish cut-off points for body fat percentage in male and female adolescents aged 16 to 18 years using bioelectrical impedance (InBody 570®
METHODS: Gender specific tables were proposed based on the percentiles 3, 5, 10, 15, 25, 50, 75, 85, 95 and 97. A total of 546 adolescents were included
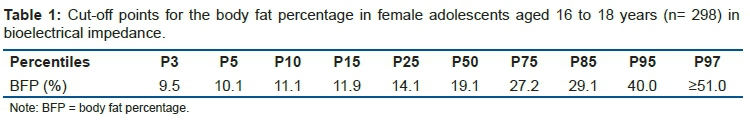
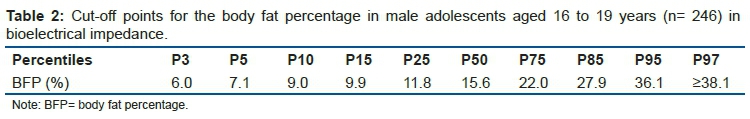
RESULTS: The body fat percentage cut-off points for the male group were: P3 = 6.0-7.0%; P5 = 7.1-8.9%; P10 = 9.0-9.8%; P15 = 9.9-11.7%; P25 = 11.8-15.5%; P50 = 15.6-21.9%; P75 = 22.0-27.8%; P85 = 27.9-36.0%; P95 = 36.1-38.0% and P97 ≥ 38.1%. For females, the cut-off points were: P3 = 9.5-10.0%; P5 = 10.1-11.0%; P10 = 11.1-11.8%; P15 = 11.9-14.0%; P25 = 14.1-19.0%; P50 = 19.1-27.1%; P75 = 27.2-29.0%; P85 = 29.1-39.9%; P95 = 40.0-51.0% and P97 ≥ 51.0%
CONCLUSION: The establishment of cut-off points for body fat percentage may improve the clinical assessment and management of overweight and obese adolescents
Keywords: adiposity, adolescent health, body composition, body mass index, bioelectrical impedance.
Authors summary
Why was this study done?
The researchers identified specific cut-off points for body fat percentage using percentiles 3, 5, 10, 15, 25, 50, 75, 85, 95, and 97 in male and female Brazilian adolescents. Besides that, the researchers identified moderate, strong, and very strong correlations among body mass index, body fat percentage, fat mass, neck circumference, and waist circumference in female and male Brazilian adolescents.
What did the researchers do and find?
The researchers identified specific cut-off points for body fat percentage using percentiles 3, 5, 10, 15, 25, 50, 75, 85, 95, and 97 in male and female Brazilian adolescents. Besides that, the researchers identified moderate, strong, and very strong correlations among body mass index, body fat percentage, fat mass, neck circumference, and waist circumference in female and male Brazilian adolescents.
What do these findings mean?
These findings could help medical doctors, nutritionists, physiologists, and other health professionals manage overweight and obesity with body composition parameters (e.g., body fat percentage) and not only anthropometrical measures, such as body mass index.
INTRODUCTION
The World Health Organization (WHO) recommends the use of the body mass index (BMI) as a cost-effective method to assess the nutritional status at the population level1. The increase of BMI is linked to a higher risk of other chronic non-communicable diseases (NCDs), particularly hypertension, type 2 diabetes mellitus (T2DM), dyslipidemias, and some types of cancer2. The prevalence of obesity has increased worldwide, and this condition has dramatically affected children and adolescents3,4. Obesity at a young age increases the chances of severe obesity and its complications in adults5. Therefore, health promotion actions to improve the population's quality of life and promote healthy longevity are desirable and inevitable.
Despite the epidemics, following the authors' knowledge, there is no international consensus on the cut-off point of body fat percentage (BFP) for Brazilian adolescents. Also, BMI contains significant flaws at the individual level because it cannot identify body composition5. For instance, BMI can only evaluate the effects of combined physical activity and dietary intervention programs6,7. The application of physical activity, especially resistance exercises, promotes an increase in musculoskeletal mass (MME) and a reduction of the body fat mass (FM) without significant changes in the BMI7. The consequent decrease in BFP can improve health parameters in overweight or obese adolescents independent of the BMI6,7. Hence, BMI can be considered a non-specific method to assess the changes induced by a resistance training program.
The success of an obesity treatment program in adolescents can be evaluated by assessing the improvement of cardiorespiratory fitness, reduction of FM, reduction of BMI z-score, improvement of health-related quality of life scores (inferred from the HRQoL questionnaire), increased lean mass (LM) and reduced waist circumference (WC)4. The World Health Organization8 and the Brazilian Association for the Study of Obesity and Metabolic Syndrome9 suggest that the percentiles and the BMI z-score are the leading indicators of the nutritional status of children and adolescents. On the other hand, Cole et al.10,11 presented specific cut-off points for healthy status classification based on children and adolescents' BMI. Neither measurement take into consideration the BFP and may misclassify some individuals.
Hence, a study that included percentiles for the BFP in adolescents of both genders could inform the health professionals involved in adolescents' nutritional assessment. Since most methods used in professional practice are double indirect methods, e.g., skinfold thickness, bioelectrical impedance analysis (BIA), and others; because of this, the construction of a normative table with data from BIA that has high reproducibility may improve the nutritional assessment of young people in the clinical practicing2. Thus, the present study aimed to develop a normative table for the classification of BFP in adolescents.
METHODS
Participants
This study shows a cross-sectional and observational design. We included 546 adolescents aged 16 years until 18 years and 11 months (16 years, n= 75; 17 years, n= 75; 18 years, n= 148, totaling 298 female adolescents) and (16 years, n= 62; 17 years, n= 61; 18 years, n= 123, totaling 246 male adolescents). As an inclusion criterion was accepted: (1) adolescents between 16-18 years old; (2) residents in metropolitan Maringa's region and (3) municipal or state students of Maringa city. As an exclusion criteria: (1) adolescent athletes; (2) female adolescents menstruated; (3) pregnant adolescents; (4) enrolled adolescents in private schools; (5) adolescents that lived outside of metropolitan Maringa's region, and (6) wheelchair users, people with quadriplegia, patients with musculoskeletal diseases, and degenerative diseases, were not accepted in this study. As for nutritional status, the female sample showed 65% within the normal BMI standard, 23% overweight, and 7% obese. Of the males, 68% were within the normal BMI standard, 24% were overweight, and 8% were obese. The research followed all the recommendations proposed in resolution 466/2012 of the Ministry of Health and the Declaration of Helsinki. Informed written consent was obtained from all parents and adolescents. This study was approved by the Ethics and Research Committee of the local committee under number 2,505.200/2018.
Data collection
The data collection occurred between March/2019 until September/2019 and was performed in three public schools of Maringa/PR. Firstly, the school's direction was contacted. After the contact, the parents or guardians and the adolescents were informed about the present study's objectives. Medical clearance was performed with an interview with personal and family history, pre-existing diseases, physical activity level, and general health conditions. Subsequently, the adolescents received a folder with information about pubertal development and BIA protocol. Twenty-four hours after, the adolescents performed anthropometric and body composition analyses.
Anthropometry
Stature was measured using a wall stadiometer (Standard ES2030, Sao Paulo, Brazil), with a measuring field of 2.20 meters. The adolescent stood with the heels together for the measurement, the spine aligned, and the heels, buttocks, shoulders, and head against the wall aligned to the Frankfurt plane [12]. Body weight was measured using the tetrapolar bioelectrical impedance (BIA) of eight tactile points (model 570, In Body, Seoul, Korea). The adolescent was instructed to remain barefoot, loading body weight equally on both feet and wearing light clothes for weighing, such as shorts and a t-shirt. BMI was calculated by dividing body weight in kilograms by stature in meters squared, according to WHO [1]. Neck circumference (NC) and WC were measured following Heyward's [13] indications. It was used BFP, FM, and BMI of BIA results. All adolescents and guardians were informed about the necessary procedures for the assessment of body composition mean by BIA: (a) fasting for 4 hours, without consuming any solid or liquid food; (b) evacuation before the measurement; (c) not practicing moderate or vigorous physical activity 24 hours before the measurement; (d) not taking diuretic drugs seven days before the measurement; (e) not ingesting caffeine 24 hours before the measurement; (f) not having a pacemaker installed, (g) menstruating female adolescents were invited to evaluate after their menstrual period and (h) pregnant adolescents were excluded from the present study [2].
Tanner stage
The Tanner stage was applied to identify male and female adolescents' pubertal levels. This scale is divided into five classifications, following pubertal development14. The adolescents carried out a folder with photos of pubertal development, and in subsequent days, they informed the researchers about their respective pubertal stages.
Statistical analysis
After the data tabulation, the percentiles were calculated: P3, P5, P10, P15, P25, P50, P75, P85, P95, and P97. The WHO's adapted cut-off points12 were used to classify percentiles in adolescents, and a previous proposal for the classification of BFP was elaborated by Branco et al.2. The participants were included in the statistical analysis and separated by age and sex, according to Cintra et al.15. Besides, the data normality was tested utilizing the Kolmogorov-Smirnov test. After normality confirmation, the BMI, FM, BFP, NC, and WC were correlated using the Pearson correlation, assuming a p ≤ 0.05. The correlations were classified: 0.00-0.10 [negligible correlation]; >0.10 to ≤0.39 [weak correlation]; ≥0.40 to ≤0.69 [moderate correlation]; ≥0.70 to ≤0.89 [strong correlation] and ≥0.90 to 1.00 [very strong correlation]; conforming Schober et al.16. All analyses were performed in the Statistica 12.0 software (TIBCO, Palo Alto, CA, USA).
RESULTS
75% of female adolescents were classified in the fifth stage, and 25% were in the fourth stage of pubertal development. 68% of male adolescents were classified in the fifth stage, and 32% were in the fourth stage of pubertal development. Table 1 shows the cut-off points for the BFP in female adolescents aged 16 to 18 years old (n= 298) in bioelectrical impedance.
Table 2 shows the cut-off points for BFP in male adolescents aged 16 to 18 years old (n= 246) in bioelectrical impedance.
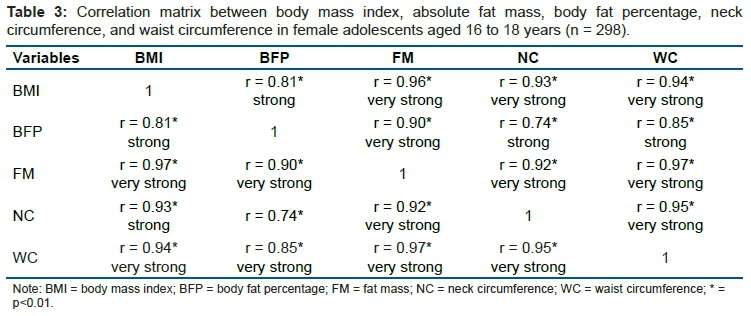
Table 3 shows the correlation matrix between BMI, absolute fat mass, BFP, neck circumference, and waist circumference in female (n = 298) adolescents aged 16 to 18 years old.
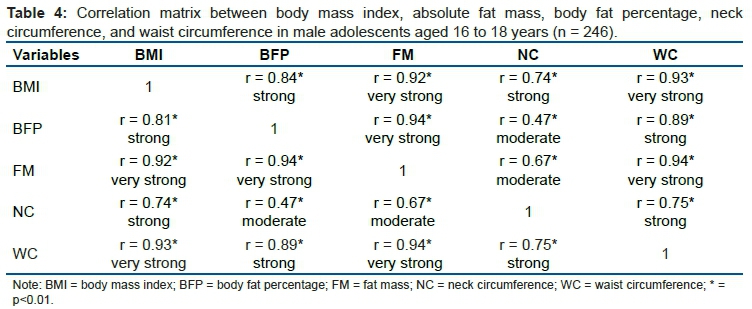
Table 4 shows the correlation matrix between BMI, absolute fat mass, BFP, neck circumference, and waist circumference in male (n = 246) adolescents aged 16 to 18 years old.
DISCUSSION
Given the need to determine cut-off points for the BFP classification in male and female adolescents between 16 and 18 years old, the BIA was used with the proposition of 10 cut-off points based on percentiles already used in previous studies with adolescents15 and adults2. According to the authors ' knowledge, the applicability of establishing cut-off points via BIA is highly relevant since the literature is still silent concerning the application of cut-off points for the classification of BFP in male and female adolescents in the age range in question2. The cut-off points denote values from the 3rd percentile, representing low values, to the 97th percentile, indicating too high. In this regard, the BFP classification proposal is recommended for both sedentary and physically active adolescents. In the sample used, adolescent athletes were not included.
BMI has been used worldwide to classify nutritional status to identify possible health risks for adolescents14 since obesity is associated with a higher risk of T2DM, dyslipidemias, and hypertension17. However, Nuttal5 concludes that BMI is a low indicator for quantifying BFP as BMI does not distinguish body composition in different human body regions. Therefore, on individual analysis, BFP has been advocated to reduce the diagnosis of false positives and negatives since BMI can over or underestimate the BFP in some cases. To minimize eventual diagnostic errors, we recommend using different anthropometric indexes to verify general and central obesity in adolescents since the correlations observed presented a strong correlation between BFP and BMI, FM, NC, and WC in female and male adolescents. This condition suggests that several anthropometric variables are correlated with excessive fatness conditions.
On the other hand, Pelegrini et al.18 point out that BMI, waist-to-height ratio (WHR), and WC can be good anthropometric indicators for quantifying obesity in adolescents. However, the same authors argue that body composition assessment through skinfolds is more accurate than anthropometric measurements. One must remember that skinfolds' significant limitation is that this method depends on evaluator training to provide precise measurements19. In general, BIA seems to be a relevant tool since the standardization necessary to assess the body composition precisely requires only compliance with the protocol2,13.
The BMI cannot identify significant body composition changes caused by nutritional intervention and physical exercise. This question is particularly evident with resistance exercise programs that increase MME and reduce FM in adolescents6,7. Consequently, neither the body weight nor BMI may show a significant reduction despite the increase in MME and decrease in FM, and considerable decrease of BFP6,7. Thus, BFP is a more accurate method for determining body composition changes than BMI. Most studies that measured BFP in Brazilian adolescents used different ways to evaluate body composition. To our knowledge, this is the only study assessing BFP in this population using BIA. In comparison to other Brazilian studies using skinfolds20 and dual-energy x-ray absorptiometry21, our adolescents have similar BFP at percentile 50th20 but much higher BFP at 87th and 97th. This condition may be explained by the different methodologies and populations included.
The study by Escobar-Cardoso et al.22 aimed to establish cut-off points for BFP in Colombian adolescents measured via BIA (model BF-689, Tanita, Tokyo, Japan). The authors mentioned above have determined the 90th percentile, equivalent to 23.4-28.3% of BFP, as the cardiovascular risk threshold for male children and adolescents. The cut-off value for high cardiovascular risk ranged from 31.0-34.1% for female children and adolescents. In our study, the adolescents' 90th percentile's absolute values were higher, already in the 85th percentile. Such divergences may refer to the sample's equipment used and specific characteristics. Corroborating the points indicated above, the literature points out that the various types of BIA equipment may differ between them, which may be related to the frequencies of the equipment (mono frequential and multifrequency, with some devices, only doing an extracellular reading, while others do both); the readings (i.e., extra, and intracellular) and the number of poles: bipolar or tetrapolar, with 2 to 8 tactile points23-25.
It is also noteworthy that the cut-off points proposed in the study by Branco et al.2 for the BFP classification, with young Brazilian adults, suggested that the 50th percentile is equivalent to the range from overweight to class I obesity. This question reflects the Brazilian government's latest population estimates, which show that more than 50% of the adult Brazilian population is overweight or obese26. In congruence with the Brazilian Institute of Geography and Statistics27, values greater than the 85th percentile and less than the 97th percentile are classified as overweight. In contrast, values above the 97th percentile are categorized as obese for children and adolescents. Therefore, because of the sample that analyzed adolescents within the normal standards for BMI - even those classified as overweight or obese within the percentiles established by the WHO28 - it is identified that overweight and obese states have increased their prevalence the Brazilian population29.
Finally, we consider the strong points in our research: (1) the possibility of classifying female and male adolescents by BFP, not only by BMI classification; (2) the possibility of analyzing BFP behavior during nutritional and physical exercise interventions. Our study has some limitations: (1) our sample does not represent the whole Brazilian population, ethnic mixed, and varies in different regions; (2) we have only included a narrow age range; and (3) we do not have other health parameters to identify the BFP associated with higher metabolic risk, although this point is a lot discussed in the scientific literature2,6-7. Due to the relevance of obesity at a young age in Brazil, we suggest a multicentric study with a similar methodology to establish the BPF cut-off point. The risk of complications related to excessive BFP is increased. The definition of this BPF threshold would significantly improve the health care of children and adolescents and may prevent NCD in the long term.
CONCLUSION
Based on the responses of the present study, the BFP cut-off points differ between female and male adolescents. Medical doctors, nutritionists, physiologists, and other health professionals need to consider the physiological differences. The establishment of cut-off points for body fat percentage may improve the clinical assessment and management of overweight and obese adolescents.
REFERENCES
1.World Health Organization. Preventing and managing the global epidemic. Rep. a WHO Consult. Obesity. Geneva WHO. 1997. [ Links ]
2.Branco BHM, Bernuci MP, Marques DC, Carvalho IZ, Barrero CAL, de Oliveira FM, et al. Proposal of a normative table for body fat percentages of Brazilian young adults through bioimpedanciometry. J Exerc Rehabil. 2018;14:974-9. DOI: 10.12965/jer.1836400.200 [ Links ]
3.Lopera CA, da Silva DF, Bianchini JAA, Locateli JC, Moreira ACT, Dada RP, et al. Effect of water- versus land-based exercise training as a component of a multidisciplinary intervention program for overweight and obese adolescents. Physiol Behav. 2016;165:365-73. DOI: 10.1016/j.physbeh.2016.08.019 [ Links ]
4.Nardo Junior N, Bianchini JAA, da Silva DF, Ferraro ZM, Lopera CA, Antonini VDS. Building a response criterion for pediatric multidisciplinary obesity intervention success based on combined benefits. Eur J Pediatr. European Journal of Pediatrics; 2018;177. DOI: 10.1007/s00431-018-3115-0 [ Links ]
5.Nuttall FQ. Body mass index: Obesity, BMI, and health: A critical review. Nutr Today. 2015;50:117-28. DOI: 10.1097/NT.0000000000000092 [ Links ]
6.Magnani Branco BH, Carvalho IZ, Garcia de Oliveira H, Fanhani AP, Machado dos Santos MC, Pestillo de Oliveira L, et al. Effects of 2 Types of Resistance Training Models on Obese Adolescentsʼ Body Composition, Cardiometabolic Risk, and Physical Fitness. J Strength Cond Res [Internet]. 2020;34(9):2672-2682. DOI: 10.1519/JSC.0000000000002877 [ Links ]
7.Branco BHM, Valladares D, de Oliveira FM, Carvalho IZ, Marques DC, Coelho AA, et al. Effects of the Order of Physical Exercises on Body Composition, Physical Fitness, and Cardiometabolic Risk in Adolescents Participating in an Interdisciplinary Program Focusing on the Treatment of Obesity. Front Physiol [Internet]. 2019;10:1013. DOI: 10.3389/fphys.2019.01013 [ Links ]
8.World Health Organization (WHO). Global Action Plan for the Prevention and Control of NCDs 2013-2020. Glob. Action Plan Prev. Control Noncommunicable Dis. 2013-2020. 2013. [ Links ]
9.Associação Brasileira para o estudo da obesidade e da síndrome metabólica (ABESO). Diretrizes brasileiras de obesidade 2016. VI Diretrizes Bras Obesidade. 2016;7-186. [ Links ]
10.Cole TJ, Bellizzi MC, Flegal KM, Dietz WH. Establishing a standard definition for child overweight and obesity worldwide: International survey. Br Med J. 2000; 320(7244):1240-3. DOI: 10.1136/bmj.320.7244.1240 [ Links ]
11.Cole TJ, Lobstein T. Extended international (IOTF) body mass index cut-offs for thinness, overweight and obesity. Pediatr Obes. 2012;7:284-94. DOI: 10.1111/j.2047-6310.2012.00064.x [ Links ]
12.Norgan NG. A Review of: "Anthropometric Standardization Reference Manual". Edited by Lohman TG, Roche AF and Martorell R. (Champaign, IL.: Human Kinetics Books, 1988). Ergonomics. 1988; 30(10): 1493-1494. DOI: https://doi.org/10.1080/00140138808966796 [ Links ]
13.Heyward V. ASEP Methods recommendation: body composition assessment. J Exerc Physiol. 2001;4:1-12. [ Links ]
14.Emmanuel M, Bokor BR. Tanner Stages [Internet]. StatPearls. 2020. Available from: http://www.ncbi.nlm.nih.gov/pubmed/29262142 [ Links ]
15.Cintra IDP, Passos MAZ, Fisberg M, Machado HC. Evolution of body mass index in two historical series of adolescents. J Pediatr (Rio J). 2007; DOI: 10.1590/S0021-75572007000200010 [ Links ]
16.Schober P, Schwarte LA. Correlation coefficients: Appropriate use and interpretation. Anesth Analg. 2018;126:1763-8. DOI: 10.1213/ANE.0000000000002864 [ Links ]
17.Ho HCH, Maddaloni E, Buzzetti R. Risk factors and predictive biomarkers of early cardiovascular disease in obese youth. Diabetes Metab Res Rev [Internet]. 2019;35:e3134. DOI: 10.1002/dmrr.3134 [ Links ]
18.Pelegrini A, Silva DAS, Silva JMFDL, Grigollo L, Petroski EL. Indicadores antropométricos de obesidade na predição de gordura corporal elevada em adolescentes. Rev Paul Pediatr [Internet]. Associação de Pediatria de São Paulo. 2015;33:56-62. DOI: http://dx.doi.org/10.1016/j.rpped.2014.06.007 [ Links ]
19.Nooyens ACJ, Koppes LLJ, Visscher TLS, Twisk JWR, Kemper HCG, Schuit AJ, et al. Adolescent skinfold thickness is a better predictor of high body fatness in adults than is body mass index: The Amsterdam Growth and Health Longitudinal Study. Am J Clin Nutr. 2007;85:1533-9. DOI: 10.1093/ajcn/85.6.1533 [ Links ]
20.Silva S, Baxter-Jones A, Maia J. Fat Mass Centile Charts for Brazilian Children and Adolescents and the Identification of the Roles of Socioeconomic Status and Physical Fitness on Fat Mass Development. Int J Environ Res Public Health [Internet]. 2016;13:151. DOI: 10.3390/ijerph13020151 [ Links ]
21.Ripka WL, Esmanhoto E, Ulbricht L. Body fat percentage in adolescents from Curitiba-PR metropolitan region: reference data using LMS method. Brazilian J Kinanthropometry Hum Perform [Internet]. 2019;20:373-80. DOI: https://doi.org/10.1590/1980-0037.2018v20n5p373 [ Links ]
22.Escobar-cardozo GD, S B, Correa-bautista JE, Therapist P. Percentiles of body fat measured by bioelectrical impedance in children and adolescents from Bogotá, Colombia: The FUPRECOL Study. Arch Argent Pediatr. 2016;114:135-42. DOI: 10.5546/aap.2016.eng.135 [ Links ]
23.Wang L, Hui SSC. Validity of four commercial bioelectrical impedance scales in measuring body fat among Chinese children and adolescents. Biomed Res Int. 2015;2015. DOI: https://doi.org/10.1155/2015/614858 [ Links ]
24.Montgomery MM, Marttinen RH, Galpin AJ. Comparison of Body Fat Results from 4 Bioelectrical Impedance Analysis Devices vs. Air Displacement Plethysmography in American Adolescent Wrestlers. Int J Kinesiol Sport Sci. 2017;5:18. DOI: http://dx.doi.org/10.7575/aiac.ijkss.v.5n.4p.18 [ Links ]
25.Carrion BM, Wells A, Mayhew JL, Koch AJ. Concordance Among Bioelectrical Impedance Analysis Measures of Percent Body Fat in Athletic Young Adults. Int J Exerc Sci [Internet]. 2019;12:324-31. [ Links ]
26.Brasil, Ministério da Saúde. Vigitel Brasil 2018: Vigilância de fatores de risco e proteção para doenças crônicas por inquérito telefônico. Estatística e Informação em Saúde. 2019. [ Links ]
27.Instituto Brasileiro de Geografia e Estatística (IBGE). Pesquisas de orçamentos familiares 2008-2009: Antropometria e Estado Nutricional de Crianças, Adolescentes e Adultos no Brasil. Rio de Janeiro: IBGE; 2010. [ Links ]
28.World Health Organization. World Health Report 2002 - Reducing Risks, Promoting Healthy Life. World Heal Rep. 2002; [ Links ]
29.Bentham J, Di Cesare M, Bilano V, Bixby H, Zhou B, Stevens GA, et al. Worldwide trends in body-mass index, underweight, overweight, and obesity from 1975 to 2016: a pooled analysis of 2416 population-based measurement studies in 128·9 million children, adolescents, and adults. Lancet. 2017;390:2627-42. DOI: 10.1016/S0140-6736(17)32129-3 [ Links ]
 Correspondence:
Isabella Caroline Santos
isabellacaroline_@hotmail.com
Manuscript received: May 2020
Manuscript accepted: May 2020
Version of record online: January 2022

