Services on Demand
article
Indicators
Share
Revista de Psicología (Lima)
Print version ISSN 0254-9247
Rev. psicol. (Lima) vol.34 no.2 Lima July/Dec. 2016
http://dx.doi.org/10.18800/psico.201602.005
ARTÍCULOS
Psychometric study of the Rational Experiential Inventory among undergraduate Argentinean students
Estudio psicométrico del Rational Experiential Inventory en una muestra de estudiantes argentinos
Estudo psicométrico do Rational Experiential Inventory em uma amostra de estudantes da Argentina
Cecilia Reyna1 y María Victoria Ortiz2
CONICET1, Universidad Nacional de Córdoba, Argentina1,2
1 Researcher at CONICET, Centro de Investigaciones de la Facultad de Psicología (CIPSI), and Centro de Investigaciones y Estudios sobre Cultura y Sociedad (CIECS), at Universidad Nacional de Córdoba (UNC), Argentina. Postal address: Enrique Barros y Enfermera Gordillo, Facultad de Psicología, Ciudad Universitaria. 5000, Córdoba, Argentina. Email: ceciliareyna@gmail.com.
2 BSc in Psychology, Universidad Nacional de Córdoba (UNC), Córdoba, Argentina. Postal address: Enrique Barros y Enfermera Gordillo, Facultad de Psicología, Ciudad Universitaria. 5000, Córdoba, Argentina. Email: ortizmonvictoria@gmail.com.
Resumen
The Rational Experiential Inventory consist of two large scales (rational and experiential), each one with two subscales (ability and engagement). Their psychometric properties have been studied in several countries, but there are no reports in the Latin American context. In this study we analyzed the factor structure and internal consistency of the Rational Experiential Inventory, and assessed the relationships between processing styles and different personality dimensions in a sample of students from Argentina. The results show an underlying two-factor structure with good internal consistency values. Only one significant relationship between experiential style and extraversion was observed. A version with fewer items was attained and, due to its adequate psychometric properties, this instrument may be used in future research studies.
Keywords: Experiential, rational, psychometric properties, personality dimensions.
Abstract
El Rational Experiential Inventory comprende dos grandes escalas (racional y experiencial), cada una con dos subescalas (habilidad y preferencia). Sus propiedades psicométricas han sido estudiadas en varios países, sin existir, según nuestro conocimiento, estudios en el contexto Latinoamericano. En este estudio analizamos la estructura factorial y consistencia interna del Rational Experiential Inventory y evaluamos las relaciones entre los modos de procesamiento y distintas dimensiones de la personalidad en una muestra de estudiantes de Argentina. Los resultados muestran una estructura subyacente de dos factores, con buenos valores de consistencia interna. Solo se observó una relación positiva entre el modo experiencial y extroversión. Se obtuvo una versión con menor cantidad de ítems con adecuadas propiedades psicométricas para ser utilizada en contextos de investigación.
Palabras clave: racional, experiencial, propiedades psicométricas, dimensiones de la personalidad.
Resumo
O Rational Experential Inventory inclui dois grandes escalas (racional e experiencial), cada uma com duas subescalas (de habilidade e de preferência). Suas propriedades psicométricas têm sido estudadas em vários países, sem existir, segundo nosso conhecimento, estudos no contexto latinoamericano. Neste estudo analisamos a estrutura fatorial e consistência interna do Rational Experential Inventory e avaliamos as relações entre os modos de processamento e diferentes dimensões da personalidade em uma amostra de estudantes da Argentina. Os resultados mostram uma estrutura subjacente de dois fatores, com valores adequados de consistência interna. Foi observada apenas uma relação positiva entre o modo experiencial e extroversão. Obteve-se uma versão com menos itens com propriedades psicométricas adequadas para uso em ambientes de pesquisa.
Palavras-chave: racional, experiencial, propriedades psicométricas, dimensões de personalidade.
Each individual processes the ongoing information received from the surrounding environment on a particular way. Understanding how people process information allows a better prediction of their behavior (Björklund & Bäckstrom, 2008). Researchers have relied on dual processing theories to explain individual differences in the way people process information. According to Evans (2008), there are different models on the dual processes: a) models that assume a clear distinction between the two types of processes and the prevailing role of one of them depending on certain variables; b) models that assume a parallel activation of both processes; and c) models that assume that automated processes are always activated first. However, there is an agreement on some general properties: analytical processing (rational) is related to awareness and controlled application of rules, while intuitive processing (experiential) operates automatically, without conscious control (Glöckner & Witteman, 2010).
This study retakes Cognitive-Experiential Self Theory (CEST, Epstein, 1994), basal theory of Rational-Experiential Inventory (REI, Epstein, Pacini, Denes-Raj, & Heier, 1996) which is the main focus of this work. This theory suggests that there are two different systems to process information, one of them rational and the other, experiential. The first one operates on a conscious level and is characterized as intentional, analytical, mainly verbal, relatively slow and free of emotion. The second involves a learning system; it is preconscious, fast, automated, holistic, non-verbal and is closely related to emotion. In addition, the latter has a longer evolutionary history than the former. According to this theory, the two systems operate independently, in a parallel, interactive way. Individuals are able to interpret the world through the simultaneous use of these two systems and both of them contribute to behavior. However, one information processing mode prevails on the other when making decisions. Pacini and Epstein (1999) have shown that individuals differ in terms of their preferences for either of these two systems.
As mentioned above, these dimensions are retrieved by the Rational-Experiential Inventory (Epstein et al., 1996). This inventory originally consisted of 31 items with 5-point Likert (completely untrue completely true) format. It involved 19 items for analytical-rational dimension of Need for Cognition Scale (NFC, Cacioppo & Petty, 1982).Meanwhile, due to the lack of a scale measuring the intuitive-experiential dimension, the authors created a pool of items grouped in dimension Faith in Intuition (FI). Correlation analysis indicated that the scales were not significantly related, a fact that shows that both processing modes are independent. Among the weaknesses of this version, Pacini and Epstein (1999) have pointed out that the NFC scale showed higher reliability (.87) than the FI (77); in addition, the valence of the items was not balanced, since 14 of the 19 items of the scale NFC were written in the negative, while all items of FI were written positively. In a second study with university students, mainly because of limitations of time and space, Epstein et al. (1996) used an abbreviated version of the inventory consisting of 10 items, with results similar to those found with the inventory of 31 items.
Subsequently, Pacini and Epstein (1999) produced a new version of the inventory, taking into account that most of the items of the NFC scale described the "preference" for a cognitive activity, while most of the items of the FI scale referred to the "ability" to enforce intuitive judgments. As a result, they decided to create a balanced scale with two subscales for the rational scale, and two subscales for the experiential scale, in order to cover both the preference (favorability or engagement) and the ability (ability). Unlike the previous inventory, each subscale was represented by the same number of items. The final version was composed of 40 items, with the same response format as the original scale. The Rational dimension (20 items) comprises the subscales Rational Ability (10 items), which refers to a higher level of ability to think logically and analytically, and Rational Engagement (10 items) related to enjoying thinking logically and analytically. Furthermore, the Experientiality dimension (20 items) comprises the subscales Experiential Ability (10 items), defined as the ability to report their own intuitive impressions and feelings, and Experiential Engagement, based on the joy of making decisions depending on intuitions and feelings (10 items).
The psychometric properties of the inventory have been studied at different latitudes (e.g., United States, Sweden, Australia, Spain and the UK), using mainly samples of university students. Regarding the structural soundness, exploratory analyzes support the independence of two factors, one rational and the other, experiential. In general, in order to explore the underlying structure, Principal Components analysis with varimax rotation has been used. In the analysis of the original scale, Pacini and Epstein (1999) have found a solution of two factors indicating that the first factor contains items related to rational processing, and the second factor includes items related to experiential processing. The authors found that both factors are independent and orthogonal, explaining 19.4% and 14.6% of the total variance respectively. In addition, they performed factor analyses with the items in each dimension separately. They found that the rational items loaded on two factors, one based on ability and the other on preference. Instead, experiential items loaded on two factors that differ in the form of writing, positive and negative. Other studies have also found that two components account for about 33% of the total variance together (Björklund & Backstrom, 2008; Witteman, van den Bercken, Claes, & Godoy, 2009). However, Björklund and Backstrom (2008), when examining the four-factor solution did not find the expected structure of two sub-dimensions (skill and preference) in the rational and experiential dimensions.
On the other hand, some authors have observed that the three-factor solution is the one that best represents underlying structure: a rational factor explaining 16.09% of variance and two experiential factors explaining 15.16% and 6.31% of the variance (Hodgkinson, Sadler-Smith, Sinclair, & Ashkanasy, 2009). In contrast to the original study, they did not force a solution of two factors in rational items, and they found no distinction between ability and preference; meanwhile, they found the same results as Pacini and Epstein (1999) in the experiential factor, that is, polarity between positive and negative items. In exploratory studies with samples of Swedish students, it was found that one of the items ("Learning new ways to think would be very appealing to me") did not load on any of the factors, while another ("My Snap Judgments are probably not as good as most people’s") scored higher in the rational factor (Björklund & Backstrom, 2008).
In confirmatory factor analysis of the structure of the inventory the maximum likelihood method has been used. Witteman et al. (2009) reported a satisfactory fit of the model comprising two related factors (RMSEA = .07 (90% IC = .064, .068), NFI = .77, SMR = .054, GFI =.83). Of 20 rational items, 19 items showed a factor loading higher than .40, and 19 of 20 experiential items showed a factor loading between .37 and .69. Björklund and Bäckstrom (2008) evaluated different confirmatory models. The first model included four factors correlated in pairs, an experiential factor and a rational factor. Although the fit was good, it was not perfect (RMSEA = .070, GFI = .84, CFI = .94). This model provided a better fit than a second model with two orthogonal factors (RMSEA = .109, GFI = .78, CFI = .90, ∆χ2(2) = 141.00, p <.001). Furthermore, on the basis of these two models, researchers assessed structures where factors were independent, but the fit did not improve. Finally, they evaluated the first model again, considering the modification indexes and they obtained a better fit of the data to the proposed theoretical model (RMSEA = .048, GFI = .89, CFI = .97).
Regarding internal consistency, several studies have shown evidence of acceptable results. Some Values Cronbach’ alpha reported to different scales are the following: Rational = .86 to .90, Rational Ability = .81 to .83, Rational Engagement = .78 to .82; Experiential = .79 to .91, Experiential Ability = .79, and Experiential Engagement = .74 to .84 (Björklund & Bäckstrom, 2008; Hodgkinson et al., 2009; Marks, Hine, Blore, & Phillips, 2008; Sladek, Bond, & Phillips, 2010; Witteman et al., 2009).
Processing modes or styles have been related to personality factors. In several studies it has been observed that the rational mode is associated with low neuroticism, high self-esteem, openness to new ideas or experiences, awareness and a sense of control and direction in life; meanwhile the experiential mode is associated with a preference for relationships, openness, trust and emotional expressiveness (Björklund & Backstrom, 2008; Pacini & Epstein, 1999). Also, Witteman et al. (2009) assessed the relation between processing modes and personality factors comparing samples of American, German and Spanish students. The authors found that the rational mode was associated with higher scores on awareness and openness, and low neuroticism or stability in US and German samples, with extroversion in the American sample, and with agreeableness in the German sample. While the experiential mode was associated with agreeableness and openness in the German sample, in the US sample it was related to all dimensions except neuroticism. In general, similar relations were observed in the German and Spanish samples.
Based on the above, this study aims at analyzing the psychometric properties of the Rational Experiential Inventory in a sample of students from the city of Cordoba, Argentina. Specifically, we set out to analyze the factorial structure through exploratory and confirmatory models, as well as to obtain evidence of reliability in terms of internal consistency. In addition, we evaluated the relations between processing modes and different facets of personality.
Method
Participant
395 undergraduate students, age range18-31(M = 21.32, SD = 2.58), 65.6% women and 28.9% men participated in the study. 22 participants did not complete this questionnaire. A self-selected sampling method was used, people decided on participating or not in the research (Sterba & Foster, 2008). Participants were enrolled in different courses at the National University of Cordoba, with a major proportion of Psychology students (79%). Participants received oral and written information about the study objectives information. It was emphasized that participation was voluntary and that the data would be managed under strict conditions of anonymity and confidentiality.
Measures. The Rational Experiential Inventory proposed by Pacini and Epstein (1999) was used. The inventory includes 40 items that are scored on a 5-point Likert scale (1 = totally false, 5 = totally true). The items are grouped into two large dimensions: rational and experiential, which in turn comprise two sub-dimensions: preference and ability. As stated in the introduction, the instrument showed good levels of reliability, while the evidence on the underlying dimensionality is not entirely conclusive (Björklund & Backstrom, 2008, Hodgkinson et al., 2009; Pacini & Epstein, 1999; Witteman et al., 2009). The English version of the scale was translated into Spanish according to the process of direct translation (Muñiz, Elosua, & Hambleton, 2013). Also, in a pilot study with a sample of 5 participants we evaluated cultural adequacy and semantic clarity; and grammatical aspects of the items and of the instructions were reviewed. On that basis, the version that was used to conduct this research was defined. The IPIP-FFM personality questionnaire was also used (Gross, Zalazar-Jaime, Piccolo, & Cupani, 2012), which consists of 50 items related to typical behavior of people, grouped into five major personality factors: extraversion, agreeableness, conscientiousness, neuroticism and openness to experience. The items are scored on a 5-point Likert scale (1 = strongly disagree with this description of myself; 5 = strongly agree with this description of myself). The authors report a structure of five factors and Cronbach’s alpha coefficients between .75 and .86, also showing predictive validity for recreational activities.
In addition, information on socio-demographic data was collected through a questionnaire prepared ad-hoc.
Procedure. Participants were invited to participate in a series of experiments which the research team were carrying-out. Students completed the questionnaires individually at the end of the experimental session, before completing socio-demographic data and other tasks to prevent performance in the experiments could affect the responses in the REI. It was explained that there were no right or wrong answers. Participation was voluntary, the data confidentiality and anonymity of responses was assured, explaining that the results would be used only for research purposes. Data collection was conducted by trained researchers and research assistants previously were trained in homogeneous administration criteria.
Data analysis. First, we conducted descriptive analysis of cases and variables. Values Z ± 3.29 were considered univariate outliers, and multivariate outliers at a level p < .001 (Tabachnick & Fidell, 2007). Values of skewness and kurtosis in rank ± 1 were considered excellent, and in the rank ± 1.5 were considered acceptable (George & Mallery, 2001).
Second, the sampling was randomly divided in two halves. One half was used for exploratory analysis, and the other one was used to carry-out a confirmatory factor analysis and to evaluate internal consistency. In the exploratory factor analysis the principal axis method was employed. Meanwhile, in the confirmatory factor analysis a maximum likelihood method was used. In order to assess the fit of the model we considered several indexes: c2, ration between c2 and degree of freedom (Kline, 1998) = values lower to 3 indicate a good fit; standardized root mean square residual (SRMR, Hu & Bentler, 1999) = values near to .08 are considered acceptable, and values lower than .05 indicate a very good fit; Tucker-Lewis Index (TLI, Tucker & Lewis, 1973) and comparative fit index (CFI, Bentler, 1990) = values below .90 indicate the need to respecify the model, and above .95 indicate a good fit; root mean square error of approximation (RMSEA, Steiger, 1990) = values below .05 indicate a good fit, and between .05 and .08 that the fit is acceptable. Also, standardized regression coefficients were interpreted. Subsequently, the internal consistency was estimated using Cronbach’s alpha coefficient. Data were analyzed with the statistical program SPSS 20 and AMOS 20.
Results
Preliminary analysis of cases and variables
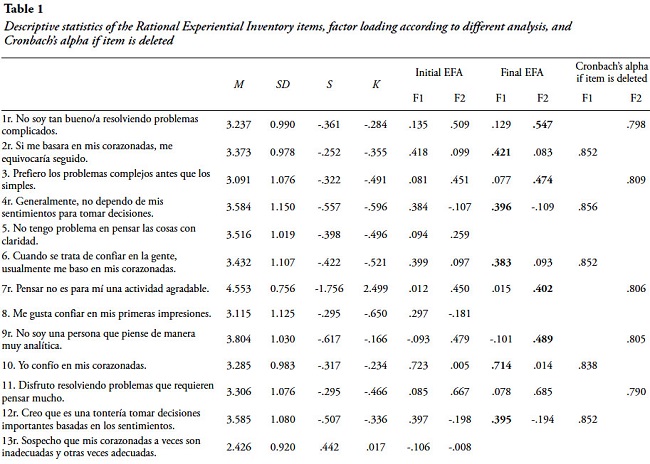
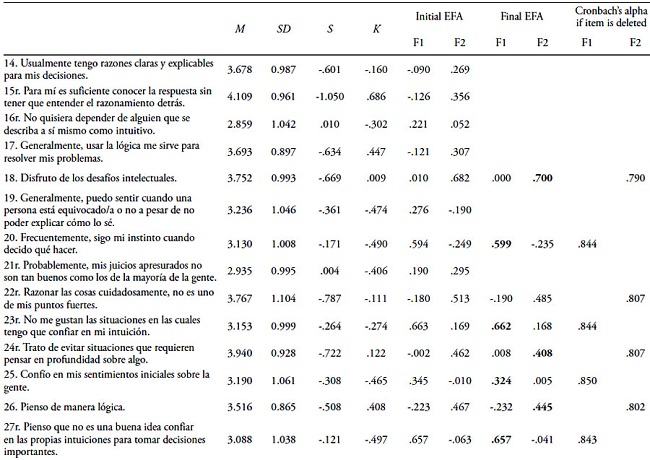
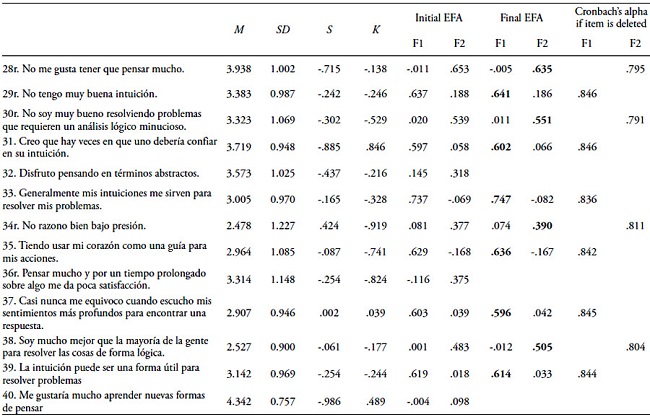
Analysis evidenced that any variable presented more than 5% of missing data. Of 395 cases, 58 had missing data in one or more items, 41 cases in only one item, 14 cases in 2 items, two cases in three items, and one case in 7 items. We chose to replace those data by mean values, and to check the effect of such replacement in later analysis. 9 cases resulted univariate outliers, while anyone (?) (everyone?) was multiple outlier. We decide to eliminate those 9 cases; hence the sample for fur-ther analysis comprised 386 participants. Regarding skewedness and kurtosis, acceptable values were observed (Table 1).
Exploratory factor analysis
Before exploring the subjacent structure, the sample was randomly divided in two halves. A-sample (n = 193) was used to the exploratory factor analysis (EFA) and the B-sample (n = 193) to the confirmatory factor analysis (CFA).
In the EFA, the index of sampling adequacy KMO was equal to .771, while the Bartlett’ sphericity test was significant (c2 aprox. (780, n = 193) = 2652.499, p < .000). The screenplot suggested the existence of two or three factors. Based on that, we re-analyze the data extracting two or three factors. In both cases, correlated factors were allowed, but due to low correlations varimax 25.06% of variance. In the rotated factor solution, it was observed that 12 items showed factor loadings lower than .40 (Table 1), so we decided to eliminate them and to re-evaluate the model with 28 items. In this case, the KMO was equal to .808. Factor 1 comprised 15 items related to the experiential style and explained 18.15% of the variance; while Factor 2 included 13 items of the rational style and explained 13.65% of the variance. Almost all items presented factor loading higher than .40. Four items presented factor loadings between .30 and .40 in one of the factors, and a difference higher than .10 in relation to the other factor (Table 1).
Confirmatory factor analysis
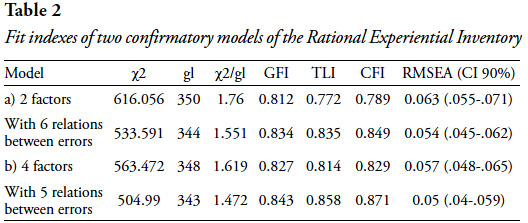
The 28 items used at the final EFA were used in confirmatory models. We evaluated two models: a) a model with two non-related factors: rational and experiential; and b) a model with four factors: rational-engagement and rational-ability (related between themselves), and experiential-engagement and experiential-ability (related to each other). Taking into account modification indexes and expected change values of the parameter provided by the software used, error correlations were allowed if items pertained to the same subjacent factor. As noted in Table 2, the fit of both models was similar. In both models, standardized coefficients were .24 to .78. In the model with two factors, item 4 ("Generally, I do not depend on my feelings to make decisions") presented a factor loading of .24, and item 3 of .34 ("I prefer complex than easy problems"). In the model of four factors, item 4 presented a factor loading of .29 and item 24 of .30 ("I try to avoid situations which demand thinking profoundly on something"). In both models, other items presented factor loadings higher than .35.
Reliability analysis
With the sample of 386 participants internal consistency was assessed. For factor 1 (experiential) the Cronbach’s alpha was equal to .855, whereas for factor 2 (rational) it was equal to .814. The obtained values are considered an evidence of good internal consistency.
In the Table 1 the value of the coefficient if each item is deleted can be observed.
Relations between the REI dimensions and personality traits
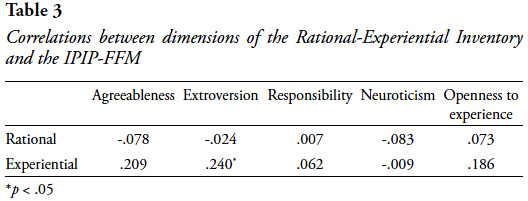
We evaluated the relations between the REI dimensions (Rational y Experiential) and personality traits (extroversion, agreeableness, responsibility, neuroticism, and openness to experience). As it can be appreciated in Table 3, only the relation between Experiential processing and Extroversion was statistically significant (r = .24, p < .036), a higher score in the experiential processing mode was associated to a higher score in extroversion.
Discussion
The purpose of this research was to evaluate the psychometric properties of the Rational Experiential Inventory (Pacini & Epstein, 1999) in a sample of university students from Cordoba, Argentina. We studied the factor structure through exploratory and confirmatory models, and analyzed internal consistence. In general, the evidence indicates that the inventory has good psychometric properties. In the following section, we will discuss the main results:
The exploratory factor analysis suggested the existence of two factors, one comprising items of the experiential processing mode and the other including items of the rational processing mode. The first factor explained 18.15% of the variance, while the second one explained 13.65%. These percentages are low, although they are similar to those obtained in other studies of the inventory (Björklund & Bäckstrom, 2008; Pacini & Epstein, 1999; Witteman et al., 2009). Of the 40 original items, only 28 were retained, with factor loadings superior to .35 (exception item 25 "I trust my initial impressions about people" which presented a load of .32). Hence, after that analysis, a shorter version was obtained. Possible reasons for the low factor loading of deleted items are cultural differences. It is worth remembering that the instrument under analysis was developed in an American context and the sampling of this study is Latin American. As for the confirmatory analysis, while the models showed acceptable fit according to some indicators, no clear evidence was obtained for models of two or four dimensions (Björklund & Backstrom, 2008; Witteman et al., 2009). In exploratory analyzes we also evaluated a three factor structure, as Hodgkinson et al. (2009) observed, but the structure resulted not easy to interpret, so this model was not assessed in confirmatory models.
Regarding internal consistency, good Cronbach’s alpha values for both experiential and rational dimension was obtained. That is consistent with studies conducted with samples from other latitudes (Björklund & Backstrom, 2008; Hodgkinson et al., 2009; Marks et al., 2008; Sladek et al., 2010; Witteman et al., 2009).
In this study we also aim at assessing the relation of the dimensions of REI with the facets of personality identified by the IPIP-FFM. Such as other researchers had observed, a positive relation between the experiential mode and extroversion was found, although some other significant relations could be observed (Björklund & Backstrom, 2008; Pacini & Epstein, 1999). The differences observed are mainly attributed to cultural characteristics. However, it is important to remark that IPIP-FFM was used to assess personality traits in this research, whereas in the other studies mentioned here, researchers used the following instruments: NEO Five Factor Inventory, Quick Big Five (QBF), NEO Personality Inventory and Berkeley Expressivity Questionnaire (BEQ).
Considering the results of this work, future lines of action are suggested. While the purpose of this research was to evaluate the psychometric properties of a constructed instrument, it would be good to have a further study to generate new (or reformulated) items in our context. It would also be of interest to have an evidence of other types of validity, in particular, external validity, in order to assess the relation between dispositional measures and performance on tasks of decision making (Björklund & Backstrom, 2008). Likewise, having evidence about the styles of information processing in the general population, as well as in specific populations, will contribute to the understanding of this construct. Although we did not initially set out to have an abbreviated version of the inventory, analyses carried-out generated a version with fewer items and with acceptable psychometric properties for use in research settings with university population. It is expected to have further studies to provide evidence of other types of validity and reliability.
References
Bentler, P. M. (1990). Comparative fit indexes in structural models. Psychological Bulletin, 107, 238-246. http://dx.doi.org/10.1037/0033-2909.107.2.238. [ Links ]
Björklund, F., & Bäckström, M. (2008). Individual differences in processing styles: validity of the Rational–Experiential Inventory. Scandinavian Journal of Psychology, 49, 439-446. http://dx.doi.org/10.1111/j.1467-9450.2008.00652.x. [ Links ]
Cacioppo, J. T. & Petty, R. E. (1982). The need for cognition. Journal of Personality and Social Psychology, 42(1), 116-131. http://dx.doi.org/10.1037/0022-3514.42.1.116. [ Links ]
Epstein, S. (1994). Integration of the cognitive and the psychodynamic unconscious. American Psychologist, 49(8), 709-724. http://dx.doi.org/10.1037/0003-066X.49.8.709. [ Links ]
Epstein, S., Pacini, R., Denes-Raj, V. & Heier, H. (1996). Individual differences in intuitive–experiential and analytical–rational thinking styles. Journal of Personality and Social Psychology, 71(2), 390-405. http://dx.doi.org/10.1037/0022-3514.71.2.390. [ Links ]
Evans, J. S. B. (2008). Dual-processing accounts of reasoning, judgment, and social cognition. Annual Review of Psychology, 59, 255-278. http://dx.doi.org/10.1146/annurev.psych.59.103006.093629. [ Links ]
George, D. & Mallery, M. (2001) Using SPSS for Windows step by step: A simple guide and reference. Boston: Allyn & Bacon. [ Links ]
Glöckner, A. & Witteman, C. (2010). Beyond dual-process models: A categorisation of processes underlying intuitive judgement and decision making. Thinking & Reasoning, 16(1), 1-25. http://dx.doi.org/10.1080/13546780903395748. [ Links ]
Gross, M., Zalazar-Jaime, M., Piccolo, N. & Cupani, M. (2012, octubre). Nuevos estudios de validación del cuestionario de personalidad IPIP-FFM. Trabajo presentado en las Memorias del X Congreso Latinoamericano de Sociedades de Estadística, Córdoba, Argentina. [ Links ]
Hodgkinson, G. P., Sadler-Smith, E., Sinclair, M. & Ashkanasy, N. M. (2009). More than meets the eye? Intuition and analysis revisited. Personality and Individual Differences, 47(4), 342-346. http://dx.doi.org/10.1016/j.paid.2009.03.025. [ Links ]
Hu, L. T. & Bentler, P. M. (1999). Cutoff criteria for fit indexes in covariance structure analysis: Conventional criteria versus new alternatives. Structural Equation Modeling: A Mmultidisciplinary Journal, 6(1), 1-55. http://dx.doi.org/10.1080/10705519909540118. [ Links ]
Kline, R. B. (1998). Principles and practices of structural equation modeling. New York: Guilford. [ Links ]
Marks, A. D. G., Hine, D. W., Blore, R. L. & Phillips, W. J. (2008). Assessing individual differences in adolescents’ preference for rational and experiential cognition. Personality and Individual Differences, 44(1), 42-52. http://dx.doi.org/10.1016/j.paid.2007.07.006.
Muñiz, J., Elosua, P. & Hambleton, R. K. (2013). Directrices para la traducción y adaptación de los tests: segunda edición. Psicothema, 25(2), 151-157. http://dx.doi.org/10.7334/psicothema2013.24. [ Links ]
Pacini, R. & Epstein, S. (1999). The relation of rational and experiential information processing styles to personality, basic beliefs, and the ratiobias phenomenon. Journal of Personality and Social Psychology, 76(6), 972-987. http://dx.doi.org/10.1037/0022-3514.76.6.972. [ Links ]
Sladek, R. M., Bond, M. J. & Phillips, P. A. (2010). Age and gender differences in preferences for rational and experiential thinking. Personality and Individual Differences, 49(8), 907-911. http://dx.doi.org/10.1016/j.paid.2010.07.028. [ Links ]
Steiger, J. H. (1990). Structural model evaluation and modification: An interval estimation approach. Multivariate behavioral research, 25(2), 173-180. http://dx.doi.org/10.1207/s15327906mbr2502_4. [ Links ]
Sterba, S. K. & Foster, E. M. (2008). Self-selected sample. En P. J. Lavrakas (Ed.), Encyclopedia of Survey Research Methods (pp. 806-808). Thousand Oaks, CA: SAGE Publications. http://dx.doi.org/10.4135/9781412963947.n525. [ Links ]
Tabachnick, B.G. & Fidell, L. S. (2007). Using Multivariate Statistics (5th ed.). New York: Allyn and Bacon. [ Links ]
Tucker, L. R. & Lewis, C. (1973). A reliability coefficient for maximum likelihood factor analysis. Psychometrika, 38(1), 1-10. http://dx.doi.org/10.1007/BF02291170. [ Links ]
Witteman, C., van den Bercken, J., Claes, L. & Godoy, A. (2009). Assessing rational and intuitive thinking styles. European Journal of Psychological Assessment, 25(1), 39-47. http://dx.doi.org/10.1027/1015-5759.25.1.39. [ Links ]
Recibido el 02 de junio, 2015
Aceptado el 14 de abril, 2016


