


Services on Demand
article
 English (pdf)
 Article in xml format
 Article references
Indicators

Share

 Permalink
Temas em Psicologia
Print version ISSN 1413-389X
Temas psicol. vol.20 no.1 Ribeirão Preto June 2012
DOSSIÊ "ACERCA DA INTELIGÊNCIA HUMANA"
Considerations about IQ and human capital in Brazil
Considerações sobre QI e capital humano no Brasil
Consideraciones sobre CI y capital humano en Brasil
Carmen Flores-MendozaI; Keith F. WidamanII; Marcela Mansur-AlvesIII; José Humberto da Silva FilhoIV; Sonia Regina PasianV; Carlos Guilherme Maciel Furtado SchlottfeldtVI
IUniversidade Federal de Minas Gerais - Brazil
IIUniversity of California at Davis - USA
IIIUniversidade Federal de Minas Gerais - Brazil
IVUniversidade Federal do Amazonas - Brazil
VUniversidade de São Paulo - Brazil
VIUniversidade Federal de Minas Gerais - Brazil
ABSTRACT
Brazil became the ninth largest and fastest-growing economy in the world. In addition, Brazil has acquired a leading position in the Latin American region. Recently, a positive correlation between the mean IQ of countries and their capacity to achieve economic growth has been found by psychological science. However, several studies led by the British psychologist Richard Lynn have reported a mean IQ of 87 for Brazil, which seems to be insufficient for explaining the current Brazilian economical performance. The present article shows data of cognitive performance of 1192 Brazilian adults (46% males) recruited from the general population of Minas Gerais state, and 1641 University students recruited in universities from Amazonia, Bahia, Minas Gerais and São Paulo states. Raven's Standard (general population) and Advanced (University students) Progressive Matrices were the instruments used. The Raven scales are the most preferred tests in studies regarding national cognitive performance. The results indicated a mean IQ of 89 in the general population, thus a value not very different from Lynn's estimative. However, the cognitive performance of top human capital, concentrated in Brazilian public universities, was indistinguishable from the performance of participants in universities of developed countries. The human capital with high cognitive performance is the only segment of society able to produce and to upgrade technologies, move up the development ladder and catch up with developed countries. Thus, it was concluded that the national mean IQ is not a good indicator of the potential for Brazilian intellectual and economic leadership in the Latin American region. Instead, one of the best indicators could be the magnitude (and quality) of the top human capital of Brazil, which was estimated in 20 millions of people. This number rivals the human capital of developed countries in both quality and potential.
Keywords: Brazilian IQ, Intelligence, Human capital, National IQ.
RESUMO
O Brasil se tornou a nona maior economia e a de mais rápido crescimento mundial. Além disso, o Brasil alcançou uma posição de liderança na América Latina. Recentemente, foi encontrada pela ciência psicológica uma correlação positiva entre o QI médio dos países e sua capacidade de crescimento econômico. No entanto, vários estudos, liderados pelo psicólogo britânico Richard Lynn, relatam um QI médio de 87 para o Brasil, o que parece ser insuficiente para explicar seu desempenho econômico atual. O presente artigo mostra os dados do desempenho cognitivo de 1192 adultos brasileiros (46% homens) recrutados da população geral de Minas Gerais e 1641 estudantes de universidades da Amazônia, Bahia, Minas Gerais e São Paulo. Os instrumentos utilizados foram as Matrizes Progressivas de Raven, Escala Geral (população geral) e Avançada (estudantes universitários). As escalas de Raven são os testes mais utilizados em estudos sobre diferenças cognitivas em nível nacional. Os resultados indicaram um QI médio de 89 na população geral, um valor não muito diferente da estimativa de Lynn. No entanto, o desempenho cognitivo do capital humano de alto nível, concentrado nas universidades públicas brasileiras, foi indistinguível do desempenho dos participantes de universidades de países desenvolvidos. O capital humano com alto desempenho cognitivo é o único segmento da sociedade capaz de produzir e aprimorar tecnologias, elevar a escala de desenvolvimento e alcançar os países desenvolvidos. Assim, concluiu-se que o QI médio nacional não é um bom indicador para o potencial brasileiro de liderança intelectual e econômica na América Latina. Em vez disso, um dos melhores indicadores poderia ser a magnitude (e qualidade) do capital humano de alto nível do Brasil, que foi estimado em 20 milhões de pessoas. Este número compete com o capital humano de países desenvolvidos, tanto em qualidade quanto em potencial.
Palavras-chave: QI brasileiro, Inteligência, Capital humano, QI nacional.
RESUMEN
Brasil se ha convertido en la novena economía más grande y de más rápido crecimiento en el mundo. Además, Brasil ha adquirido una posición de liderazgo en América Latina. Recientemente ha sido encontrado por la ciencia psicológica una correlación positiva entre la media del CI de los países y su capacidad de crecimiento económico. Sin embargo, varios estudios dirigidos por el psicólogo británico Richard Lynn informan un CI promedio de 87 para Brasil, lo que parece ser insuficiente para explicar su actual desempeño económico. El presente articulo muestra los datos de rendimiento cognitivo de 1192 adultos brasileños (46% varones) extraídos de la población en general del estado de Minas Gerais, y de 1641 estudiantes universitarios reclutados en Universidades de Amazonia, Bahía, Minas Gerais y São Paulo. Fueron utilizados los instrumentos Matrices Progresivas de Raven - Escala General (población en general) y Matrices Progresivas Avanzadas de Raven (estudiantes universitarios). Las escalas de Raven son las pruebas más utilizadas en los estudios sobre diferencias cognitivas entre naciones. Los resultados indicaron un CI promedio de 89 en la población general, por lo tanto un valor no muy diferente de la estimación de Lynn. Sin embargo, el rendimiento intelectual del capital humano de alto nivel, concentrado en las universidades públicas brasileñas no fue diferente del desempeño de los estudiantes de universidades de los países desarrollados. El capital humano de alto rendimiento intelectual es el único segmento de la sociedad capaz de producir y actualizar las tecnologías, elevar las escalas de desarrollo y de alcanzar los países desarrollados. Por lo tanto, se concluye que el CI medio nacional no es un buen indicador del potencial de liderazgo intelectual y económico de Brasil en América Latina. En cambio, uno de los mejores indicadores podría ser la magnitude (y calidad) del capital humano de alto nivel de Brasil, que fue estimado en 20 millones de personas. Este número rivaliza con el capital humano de los países desarrollados, tanto en la calidad como en el potencial.
Palabras clave: CI brasileño, Inteligencia, Capital humano, CI nacional.
IQ of Nations
Since the publication of the book "IQ and the Wealth of Nations" (Lynn & Vanhanen, 2002, 2006), national IQ has constituted a source of inspiration and reference for recent social, economic and psychological cross-cultural studies. In that book, Lynn and Vanhanen estimated the mean IQ of 185 nations from studies in which intelligence tests were administered to samples of population. For most countries, IQ was derived from the Raven's Progressive Matrices - Standard and Colored Scales - a non-verbal reasoning test. For other countries, a variety of other tests - like Draw-a-Person Test or Wechsler Adult Intelligence Scales (WAIS) - were used. In summary, Lynn and Vanhanen presented the following cognitive geographical configuration: Kalahari inhabitants have a mean IQ of 54, Australian's aborigines an IQ of 62, Sub-Saharans IQ 67, South Asians and North Africans IQ 85, Pacific Islands inhabitants IQ 85, American natives IQ 86, Southeast Asians IQ 87, Artic inhabitants IQ 91, Europeans IQ 99, East Asians IQ 105. Specifically, the Latin-American continent had mean IQs that ranged from 79 (Guatemala) to 91 (Costa Rica) in Middle-America (M=83.43; SD=2.64) and from 80 (Equator) to 96 (Argentina and Uruguay) in South America (M=89; SD=5.08). Moreover, Lynn and Vanhanen asserted that differences in national income (measured by per capita Gross Domestic Product-GDP) could be attributed to national differences in IQ insofar as the correlation between IQ and GDP was about 0.7.
As expected, the Lynn and Vanhanen (2002) results for national differences in mean IQ became rapidly known in several scientific settings. For instance, during 2006 and 2007, papers on national IQ were the most cited in the journal Intelligence (Wicherts, 2009). The popularity of these research results is based on a ubiquitous and strong association between national social indexes and mean IQ of citizens found by diverse researchers. Beyond wealth (Dickerson, 2006; Jones & Schneider, 2006; Whetzel & McDaniel, 2006), national IQ is related with life expectancy (Kanazawa, 2006); rates of secondary education enrollment, illiteracy, and agricultural employment (Barber, 2005); crime (Rushton & Templer, 2009); tests of educational achievement (Rindermann, 2007); production of technological knowledge (Gelade, 2008a; Jones & Schneider, 2010); atheism (Lynn, Harvey, & Nyborg, 2009; Reeve, 2009); educational achievement (Lynn, Meisenberg, Mikk, & Williams, 2007; Lynn & Mikk, 2007); scientific productivity measured by articles published (Morse, 2008); fertility rate (Reeve, 2009; Shatz, 2008); infant and maternal mortality rate (Reeve, 2009); HIV/AIDS rate (Rindermann & Meisenberg, 2009); and social inequality (Meisenberg, in press).
Therefore, the robust association between national IQ and notable social variables supports the ranking of national IQ elaborated by Lynn and Vanhanen (2002, 2006), despite the use of a variety of tests, epoch of studies, and size of samples analyzed. Moreover, the similarity of mean IQs of neighboring nations was recently confirmed through new studies (Gelade, 2008b; Lynn & Meisenberg, 2010) that supported, in general, the trends that Lynn and Vanhanen had reported.
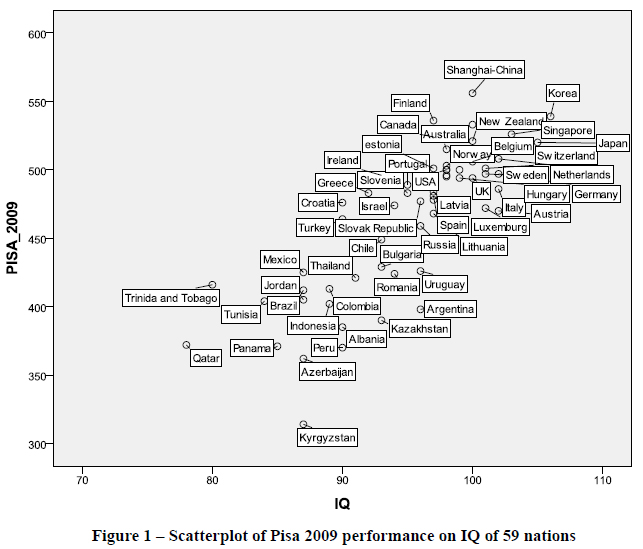
According to Lynn and Mikk (2007), the association between national IQ and social variables is causal and reciprocal. In addition, Lynn and Vanhanen (2002, 2006) asserted that a national IQ of 90 is needed to adopt modern and sophisticated technologies, which would not occur in countries with mean IQ below 80. Why an IQ of 90 is a crucial cutoff for modern development of a country is unknown. But, one can infer that if the national mean trends in IQ are valid, then the low mean IQ of the majority of Latin-American countries could explain the low performance of these countries in international school achievement assessments such as PISA [Programme for International Student Assessment] conducted in 2000, 2003, 2006, and 2009. In these assessments, Latin-American countries occupied the lowest positions. The association between the PISA-2009 results (emphasis in reading) and IQ of nations was 0.79, as shown in Figure 1.
After considering the results from previous studies, the final message to be understood is: at a national level, as well as at the individual level, positive associations are found between intelligence, education, health, and wealth. Although causal pathways among these variables are not known (Rindermann, 2008; Rindermann, Flores-Mendoza, & Mansur-Alves, 2010; Hunt & Wittmann, 2008), an increasing consensus can be seen in political and academic settings about mental capital and its influence on the prosperity of nations (Beddington et al., 2008). Thus, investigations of the connections between intelligence and indicators of social development and wealth deserve considerable attention by all developing countries.
Brazil
The present essay refers to a Latin-American country: Brazil. This country is located in South America and possesses an extensive territorial area of 8.514.877 km2, with approximately 190.756.799 habitants (census 2010), 83.5% living in urban areas, a fertility rate of 1.95, and 4.5% of the population above 70 years old (www.ibge.gov.br). Its economy is the world's tenth largest at purchasing power parity (PPP) exchange rates with a total labor force corresponding to 100.9 million (5º worldwide position) and a per capita GDP-2008 (PPP) of US$ 10,100 (www.cia.gov/library/publications/the-world-factbook/index.html). The middle class grew from 42% in 2004 to 52% in 2008 (Neri, 2008). The Gini index of Brazil fell from 0.593 in 2003 to 0.552 in 2007 (10th position of social inequality), and since 2005 Brazil has been in the group of countries with a high human development index (70th position) (www.undp.org). According to the World Bank, several social problem indexes fell: poverty rate (from 39.4% in 2003 to 30.3% in 2007), unemployment (from 12% in 2003 to 9% in 2008) and infant mortality (from 50:1000 in 1990 to 21.1:1000 in 2005). On the other hand, school enrollment in basic education rose from 85% in 1990 to 97% in 2005 (http://www.lac-developmentmarketplace.org/). The country is considered to be one of the group of four emerging economies called BRIC (the initials of Brazil, Russia, India, and China), a term created in 2001 by Goldman Sachs, a bank holding company.
Brazilian industry is highly concentrated geographically in metropolitan areas located in the Southeast/South of Brazil such as São Paulo, Rio de Janeiro, Minas Gerais, and Paraná. At present, the Brazilian economy is on the rise. Thanks to continual sound management, the country is facing the impact of recent global economic problems more efficiently than it had in the past. In addition, beyond high levels of sophisticated agriculture and automobile production, Brazil, through the company Embraer (created in 1969), became one of the largest aircraft manufacturers in the world (www.embraer.com.br).
The formidable advancement of Brazil is also noted in its academic and scientific indexes. For example, according to the Science Watch of Thompson Reuters, Brazil's percent share of world literature has grown from 0.56% in 1989 to 2.02% in 2007 especially due to areas such as Agricultural Sciences (15th worldwide position), Plant and Animal Science, Microbiology, Pharmacology and Toxicology, and Environment/Ecology (King, 2009). The number of Masters and PhD students produced in Brazil grew five and seven times, respectively, from 1990 to 2004 (www.inep.gov.br). Moreover, to respond to the scientific communication exchange needed in the Latin American and Caribbean context, Brazil created the database "SciElo" in 1998 to serve as an online open access scientific electronic library. For that reason is unsurprisingly that Brazil exports technology to almost all of its neighboring countries. With this impressive data it is not without reason that, up to now, Brazil occupies a political and economic leadership in Latin America. In this sense, Brazil recently created the Union of South American Nations (UNASUL, its Portuguese acronym) based on the European Union, in which countries from South American trading blocs (Mercosur and the Andean Community) were integrated.
What is the human capital on which Brazil counts for maintaining its socio-economic growth and its leadership? According to Lynn and Vanhanen's studies (2002, 2006), Brazil has a mean IQ estimated at 87 (already adjusted by Flynn effect or cognitive gains across generations). Lynn and Vanhanen arrived at this mean estimate based on data from 160 adolescents collected in 1966 using the Raven's SPM and data from the Coloured Progressive Matrices (CPM) collected in 1966 (n=505), 1982 (n=1,131), and 1988 (n=1,547). The data in these studies were collected in Rio de Janeiro and São Paulo for SPM (Natalicio, 1968) and CPM (Angelini, Alves, Custodio, Duarte, & Duarte, 1999), respectively.
Even after adjustment, a mean IQ of 87 does not seem to represent a cognitive level sufficient for any country to promote regional leadership as Brazil does currently. Thus, new analyses with updated data are necessary for confirming that the mean IQ of Brazil is as low as Lynn and Vanhanen reported.
Confirming the mean cognitive level of Brazilian nation (SPM)
Most studies on national IQ that Lynn and Vanhanen analyzed were based on estimated national achievement using the Raven's Standard Progressive Matrices (SPM) because it is considered to be a measure that is "free-culture" (Jensen, 1998) and because it has been used extensively in several countries. In a similar way, we used data from the same instrument for analyzing the cognitive performance of Brazilian adults, specifically adults from Minas Gerais state.
Participants
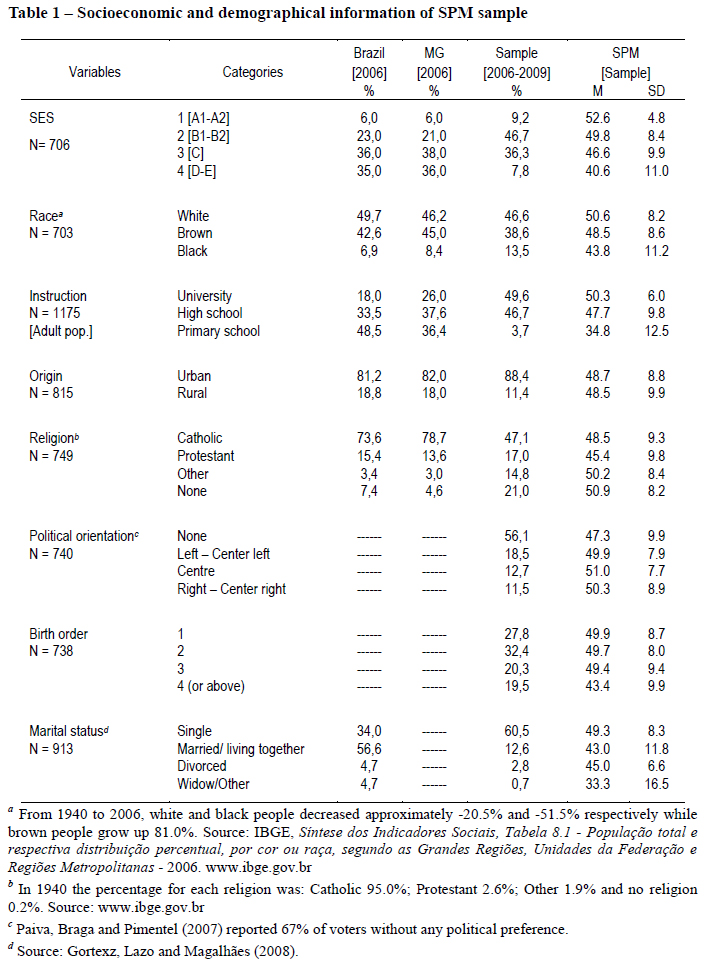
We used a large Brazilian dataset for statistical analysis, which comprises 1192 adults (46% males), aged between 16 and 65 years (M = 24.8; SD = 9.5). The majority of participants (76.6%) were born in Minas Gerais state, and the other 23.4% were from ten Brazilian states. However, all participants were residing in Minas Gerais state, specifically in Belo Horizonte city, during the period of testing. Minas Gerais state is located in the west of the Brazilian southeastern region and borders with six states (São Paulo and Rio de Janeiro included). With 19.765.000 people, Minas Gerais is the third most economically developed Brazilian state, and its DHI corresponds to 0.80 [www.ibge.gov.br].
Before analyzing our dataset, we knew that, depending on recruitment, there could be serious bias in the interpretation of results (Madhyastha, Hunt, Deary, Gale, & Dykiert, 2009). Thus, we analyzed our dataset on the basis of five sampling criterion proposed by Wicherts, Dolan, and van der Maas (2010): Random selection, stratification, health status, normal SES, and representativeness.
Random selection is achieved when all members of the population have an equal chance of being selected as part of the sample (e.g., selecting subjects from a list of schools, universities, or electoral register). Considering this definition, our sample certainly is not-probabilistic, but instead was recruited by convenience (or acceptance of subjects).
Stratification: stratification refers to particular demographic variables which characterize the samples. In our case, we strived to invite participants from all SES, race, and educational levels in order to achieve reasonable stratification.
Health status: Refers to capacity of participants to respond adequately to the materials used in the study. In our case, all participants were attending normal school, university, or selective process. In the case of people above 50 years, they were tested in their home by collaborator psychologists, and no participants were inactive due to illness.
Normal SES: Our dataset is probably one of the few datasets on national IQ with information regarding distribution level of SES. However, we have this information for only 59% of the total sample. The majority of the remainder with no data about SES was composed of job applicants whose posts varied from administration auxiliary (low complexity) to manager business / teacher in private high school (middle-high complexity). Since jobs are associated with SES (Gottfredson, 2006), it is possible to infer a broad heterogeneity of SES for the sample remainder too.
Representativeness: Refers to a subset of a statistical population that accurately reflects the members of the entire population. Representativeness has less to do with the right sample size than with the right target. In our case, we invited young people (16-18) only from public high schools due to the fact that private high schools did not permit the testing, while people above 18 years old were recruited from universities (public and private). Note that public Brazilian universities have a rigorous student entrance examination system whereas private universities do not select their student. In addition, in our dataset, a segment of Brazilian young people was trying to enter university and was attending preparatory courses. Hence, in our dataset, we had young people representing broad cognitive heterogeneity. The recruitment of adults above 25 years old was more difficult. Considering that adult people work in jobs of different complexity levels according to their educational level reached, we recruited adults from friendship networks and from psychological assessment centers for driving license or selection process of human resources. Finally, for obtaining adults above 50 years old, we used social network and friendship networks (especially for testing retired adults). In the case of the representativeness with regard to sex, it is known that in social-behavioral studies with adult people samples in Brazil, obtaining a sample that is equitable for both sexes is problematic due to higher mortality rates for men than for women, especially in early adulthood. For instance, in 1980 the probability of death for a Brazilian man who was 20-24 years old was twice as high when compared to a woman of the same age. In 2008 the probability of male death increased over 4 times that of a same-aged woman (http://www.ibge.gov.br/home/estatistica/populacao/tabuadevida/2008/defaulttab.shtm). Other factors also contribute for inequality in the percentage of males and females in studies, such as males having higher drop-out rates from school. Hence, it is unsurprising that female participants (54%) predominate in our dataset. Last but not least, to avoid samples concentrated in the capital, we tested people in the interior of Minas Gerais State (11%). However, even among people tested in Belo Horizonte (Capital), 60.8% declared they were from 92 towns located in the interior of Minas Gerais state. Probably, this reflects evidence of known migration from the countryside to the big city. Table 1 indicates the composition of the Brazilian sample.
As shown in Table 1, our samples appear to be relatively representative of the Brazilian population on most dimensions, but our samples tend to have higher levels of education and to be more representative of the middle socioeconomic class than the Brazilian population. Because of this, our samples had a slightly higher rate of urbanization (88%) relative to the population (81%), and a higher rate of atheism (21%) than the overall population (7%).
Instruments
To estimate the Brazilian mean level of IQ, the performance of Brazilian adults on Raven's Standard Progressive Matrices (SPM) test (Centro Editor de Psicologia Aplicada [CEPA], 2001a) was analyzed. The SPM test is presumed to be a good measure of Spearman's g factor (Jensen, 1998). It contains 60 items, and the coefficient alpha for the sample of this study was 0.93. The SPM test was administered between August of 2006 and October of 2009.
Part of the sample that responded to the SPM test agreed to fill out a social-economic questionnaire too. This questionnaire consisted of several social-demographic items (e.g. race, birth position, religion, etc.) and questions related to "Critério Brasil1", a reliable measure of social segmentation of the Brazilian population. "Critério Brasil" is based on two sources: available resources at home, and parents' level of education. The points accumulated by each item are calculated and converted to a classification scale. In 2006, seven categories were valid, and, in 2008, eight classifications (the C class was divided into C1 and C2). For this study, four categories were considered: 1 (A1 and A2 = average U$ 3646,25), 2 (B1 and B2 = average U$ 1260,5), 3 (C and C1 / C2 = average U$ 490) and 4 (D and E = average U$ 204)2.
Procedure
The administration of the test was lead by the authors of the present study and by psychologists who collaborate with the Laboratory of Individual Differences Assessment of the Department of Psychology of the Universidade Federal de Minas Gerais. Testing was done in group settings (for young people) and/or individual administration (for older people, generally above 50 years old).
Results
First, we examined the distribution of scores on the SPM. We observed that the distribution had a significant negative skewness (-1.678/0.071) or a long left tail. Thus, our dataset shows a great departure from symmetry. In addition, we found positive kurtosis (3.369/0,142), which indicates that, relative to a normal distribution, the observations are more clustered about the center of the distribution and have thinner tails in the extreme values of the distribution. The asymmetry is expected insofar as the SPM test is currently being resolved with more facility by people than in the past, due to Flynn effect (cognitive gains between generations). The long left tail does reflect high variability, and it seems characteristic of developing countries, in particular. More cognitive homogeneity is found in developed countries, probably due to samples drawn entirely from educated segments of Western societies. As consequence, little human variability is expected when samples from developed countries are used. In our study, the SPM scores were not symmetric, and the distribution of scores tends to incline to the right side of the curve with a long left tail (Figure 2).
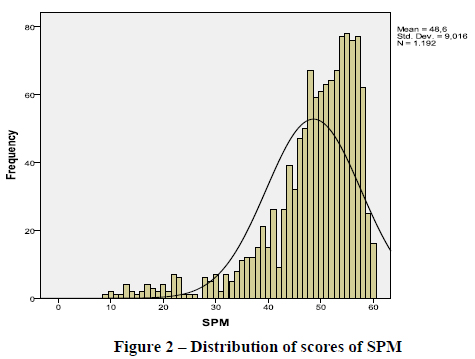
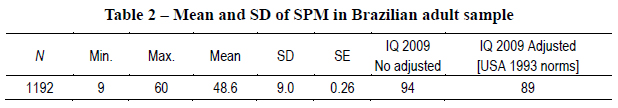
Research about national cognitive differences use British results (1979) on SPM as a "Greenwich-IQ" norm (IQ-scale: M=100, SD=15). However, there are not British norms for adult people. For this reason we used 1993 American norms. In our study, the mean obtained on the SPM was 48.6 points, which represents the 36th percentile of performance, equivalent to an IQ of 94, when compared to 1993 American norms. Due to the Flynn effect (cognitive gains across generations), an adjustment to this value is necessary. According to Lynn (2006), if the 1993 American standardization is corrected for secular trends, one must assume an increase of 2 IQ points per decade from 1993, and one must also consider the performance of ethnic groups in the USA. Our data were collected between 2006 and 2009, mostly in 2008. Thus, the adjustment (or deduction of IQ points due to Flynn effect) would be: 3 IQ points [2 x 1.5 decade (1993 - 2008) = 3], and reduction of 2 IQ points due to the fact that USA has an IQ estimated in 98 (an effect of performance of American ethnic groups). The total reduction would be equal to 5 IQ points. Employing this adjustment, the raw mean IQ estimate of 94 for Brazil must be reduced to an estimated mean of 89. This value is very similar to the mean IQ of 87 estimated by Lynn and Vanhanen (2002, 2006). However, it should be noted that the standard deviation SPM raw scores was 9 points in this sample. Thus, as observed previously in Figure 2, the variability in cognitive performance of participants was relatively large (see Table 2).
In addition, we used hierarchical regression analysis to estimate the contribution of relevant social variables, such as educational level and socioeconomic status (SES), after controlling effects of age (r = -0.266; p < 0.001) on performance in the SPM test. The results indicated that the complete model with all independent variables explained 25.8% of the variance in SPM scores. Specifically, educational level and SES explained 20.4% of the variance. Thus education level (b = 0.382, t = 11.11; p < 0.001) and SES (b = 0.268, t = 8.072; p < 0.001) were significant predictors of SPM performance beyond effects of age (b = -0.302, t = 8.677; p < 0.001).
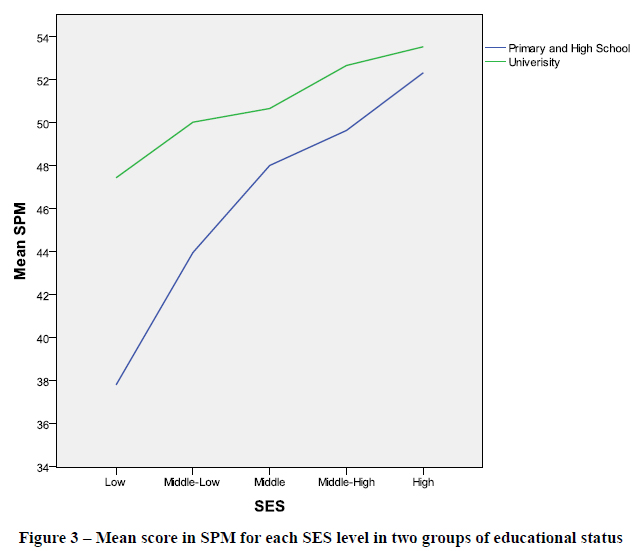
Considering the previous results, we estimated the mean SPM score for each SES level for groups defined by educational levels. The first group was composed of participants with primary and high school education (N = 405), and the second group was composed of participants with university degrees (N = 292). The first group, with lower education level, had a mean score of 46.5 (SD = 10.4), and significant differences were found across the SES levels [F(400) = 17.789; p = 0.000]. The second group, with more advanced education level, had a mean SPM score of 50.8 (SD = 6.43), and significant, but smaller differences were found across the SES levels [F(287) = 3.569; p = 0.007]. The results indicated two interesting points: (1) cognitive differences across SES levels are greater when people have fewer years of education, whereas higher levels of education lead to a distribution that is more homogeneous across SES levels, and (2) education has more influence on intelligence, indexed by SPM scores, in low SES levels than in high SES levels (Figure 3). This kind of results is compatible with the results obtained from a study of a sample of 623 7-year-old twins conducted by Turkheimer, Haley, Waldron, D'Onofrio, and Gottesman (2003). Turkheimer et al. found that the proportion of IQ variance attributable to genes and environment varied nonlinearly with SES. In impoverished families, 60% of the variance in IQ was influenced by the shared environment, and the contribution of genes was close to zero; in families with more resources, the results were the reverse. In this sense, based on our results and those of Turkheimer et al., the message for the governments of developing countries is to enhance their educational systems in order to diminish the high cognitive variability within their populations and the high rate of social inequality.
Estimating the top human capital in Brazil (APM)
As detailed above, the mean IQ estimated for Brazilian people in our samples using SPM scores does not differ from the estimate reported by Lynn and Vanhanen (2002, 2006) based on prior, smaller samples of participants. However, the variability of SPM scores from developing countries seems to be greater than variability of SPM scores in samples from developed countries. In developing countries, many people have very low performance on IQ tests, which affects the estimate of the mean and leads to larger variability in scores. Additionally, if IQ scores are not normally distributed but are, instead, negatively skewed, the mean is not an optimal estimator of the location of the distribution. In such situations, the mean may be negatively biased by low outlier scores, and this would mask the proportion of persons who fall in the upper ranges of the distribution. Thus, when considering comparisons across countries, it is interesting and relevant to estimate the cognitive performance of people considered to be the national elite and to compare the performance by this group with similar populations from developed countries in order to calculate the human capital of the country and engage in cross-country comparisons.
Where can the cognitive elite of a nation be found? It seems obvious to suppose that the cognitive elite of any country tends to be concentrated in universities. And, despite the form of government, democratic or dictatorial, universities exist in almost all countries of world. Furthermore, the quality and size of the cognitive elite can vary as a function of entrance systems (e.g. automatic entrance or administration of exams), infrastructure (e.g. presence of labs and equipments), quality of the faculty and staff, governmental incentive to stimulate research, etc. In a very real sense, the care of the national human capital depends on the political vision that a government has for the development of its country. To exemplify our position, we can cite China, a country with a dictatorial government, and USA, the most democratic country in the world, both of which have rigorous selection processes, good infrastructure, and a high level of faculty staffing their principal universities. In contrast, Argentina, a democratic country, and Cuba, with a dictatorial government, both have universities without entrance exams and, with few exceptions, with scarce resources for infrastructure and research.
Brazil, as reported previously, has grown extraordinarily during the past decade in its social indexes, science, and economy. Brazil has 2252 institutions of higher education (Universities and colleges), but only 10% of them are public (Instituto Nacional de Estudos e Pesquisas Educacionais Anísio Teixeira [INEP], 2009). The rate of applications per vacancy was 1.2:1 for private universities, but 7:1 for public universities. In contrast to private universities, public institutions have rigorous entrance examinations, and 36% of its faculty has a PhD, in contrast to only 13% of faculty having a PhD in private institutions. Moreover, the mean academic performance index of public universities in 2008 was 303.4, whereas the corresponding mean for private universities was 239.4 points in the National System of High Education Assessment (SINAES). According to The Times Higher Education (http://www.timeshighereducation.co.uk/world-university-rankings/2011-2012/top-400.html), two Brazilian public universities (Universidade of São Paulo in 178º and UNICAMP in 276 º) are among the 300 top universities of the world, but no private universities in Brazil have this distinction. Thus, a significant academic performance difference exists between public and private Brazilian universities.
To estimate the Brazilian human capital at elite levels - thereby identifying a population cognitively prepared for assuming leadership in science and technology in Brazil - three calculations were made: (1) Estimating the cognitive performance on the Raven's Advanced Progressive Matrices test administered to university students from public and private universities of four Brazilian states, (2) comparing these estimates with those published for participants in developed countries, and (3) using data from national school achievement high school test named ENEM, and data from Brazilian census regarding rate of enrollment in universities.
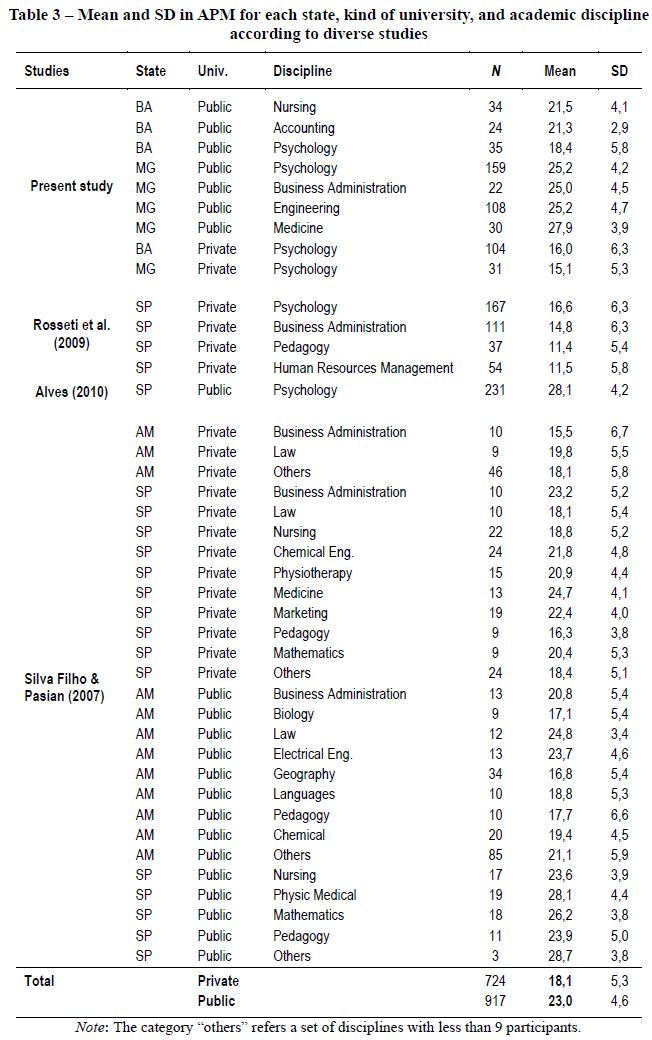
For conducting our analysis, data from two datasets and from two published studies were used. The first dataset comprise 547 University students (29.4% male), aged between 17 and 60 years (M = 22.0; SD = 5.4), attending six disciplines (Psychology 60%, Engineering 19.7%, Nursing 6.2%, Medicine 5.5%, Accounting 4.4%, Business Administration 4.0%), from public (75%) and private (25%) universities of Minas Gerais (64%), and Bahia state (36%). The second dataset comprised 495 University students (44,4% male), aged between 18 and 30 years (M = 22.5; SD = 3.36), attending 59 disciplines (17 disciplines had 9 or more participants), from private (44,4%) and public universities (55,6%) of Amazonas (54,9%) and São Paulo state (45,1%). The first dataset was collected by Laboratory of Individual Differences Assessment of Universidade Federal de Minas Gerais and Laboratory of Individual Differences Assessment of Faculdade Juvencio Terra, this last institution located in Bahia state (see information of lab research activities at www.fafich.ufmg.br/~ladi). The second dataset was collected by Laboratory of Psychological Assessment of Amazonas of Universidade Federal do Amazonas and by Center for Research in Psychodiagnostic of Universidade de São Paulo/Riberão Preto (Silva Filho & Pasian, 2007).
The two published studies were conducted by Alves (2010) and by Rosseti, Rabelo, Leme, Pacanaro, and Güntert (2009) in São Paulo state. In the first study, Alves reported the cognitive performance of 231 students of Psychology from a public university, aged between 18 and 55 years (M = 21.9; SD = 5.3), 67.5% female. In the second study, Rosseti et al. reported the cognitive performance of 369 students from two private universities, aged between 17 and 63 years (M = 28,1; SD = 9.4), 72% females, attending four disciplines (Psychology, 45.3%; Business Administration, 30.1%; Management of Human Resources, 14.6%, and Pedagogy, 10%).
The samples used in our analysis, in which the majority of participants were enrolled in public universities (75% for the first dataset, and 56% for the second dataset), do not represent the university population in Brazil insofar as the majority of Brazilian university students (75%) are enrolled in private universities. However, our intention was to estimate the cognitive performance of top human capital of Brazil. If we consider national data on academic performance, then the top human capital in Brazil is concentrated in public universities.
The Raven's Advanced Progressive Matrices (or APM) (Centro Editor de Psicologia Aplicada [CEPA], 2001b) was used to assess the cognitive performance of participants in the four samples. Unlike the SPM, the APM test is a more complex cognitive measure, and its use is more appropriate for assessing people with high educational level, such as university students. The APM test contains two series of items. The first is for training purposes, whereas the second series is the test itself. The series II contains 36 items and its coefficient alpha for the sample of this study was 0.88. The APM test was administered between April 2009 and December 2010 for the first dataset (Minas Gerais and Bahia state), and in 2006 for the second dataset.
In the Table 3 we present the results obtained. As expected, students from public universities had considerably higher mean APM scores (M = 23.0) than students from private universities (M = 18.1). This superiority is likely the effect of rigorous entrance exams that public universities use to select their applicants, that is, the consequence of a more severe form of selection to get into public universities.
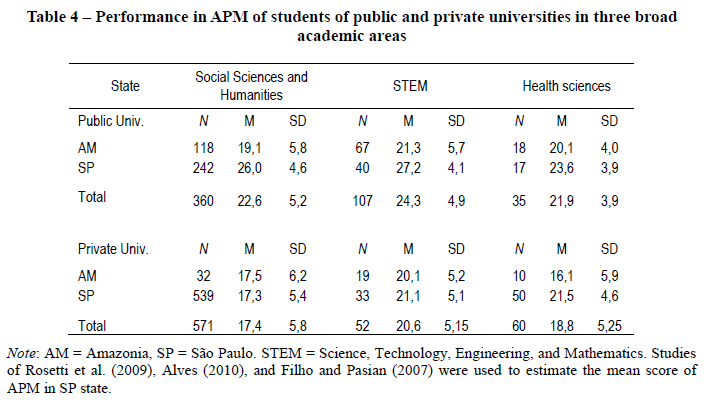
We estimated the score mean for each broad academic area in public and private universities. The results revealed two unsurprising outcomes: First, regardless of the kind of university or Brazilian state, students attending disciplines related to hard Science, Technology, Engineering, and Mathematics (known as STEM) had higher scores (Table 4). This result is compatible with studies conducted by Lubinski (2010) of academically precocious youth in the United States. Second, students in public universities had remarkably better performance than students from private universities. This result is compatible with the results obtained by SINAES and supports our position that the Brazilian top human capital is concentrated in public universities.
However, a third result was also documented: Southeast states (São Paulo, Minas Gerais) had higher performance than North/Northeast states (Amazônia, Bahia), even considering public universities. The results are showed in the Table 5.
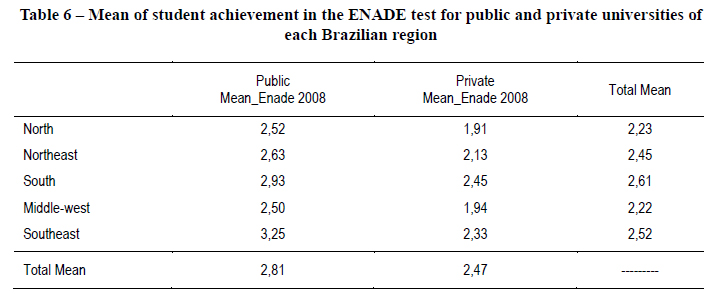
The results of Brazilian states/regions on the APM test are similar to the results obtained in the national exam for student achievement named ENADE 2008. As can be seen in the Table 6, university students from South and Southeast regions had better performance on the ENADE test than students from others regions.
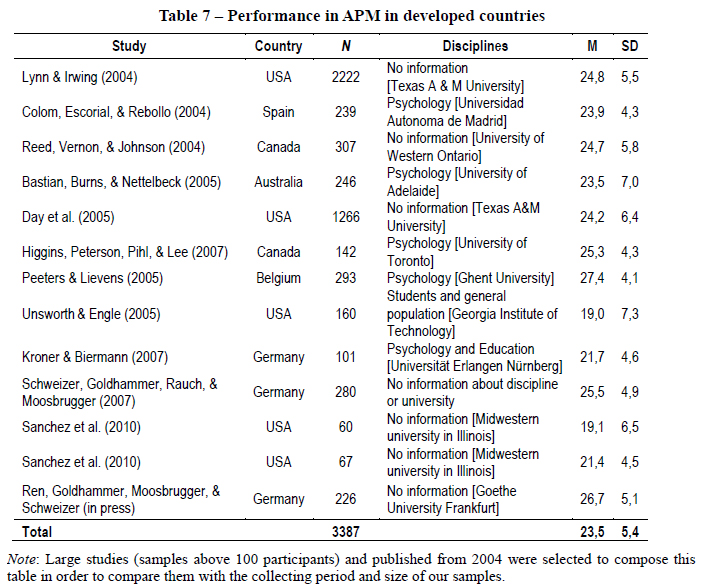
But, based on our results, the performance on the APM of students from public universities in Southeast Brazil does not differ from the mean score obtained by University students from developed countries, as can be seen in the Table 7.
If our estimates are correct, the top human capital in Brazil is concentrated in public universities, especially in those located in Southeast and South of Brazil, and this top human capital appears to be as able as comparable groups from developed countries. To underscore this point, we estimated the size of this top human capital analyzing national data for high school performance on the ENEM test (www.inep.gov.br), the Brazilian population census (www.ibge.gov.br), and data from the higher educational census in Brazil (www.inep.gov.br). ENEM is a school achievement test with two parts: writing and 63 objective questions. ENEM is offered voluntarily to young people who wish to know their performance in order to enter universities insofar as several Brazilian universities are using the score on the ENEM as one criterion of selection. ENEM was constructed in 1998 based on Piaget's theory of cognitive development, which means that the ENEM assesses cognitive abilities and skills acquired (or constructed) by a student during his or her interaction with the surrounding environment.
ENEM is administered to students who are finishing or are leaving high school. Generally the mean of age of ENEM takers is about 17.5 years. At this age, students are expected to be at the formal operational stage. At this stage, according to Piagetian theory, individuals overcome concrete experiences and begin to think abstractly, to use higher-order concepts, and, thus, to reason logically. In a strict sense, formal operational thinking should characterize the mental processes demanded by psychometric measures. However, if the solution of Piagetian tasks is associated with the solution of different types of psychometric items on intelligence measures, then ENEM scores may be correlated highly with IQ, which is a polemic subject in the academic context (Sternberg & Grigorenko, 2002). Nevertheless, positive correlations varying between 0.62 and 0.88 have been found between scores on Piagetian tasks and those from intelligence tests (Lim, 1988; Inman & Secrest, 1981; Carroll, Kohlberg, & De Vries, 1984; De Vries, 1974; Sternberg & Grigorenko, 2002).
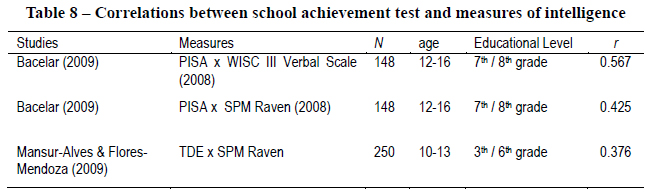
Published information about the association between ENEM test and psychometric tests of intelligence is not available. However, information about the associations among PISA (international school achievement test), TDE (national school achievement test in Brazil), and intelligence measures such as WISC-III Verbal Scale and SPM test have been reported by Bacelar (2009) and Mansur-Alves and Flores-Mendoza (2009). The positive associations can be seen in the Table 8. Based on this information, the existence of significant associations between the ENEM test and psychometric measures of intelligence is expected. For instance, in USA, the SAT, a well-known American school achievement test, is considered a proxy measure of intelligence insofar its association with psychometric tests of intelligence is highly positive (Frey & Detterman, 2004).
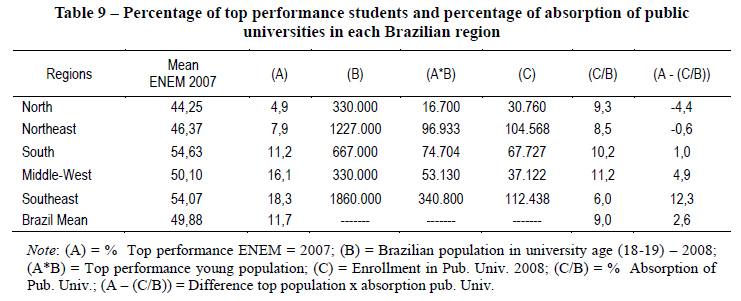
According to the official technical report (www.inep.gov.br), the age of participants of ENEM 2007 varied between 17 and 26 years (just 3% of participants were less than 17 years old); 58% were attending or recently left high school; 79.4% were attending or had attended high school in public schools, and unsurprisingly the majority of participants were females (62.5%). Beyond the mean score for each Brazilian state, the ENEM 2007 technical report listed the percentage of participants who achieved the highest interval of marks (70 to 100 points). In general, the ENEM 2007 results indicated that students from South and Southeast Brazil had the highest means and highest percentage of population with top performance (Table 9).
Based on this information, we calculated: (1) the number of young Brazilian population aged 18-19 years in 2008 for each region using the data of Brazilian census (www.ibge.gov.br), (2) the percentage of top young people at 18-19 years old based on the percentage of highest performers on ENEM 2007, (3) the number of freshman students in public universities in 2008 (www.inep.gov.br), (4) the percentage of the young Brazilian population at 18 - 19 years old who attend public university as freshmen (division between step 3 and step 1), and finally (5) the difference between the percentage of the top population expected in 2008 and the percentage of the population that enrolls at public universities.
The results of these calculations are shown in Table 9. Public universities enroll only around 9% of the young population who are of college-going age. This result is consistent with results reported in official Brazilian documents (INEP, 2009). Despite the general complaint in Brazilian society that the country has few public universities, it is noteworthy that of the 11.7% of the top national high school students almost 75% of them (or 9% of the population) attend public universities. Therefore, no great demand for additional public universities is justified, as only 2.6% of the population who fall in the top category fails to attend universities. The exception would be public universities of the Southeast region that had the largest difference between the percentage of university attendance and the available top student population. Interestingly, public universities of the North region of Brazil have a negative difference, which means that these universities are admitting more students than those that fall within the cognitive elite. As a result, these universities in the North of Brazil would likely have greater difficulty increasing their scientific productivity, given the fact that they are enrolling many students with lower levels of academic performance.
If the number of vacancies in public universities in the Southeast of Brazil does not increase in coming years even as the population increases, then the number of applicants per vacancy will only increase. The consequence would be a high level of competition for admission insofar as these universities are selecting students with the highest levels of performance. This could be the reason why, at the moment, public universities such as Universidade de São Paulo and UNICAMP enjoy favored positions in international rankings, because they selectively accept only the very best students. If one accepts this argument, several questions naturally arise:
1) What is the association between performance in high school and academic performance in University?
2) What is the stability of results of ENEM over time for relative performance by students in the 27 Brazilian states?
4) What is the percentage of unfilled vacancies in public universities?
To respond to the first question, we calculated the association between the average score in ENEM 2007 and score in ENADE 2008 of 27 Brazilian states (including the Distrito Federal). The correlations were r = 0.502 for ENADE 2008 and ENEM 2007 - Writing part, r = 0.446 between ENADE 2008 and ENEM 2007 - Objective part, and r = 0.414 between ENADE and the percentage of top performance of each state. Thus, moderately strong positive relations were found between ENEM performance in high school and academic performance in universities.
For the second question, we estimated the correlation between the average performance on ENEM in 2005 and ENEM 2007 for the 27 Brazilian states. The association was r = 0.976 for the Objective part, and r = 0.884 for the writing part of the ENEM. These results indicated very high stability in the relative positions of Brazilian states with regard to their scores on the ENEM test.
For the third question, it is pertinent to quote the first technical report about the ethnic census of Universidade de São Paulo (the principal university in the Southeast of Brazil) elaborated by Guimarães e Prandi (2002). The technical report showed that 89% of students of this university were born in São Paulo state. Similarly, 96% of students of the Universidade Federal de Bahia (the main university in the Northeast of Brazil) were born in Bahia state (http://www.cpa.ufba.br/documentos.html). Thus, public universities clearly tend to select students that were born in the same state in which the university is located.
Finally, to respond the last question, we verified that in 2008 the percentage of unfilled vacancies for students was 54.7% for private and 17% for public universities (www.inep.gov.br). The majority of unfilled vacancies in public universities were in municipal universities. Federal and state universities had 4.4% and 3.8% unfilled vacancies, respectively. The reason offered by the government for explaining the significant number of unfilled vacancies in Brazilian universities is the increase of vacancies in almost all universities and the creation of night courses. Moreover, 35% of students who attended public universities in 2008 did not finish their degrees. Thus, there is a mismatch between the supply of vacancies and demand of applicants for positions in Brazilian universities. Information about unfilled vacancies in public universities for each Brazilian region is not available. However, considering trends shown in Table 9, it is probable that public universities in the Southeast of Brazil have few unfilled vacancies because of a relatively large proportion of students from the Southeast are high-performing students (18.3%), but less than one-third of these students (6%) currently attend public universities.
At this point, we return to the prime question: what is the size of the human capital in Brazil? The percentage of young people enrolled in public universities from the South and Southeast regions, where the cognitive performance of students is high, ranges between 6% and 10%, and the percentage of top Brazilian high school students is 11,7%. Given these figures, we estimate the size of Brazilian top human capital to be around 9 to 10% of the entire population. This percentage is not trivial, but is even more pronounced when converted into the size of this high-performing group. Brazil has a population estimated at almost 200 million people. Thus, 10% of 200 million is equivalent to 20 million individuals, a number of individuals that is larger than the entire population of many countries.
Final considerations
Several conclusions can be drawn from the results presented in this paper. First, we used samples of participants that were larger and more representative than those used by Lynn and Vanhanen (2002, 2006), but we arrived at very similar estimates of the mean IQ of the Brazilian population. In arriving at our estimates, we were careful to correct our mean estimates for the Flynn effect. After doing so, our estimate fell within 2 IQ points of the estimate reported by Lynn and Vanhanen.
However, we also argued that the mean of a distribution may not be the most appropriate way to characterize levels of intelligence in developing countries. In developing countries, as in Brazil, researchers often find non-normal, negatively skewed scores on intelligence tests. This non-normality is likely due to many factors, such as much lower levels of education and SES for a relatively large proportion of the population and lower quality of education when it is delivered. Our results showed that intelligence test scores were much more homogeneous across SES levels when we assessed persons with higher levels of education; at lower levels of education, SES was much more strongly related to SPM performance, with decidedly lower levels of performance for persons at the lowest levels of SES. SES and educational level are malleable factors for a population. If a country is motivated to improve the SES and educational level of its population, our results suggest that the intelligence test performance of the population will increase. Thus, while it is true that intelligence test differences across countries can be influenced by genetic variance, it is equally correct to assert that cognitive national difference can be affected if the environmental conditions of the population are improved (Flynn, 2007).
An important, key aim of this paper was to estimate the size of the top human capital of Brazil. Given the non-normality of intelligence test scores, we sought to identify the proportion of the Brazilian population that scored at a level considered high in developed countries. We do not have a "Greenwich-IQ" scale (or an universal IQ scale) for comparison of top performance between nations, but we found that the APM performance of participants in our samples from Brazilian public universities was indistinguishable from the performance of participants in universities in developed countries. The high performance of students in Brazilian public universities is likely the result of several factors, including rigorous entrance examinations and high levels of selection. Moreover, these students are drawn from the South and Southeast, where SES levels are higher and school quality is higher than in other areas of Brazil - in short, where environmental circumstances are more optimal for developing the knowledge and skill to do well in school and at the university.
After computations involving the population distribution and rate of high-performing students in various areas of Brazil, we estimated the top human capital of Brazil to be approximately 20,000,000 persons. Thus, the mean IQ for Brazil, which we estimated at 89, is not a good indicator of the potential for intellectual leadership in the Latin American region. Instead, the optimal indicator for potential for leadership is the size or magnitude of the top human capital of Brazil, and this number rivals the human capital of developed countries in both quality and potential. Some might question how Brazil can take a leadership role in Latin America and the world if its national IQ is only 89. The answer to this seeming paradox is that the mean IQ of Brazil is not the proper indicator of its leadership potential. The large and productive population in Brazil that is at the highest levels of human capital - which is estimated in 20 million - could be the basis for the leadership that Brazil is exerting in Latin America and beyond. However, we must recognize that our samples, assessed with SPM and APM, are not representative samples of Brazil, in the strict meaning of the word. Instead, this study constitutes a first attempt in studying the cognitive condition of Brazilian human capital.
The Brazilian government should be encouraged to continue to support and exploit the high-level human capital of its population. To get the greatest productivity in all areas, including science and technology, from this group, the government should lend its support - investing money in universities and financial support for students and researchers - so that maximal gains can be realized. The government of Brazil is doing precisely this in providing funding for organizations such as CNPQ and CAPES, which send researchers and technicians to developed countries to learn the most up-to-date methods of conducting basic and applied research. The political and economical future is bright for Brazil, but only if the government maintains its commitment to nurturing the talented segment of its population.
References
Alves, I. C. B. (2010). Análise psicométrica do Teste das Matrizes Progressivas de Raven - Escala Avançada em universitários. Programa e Resumos (p. 38). São Paulo: Vetor. (Trabalho apresentado no IX Encontro Mineiro de Avaliação Psicológica - IX EMAP e II congresso Latino-Americano de Avaliação Psicológica, Belo Horizonte, MG). [ Links ]
Angelini, A. L., Alves, I. C. A., Custódio, E. M., Duarte, W. F., & Duarte, J. L. M. (1999). Manual das Matrizes Progressivas de Raven. São Paulo: Centro Editor de Testes e Pesquisas em Psicologia. [ Links ]
Bacelar, T. D. (2009). A Influência da Inteligência e da Personalidade nas Diferenças Individuais do Rendimento Acadêmico em Escolares do Ensino Fundamental. Dissertação de Mestrado, Programa de Pós-Graduação em Psicologia, Universidade Federal de Minas Gerais, Belo Horizonte. [ Links ]
Barber, N. (2005). Educational and ecological correlates of IQ: A cross-national investigation. Intelligence, 33,273-284. [ Links ]
Bastian, V. A., Burns, N. R., & Nettelbeck, T. (2005). Emotional intelligence predicts life skills, but not as well as personality and cognitive abilities. Personality and Individual Differences, 39(6),1135-1145. [ Links ]
Beddington, J., Cooper, C. L., Field, J., Goswami, F. A., Hupperts, R. J., Jones, H. S. et al. (2008). The mental wealth of nations. Nature, 455(23),1057-1060. [ Links ]
Carroll, J. B., Kohlberg, L., & De Vries, R. (1984). Psychometric and Piagetian intelligences: toward resolution of controversy. Intelligence, 8,67-91. [ Links ]
Centro Editor de Psicologia Aplicada. (2001a). Manual das Matrizes Progressivas de Raven - Escala Geral. Séries A, B, C, D e E. Tradução e adaptação: Francisco Campos. Rio de Janeiro: CEPA. 2a ed. [ Links ]
Centro Editor de Psicologia Aplicada. (2001b). Manual das Matrizes Progressivas de Raven - Escala Avançada. Rio de Janeiro: CEPA. [ Links ]
Colom, R., Escorial, S., & Rebollo, I. (2004). Sex differences on the Progressive Matrices are influenced by sex differences on spatial ability. Personality and Individual Differences, 37,1289-1293. [ Links ]
Day, E. A., Arthur, W., Bell, S. T., Edwards, B. D., Bennett, W., Mendoza, J. L., & Tubré, T. C. (2005). Ability-based pairing strategies in the team-based training of a complex skill: Does the intelligence of your training partner matter? Intelligence, 33(1),39-65. [ Links ]
De Vries, R. (1974). Relationships among Piagetian, IQ and achievement assessments. Child Development, 45,746-756. [ Links ]
Dickerson, R. E. (2006). Exponential correlation of IQ and the wealth of nations. Intelligence, 34,292-295. [ Links ]
Flynn, J. R. (2007). What is intelligence? Beyond the Flynn Effect. Cambridge: Cambridge University Press. [ Links ]
Frey, Mc., & Detterman, D. K. (2004). Scholastic Assessment or g? The Relationship Between the Scholastic Assessment Test and General Cognitive Ability. Psychological Science, 15,373-378. [ Links ]
Gelade, G. A. (2008a). IQ, cultural values, and the technological achievement of nations. Intelligence, 36,711-718. [ Links ]
Gelade, G. A. (2008b). The geography of IQ. Intelligence, 36,495-501. [ Links ]
Gottfredson, L. S. (2006). Conseqüências sociais das diferenças de grupo em habilidade cognitiva. In C. E. Flores-Mendoza & R. Colom (Eds.), Introdução à psicologia das diferenças individuais (pp. 433-456). Porto Alegre: ArtMed. [ Links ]
Guimarães, A. S. A., & Prandi, J. R. (2002). I Censo Étnico-Racial da Universidade de São Paulo. Relatório substantivo. Departamento de Sociologia, Faculdade de Filosofia, Letras e Ciências Humanas da Universidade de São Paulo, São Paulo. [ Links ]
Higgins, D. M., Peterson, J. B., Pihl, R. O., & Lee, A. G. (2007). Prefrontal cognitive ability, intelligence, Big Five personality, and the prediction of advanced academic and workplace performance. Journal of Personality and Social Psychology, 93,298-319. [ Links ]
Hunt, E. B., & Wittmann, W. (2008). National intelligence and national prosperity. Intelligence, 36,1-9. [ Links ]
Inman, W. C., & Secrest, T. (1981). Piaget's data and Spearman's theory - An empirical reconciliation and its implications for academic achievement. Intelligence, 5,329-344. [ Links ]
Instituto Nacional de Estudos e Pesquisas Educacionais Anísio Teixeira (2009). Resumo Técnico Censo da Educação Superior 2008 (Dados Preliminares). Brasília: DF. [ Links ]
Jensen, A. R. (1998). The g factor. London: Praeger. [ Links ]
Jones, G., & Schneider, W. J. (2006). Intelligence, Human Capital, and Economic Growth: A Bayesian Averaging of Classical Estimates (BACE) Approach. Journal of Economic Growth, 11,71-93. [ Links ]
Jones, G., & Schneider, W. J. (2010). IQ in the production function. Economic Inquiry, 48,743-755. [ Links ]
Kanazawa, S. (2006). IQ and the wealth of states. Intelligence, 34,593-600. [ Links ]
King, C. (2009). Brazilian science on the rise. Science Watch. Retrieved from http://sciencewatch.com/ana/fea/09julaugFea/ [ Links ]
Kroner, S., & Biermann, A. (2007). The relationship between confidence and self-concept - Towards a model of response confidence. Intelligence, 35,580-590. [ Links ]
Lim, T. K. (1988). Relationships between standardized psychometric and Piagetian measures of intelligence at the formal operations level. Intelligence, 12,167-182. [ Links ]
Lubinski, D. (2010). Spatial ability and STEM: A sleeping giant for talent identification and development. Personality and Individual Differences, 49,344-351. [ Links ]
Lynn, R. (2006). Race differences in intelligence. An evolutionary analysis. Washington: Summit Publishers. [ Links ]
Lynn, R., Harvey, J., & Nyborg, H. (2009). Average intelligence predicts atheism rates across 137 nations. Intelligence, 37,11-15. [ Links ]
Lynn, R., & Irwing, P. (2004). Sex differences on the progressive matrices: A meta-analysis. Intelligence, 32,481-498. [ Links ]
Lynn, R., & Meisenberg, G. (2010). National IQs calculated and validated for 108 nations. Intelligence, 38,353-360. [ Links ]
Lynn, R., Meisenberg, G., Mikk, J., & Williams, A. (2007). National IQs predict differences in scholastic achievement in 67 countries. Journal of Biosocial Science, 39,861-874. [ Links ]
Lynn, R., & Mikk, J. (2007). National differences in intelligence and educational attainment. Intelligence, 35,115-121. [ Links ]
Lynn, R., & Vanhanen, T. (2002). IQ and the Wealth of Nations. Westport, CT: Praeger. [ Links ]
Lynn, R., & Vanhanen, T. (2006). IQ and Global Inequality. Washington: Summit Publishers. [ Links ]
Madhyastha, T. M., Hunt, E., Deary, I. J., Gale, C. R., & Dykiert, D. (2009). Recruitment modeling applied to longitudinal studies of group differences in intelligence. Intelligence, 37,422-427. [ Links ]
Mansur-Alves, M., & Flores-Mendoza, C. (2009). Estabilidade temporal e correlatos desenvolvimentais do traço neuroticismo em crianças em fase escolar. Psicologia em Estudo, 14(4),807-815. [ Links ]
Meisenberg, G. (in press). National IQ and economic outcomes. Personality and Individual Differences. [ Links ]
Morse, S. (2008). The geography of tyranny and despair: Development indicators and the hypothesis of genetic inevitability of national inequality. Geographical Journal, 174,195-206. [ Links ]
Natalicio, L. (1968). Aptid o geral, status social e sexo: um estudo de adolescentes brasileiros e norte-americanos. Revista Interamericana de Psicologia, 2,25-34. [ Links ]
Neri, M. C. (2008). A nova classe media. Rio de Janeiro: Fundação Getúlio Vargas/IBRE/CPS. [ Links ]
Paiva, D., Braga, M. S. S., & Pimentel, J. T. P. (2007). Eleitorado e partidos políticos no Brasil. Opinião Pública, 13,388-408. [ Links ]
Peeters, H., & Lievens, F. (2005). Situational judgment tests and their predictiveness of college students' success: The influence of faking. Educational and Psychological Measurement, 65,70-89. [ Links ]
Reed, T. E., Vernon, P. A., & Johnson, A. M. (2004). Confirmation of correlation between brain nerve conduction velocity and intelligence level in normal adults. Intelligence, 32,563-572. [ Links ]
Reeve, C. L. (2009). Expanding the g-nexus: Further evidence regarding the relations among national IQ, religiosity and national health outcome. Intelligence, 37,495-505. [ Links ]
Ren, X., Goldhammer, F., Moosbrugger, H., & Schweizer, K. (in press). How does attention relate to the ability-specific and position-specific components of reasoning measured by APM? Learning and Individual Differences. [ Links ]
Rindermann, H. (2007). The g-Factor of International Cognitive Ability Comparisons: The Homogeneity of Results in PISA, TIMSS, PIRLS and IQ-Tests Across Nations. European Journal of Personality, 21,667-706. [ Links ]
Rindermann, H. (2008). Relevance of education and intelligence at the national level for the economic welfare of people. Intelligence, 36,127-142. [ Links ]
Rindermann, H., Flores-Mendoza, C., & Mansur-Alves, M. (2010). Reciprocal effects between fluid and crystallized intelligence and their dependence on parents' socioeconomic status and education. Learning and Individual Differences, 20,544-548. [ Links ]
Rindermann, H., & Meisenberg, G. (2009). Relevance of education and intelligence at the national level for health: The case of HIV and AIDS. Intelligence, 37,383-395. [ Links ]
Rosseti, M. O., Rabelo, I. S. A., Leme, I. F. A. S., Pacanaro, S. V., & Güntert, I. B. (2009). Evidências de validade das Matrizes Progressivas Avançadas de Raven em universitários. Psico-USF, 14,177-184. [ Links ]
Rushton, J. P., & Templer, D. I. (2009). National differences in intelligence, crime, income, and skin color. Intelligence, 37,341-346. [ Links ]
Sanchez, C. A., Wiley, J., Miura, T. K., Colflesh, G. J. K., Ricks, T. R., Jensen, M. S., & Conway, A. R. A. (2010). Assessing working memory capacity in a non-native language. Learning and Individual Differences, 20,488-493. [ Links ]
Schweizer, K., Goldhammer, F., Rauch, W., & Moosbrugger, H. (2007). On the validity of Raven's matrices test: Does spatial ability contribute to performance? Personality and Individual Differences, 43,1998-2010. [ Links ]
Shatz, S. M. (2008). State IQ and fertility in the United States. Mankind Quarterly, 49,38-49. [ Links ]
Silva Filho, J. H., & Pasian, S. R. (2007). Atualização de normas do Raven Avançado: Discussão de modelos normativos e desenvolvimento do modelo ponderado de normatizações de escores via TRI. Mesa Redonda apresentada III Congresso Brasileiro de Avaliação Psicológica e XII Conferência Internacional de Avaliação Psicológica: Formas e Contextos. João Pessoa, PB. [ Links ]
Sternberg, R. J., & Grigorenko, E. (2002). The general factor of intelligence: How general is it? New Jersey: Lawrence Erlbaum Associates Inc. [ Links ]
Turkheimer, E., Haley, A., Waldron, M., D'Onofrio, B., & Gottesman, I. I. (2003). Socioeconomic status modifies heritability of IQ in young children. Psychological Science, 14,623-628. [ Links ]
Unsworth, N., & Engle, R.W. (2005). Working memory capacity and fluid abilities: Examining the correlation between Operation Span and Raven. Intelligence, 33,67-81. [ Links ]
Whetzel, D. L., & McDaniel, M. A. (2006). Prediction of national wealth. Intelligence, 4,449-458. [ Links ]
Wicherts, J. M. (2009). The impact of papers published in Intelligence 1977-2007 and an overview of the citation classics. Intelligence, 37,443-446. [ Links ]
Wicherts, J. M., Dolan, C. V., & van der Maas, H. L. J. (2010). The dangers of unsystematic selection methods and the representativeness of 46 samples of African test-takers. Intelligence, 38,30-37. [ Links ]
 Address for correspondence:
Carmen Flores-Mendoza
Laboratório de Avaliação das Diferenças Individuais, Departamento de Psicologia - FAFICH - Gab. 4042, Universidade Federal de Minas Gerais
CEP: 31270-901.
Email: carmencita@fafich.ufmg.br / carmenflor@uol.com.br
Received November 11th, 2011
Accepted March 13th, 2012
Published June 30th, 2012
Author note:
This research was supported in part by CAPES Brazil (Carmen Flores-Mendoza, PI. Process n. 6407-10-2), and grant DA 017902 from the National Institute of Drug Abuse and the National Institute of Alcohol Abuse and Alcoholism (Rand Conger, Richard Robins, and Keith Widaman, Joint-PIs).
1 See www.abep.br
2 The average was based on monthly income of 2006 (1R$ = U$2,177) and 2008 (1R$ = U$1,837). In 2006/2008 the monthly income for each class in Real coin was: A1 (7793 / 9733); A2 (4648 / 6563); B1 (2804 / 3479); B2 (1669 / 2012); C (927 / 650 for C1 and 395 for C2); D (424 / 485) and E (207 / 277).
