


Services on Demand
article
 text in
  English (pdf)
 Article in xml format
 Article references
Indicators

Share

 Permalink
Temas em Psicologia
Print version ISSN 1413-389X
Temas psicol. vol.25 no.4 Ribeirão Preto Dec. 2017
http://dx.doi.org/10.9788/TP2017.4-18Pt
ARTIGOS
Psychometric properties of the multidimensional scale of perceived social support
Larissa Maria David Gabardo-Martins; Maria Cristina Ferreira; Felipe Valentini
Universidade Salgado de Oliveira, Niterói, RJ, Brazil
ABSTRACT
Social support can be defined as the perception that there are people who provide individuals with emotional or even financial resources. Perceived social support relates to the perception that support is available if the individual needs it. The present study's aim was to discover, within the Brazilian context, preliminary validity evidence as to the scores of the Multidimensional Scale of Perceived Social Support. The survey involved 831 workers of both sexes, who answered the preliminary version of the scale's questionnaire, containing 12 items. Factor analysis demonstrated that the Brazilian version preserved the original instrument's items and factors (family, friends and significant others). Multigroup analysis demonstrated configural, metric and scalar invariance between groups classified by sex and occupational category (professionals in the areas of exact sciences and humanities). The data we obtained in the present study led us to the conclusion that the scale is an instrument with evidence of internal structure validity, thus permitting its use in future research.
Keywords: Social networks, scaling, statistical validity.
Social support relates to the following: the perception that there are people who provide an individual with emotional or even financial resources; a sense both of belonging and of acceptance in relation to people that are part of the individual's social network (Okun & Lockwood, 2003); the belief that the individual is cared for, loved, respected and valued, due to belonging to a reciprocal communication network (Cobb, 1976). The construct plays an important role in coping with stressful situations, by enabling individuals to meet their needs and achieve their goals through managing the psychological and material resources acquired in personal relationships (Rodriguez & Cohen, 1998). In this sense, it minimizes uncertainty, anxiety and tension, especially when individuals go through problems and crises (Lobburi, 2012), thus contributing to their physical and mental health (Rodriguez & Cohen, 1998).
The aforementioned construct can be of various types, depending on the resources that are available in interpersonal relationships (Rodriguez & Cohen, 1998). In the literature, the most frequently reported types of social support are emotional, instrumental and informational. Emotional social support relates to the care and concern that an individual demonstrates for another, through verbal or nonverbal communication (Hogan, Linden, & Najarian, 2002). Instrumental social support has to do with the concrete support an individual receives from another in order to satisfy her/his material needs (Seeman, 2008). Lastly, informational social support deals with support provided via information (Seeman, 2008).
Social support can be further subdivided into perceived and received. Perceived social support is the awareness that support is available if the individual needs it, while received support occurs when the individual actually receives some form of support (Cramer, Henerson, & Scott, 1997). Focusing specifically on perceived social support, Zimet, Dahlem and Farley (1988) propose that this construct is multidimensional in nature and is divided into three dimensions: family support (the extent to which individuals perceive that they receive support from members of their family); support from friends (the extent to which individuals perceive that they receive support from their friends); and support from significant others (the extent to which individuals perceive that they receive support from others who are not their relatives or friends).
Regarding the assessment of perceived social support, Sarason, Levine, Basham, and Saranson (1983) developed the Sarason Social Support Questionnaire, consisting of 27 items, based on the assumption that social support is divided into two basic items: the perception that there are people available to whom one can resort if one needs to; and the degree of satisfaction with the available support (Sarason et al., 1983). The instrument thus includes two factors: perceived social support and satisfaction with such support. This instrument was translated and studied within the Brazilian context by Matsukura, Marturano and Oishi (2002). The authors affirm that they obtained an acceptable rate of test-retest reliability and a high degree of internal consistency (0.94 for the test and 0.96 for the retest, for both factors).
For Brazilian samples, among the available tools focusing on evaluating perceived social support - based on Rodriguez and Cohen's theory (1998), which classifies social support into emotional, instrumental and informational - is the Scale of Perceived Social Support (Siqueira, 2008), which was originally created in Brazil. By way of exploratory factor-analysis procedures, the author found that the final version of the scale consisted of 29 items divided into two factors (perception of practical and emotional social support), with internal consistency rates of 0.91 and 0.92, respectively.
Another instrument that is based on Rodriguez and Cohen's theory (1998) and which is available for the Brazilian context is the adult version of the Scale of Perceived Social Support (Cardoso & Baptista, 2014), which was also originally created for the Brazilian context. The results of the exploratory factor analysis showed that the final version of the scale was composed of 36 items divided into four dimensions: emotional (α = 0.92), social interactions (α = 0.75), instrumental (α = 0.82) and coping with problems (α = 0.83).
In summary, regarding the assessment of perceived social support, in the Brazilian literature one can find instruments that were originally developed or adapted for Brazilian samples. Nonetheless, one of the tools most used abroad for assessing perceived social support is the Multidimensional Scale of Perceived Social Support (MSPSS; Zimet et al., 1988), which is based on the premise of the perception that social support comes from three specific sources, members of the individual›s social network: family, friends and significant others. According to the authors, the division of the construct into three factors allows for a more accurate assessment of the perception of social support received by the individual because the other scales do not consider the possibility of social support emanating from different sources.
In the study concerning the construction and validity evidence of MSPSS scores, 275 US university students were surveyed (Zimet et al., 1988). The results of the exploratory factor analysis led to a final version of the scale consisting of 12 items divided into the three factors that were predicted theoretically: family, friends and significant others. The internal consistency rates (Cronbach›s alpha) for these three factors were 0.87, 0.85 and 0.91, respectively, with the entire instrument exhibiting an alpha of 0.88.
The MSPSS has been undergoing tests of its psychometric properties in various countries such as the United States (Aroian, Templin, & Ramaswamy, 2010), Portugal (Carvalho Pinto-Gouveia, Pimentel, Maia, & Mota Pereira, 2011), Thailand (Wongpakaran, Wongpakaran, & Ruktrakul, 2011) and the Republic of Malawi (Stewart, Umar, Tomenson, & Creed, 2014). In all of these studies, the scale's structure of three primary factors was confirmed and the scale exhibited good internal consistency rates (Cronbach's alphas ranging from 0.85 to 0.93). Nonetheless, Mantuliz and Castillo's study (2002) of hypertensive Chileans and Chou's study (2000) of Chinese teenagers did not replicate the three-factor structure; instead, they resulted in a two-factor structure, with the items of the "significant others" factor being added to the family factor.
Although this scale is one of the scales that are most often used abroad, a survey conducted in June 2015 of the Brazilian literature in the Scientific Electronic Library Online (Sci-ELO) and Periódicos Eletrônicos de Psicologia (PePSIC) databases revealed that this instrument still does not provide proof of structural validity within the Brazilian context. Additional research aimed at providing initial proof of the validity of MSPSS scores in Brazilian samples is thus justified. Such investigations will be able to provide Brazilian researchers with a perceived-support assessment tool with possibilities of being adopted in analyses of the construct's implications with respect to the wellbeing and life quality of workers, since it plays an important protective role by reducing the impact of organizational environment stressors (Carlson & Perrewé, 1999). The present study thus aimed to evaluate the internal structure, internal consistency and invariance of the parameters of the instrument's items in terms of gender and occupational category (for professionals in the areas of exact sciences and humanities).
The invariance of an instrument is a fundamental factor for the development and use of psychometric tools due to making it possible to draw conclusions as to the invariance of the instrument's configuration and parameters in different groups, which will guarantee its future use in such groups (Cheung & Rensvold, 2002). Based on such considerations, we hypothesized that the MSPSS's items would be invariant with respect to sex and occupation.
Method
Participants
A total of 831 workers from 25 Brazilian states and from the Federal District participated in this study, with the greatest number of participants coming from the states of São Paulo (22.9%) and Rio de Janeiro (16.5%). Most examinees were female (67.4%). With regard to occupational category, 77.3% were in the humanities field; and 22.7%, exact sciences. As to schooling, 68.6% had completed or were still taking graduate courses, with or without a major. The age of the professionals ranged from 18 to 67 years (M = 34.41; SD = 10.73) and their years of service ranged from 1 to 48 years (M = 8.44, SD = 9.26). The only requirement for inclusion in the study was that the person must have already been working for at least one year, since one of the study's objectives was to provide Brazilian researchers with a perceived-support assessment tool capable of being adopted in future studies focused on analyzing the construct's implications in terms of the wellbeing and life quality of workers.
Instrument
In order to measure perceived social support, we used the Multidimensional Scale of Perceived Social Support (MSPSS), which was developed by Zimet et al. (1988). This instrument consists of 12 items (statements) divided into three factors (family, friends and significant others). Examinees must classify these items according to a Likert seven-point scale ranging from "1 = very strongly disagree" to "7 = very strongly agree." Sample item: "My family really tries to help me." In order to translate the scale, we adopted the translation/back-translation process, which consists of translating the items into Portuguese and then translating this version back into English and comparing the two versions in order to check for conceptual equivalence (Borsa, Damásio, & Bandeira, 2012). Adhering to several recommendations of these authors, the original instrument was first translated from English into Portuguese by a researcher fluent in English. The Portuguese version was then translated back into English by an English teacher. Finally, two researchers in the field of scale adaptation conducted a technical revision and an assessment of the semantic equivalence of the two English versions. The data collection instrument also featured questions designed to gather socio-demographic information about the participants, such as age, sex, educational level, profession, marital status, years of service and state of residence.
Data Collection Procedure
Data collection was conducted online, and a form was created using the Google Docs app. Individuals were invited to participate via messages on two social networking sites, Facebook and LinkedIn, which also provided the link to the questionnaire.
Data Analysis Procedure
In order to assess the dimensionality of the MSPSS scores, the data was examined by way of parallel analysis (with 200 resamples, and the 95th percentile of random eigenvalues), Exploratory Graphical Analysis (EGA; Golino & Epskamp, 2017) and the comparison of rival models via structural equation modeling. EGA is a recently developed technique that uses network analysis coupled with algorithms to detect factors subjacent to the data. This technique is more accurate than parallel analysis for estimating the true number of factors, especially for structures with high correlations between factors and a small number of items per factor (Crawford et al., 2010; Golino & Epskamp, 2017; Ruscio & Roche, 2012).
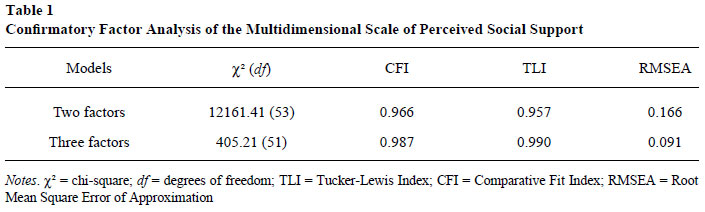
For the confirmatory factor analyses (CFAs), the parameters of the items and of the participants were estimated via the weighted least square mean and variance adjusted (WLSMV) method, expressing the items as ordinal categorical variables. The following fit indexes were analyzed, taking into account Byrne's recommendations (2012): the Chi-Square index (tests the difference between the empirical matrix and the matrix of the theoretical model; the higher the value of χ2, the worse the fit); the Root Mean Square Error of Approximation index (RMSEA - must be less than 0.08; values of up to 0.10 are acceptable); the Tucker-Lewis Index (TLI - models with values above 0.95 are acceptable); and the Comparative Fit Index (CFI - values above 0.95 are acceptable). Statistical power was estimated by way of Monte Carlo simulation studies, as was suggested by Muthén and Muthén (2002). Within this context, the following criteria were assessed: parameter biases less than 10% (i.e. [parameter - average of simulated parameters] /parameter); estimation error biases less than 5%; coverage higher than 0.90 (the coverage value indicates the proportion of replications for which the 95% CI contains the true parameter value).
The internal consistency of the instrument was calculated using Cronbach's alpha, average variance extracted and composite reliability. To assess the invariance of item parameters between groups separated by sex and academic area, we used multigroup structural equation modeling (Damásio, 2013). Accordingly, models were tested in which we fixed the number of items and factors (configural invariance), the factor loadings (metric invariance) and the thresholds and scalars (scalar invariance). The differences between the model settings were evaluated by way of the differences of chi-square (Δχ2) and CFI (ΔCFI). The data was analyzed using Mplus (v. 7:11) and R software.
Ethical Procedures
The study was submitted to the Research Ethics Committee of the authors' institution, receiving ruling number 689,286. Consent to participate in the study was obtained via informed consent forms.
Results
Analysis of the Structure and Internal Consistency
The literature on the structure of the scale presents evidence of designs with two and three dimensions. Accordingly, we sought to evaluate the dimensionality of the scores, initially via parallel analysis. This method indicated the extraction of two dimensions (the first four eigenvalues: empirical 7.13 /1.88 /0.87 /0.37; and random 1.25 /1.18 /1.38 /1.1). In this context, the model would combine the "Family" and "Significant Others" dimensions and preserve the original "Friends" dimension.
Nonetheless, the EGA specified extracting three dimensions (Figure 1). In the graph, the thickness of the line connecting two variables indicates the strength of their relationship. Thus, it can be seen in Figure 1 that the internal relationships between items in a single dimension are stronger than their relationships with items in the other dimensions. This result points to three distinct dimensions.
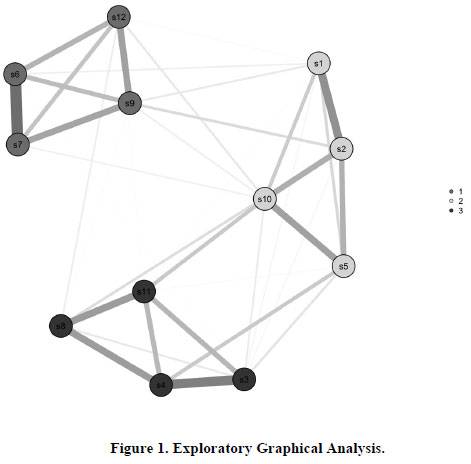
In order to broaden the discussion of dimensionality, we sought, by way of structural equation modeling, to test how well the following two models fit the data: (a) two dimensions, in accordance with the configuration of items and factors specified by Chou (2000) and Mantuliz and Castillo (2002); and (b) three dimensions, as in the original model of the scale (Zimet et al., 1988). The results showed that the three-factor model (family, friends and significant others) from Zimet's original scale (1988) exhibited the best fit-indexes when compared with the two-factor model (family-significant others and friends; Table 1). Figure 2 displays the graphical representation of the three-factor model and the standardized factor loadings of the items.
As regards the discriminant validity of latent scores, the model shown in Figure 2 indicates a high correlation (0.81) between the "significant others" and "family" dimensions. This correlation could be an indication of lack of discriminant validity. However, high factor loadings were observed among the items of these dimensions (average factor loading: Significant Others = 0.88; Family = 0.91), higher than the correlation between the latent dimensions. These results indicate that most of the item variance explained by the model (i.e. disregarding the measurement error) can be attributed to the latent factors and not to the correlation between the factors. The present study's results thus show that the Significant Others and Family dimensions are distinct constructs (discriminant validity), although highly correlated.
The Brazilian version of the Multidimensional Scale of Perceived Social Support was thus made up of three factors, with four items each. In addition, the average variance extracted was 0.84 (friends), 0.82 (family) and 0.78 (significant others); and the composite reliability was 0.96 (friends), 0.95 (family) and 0.93 (significant others). Calculated using Cronbach's alpha, the internal consistency of the scale factors was 0.93 (Friends), 0.91 (family) and 0.90 (significant other). These results indicate that the scores of the three factors can be estimated with great precision, even with a small number of items.
Simulations with databases of 831 subjects were also conducted. In all of them, the bias values of the factor loadings and of the correlations between the factors were less than 0.001; the estimation error bias varied from 0 to 0.02; and the coverage ranged from 0.94 to 0.95. These results indicate that the estimation of the model's parameters was performed with statistical power greater than 0.80.
Invariance Analysis
Believing to have discovered a first-order three-dimensional model, we sought, through multigroup confirmatory factor analysis (MCFA), to assess the invariance of the item parameters between male and female participants and between workers in the areas of exact sciences and humanities. The MCFA results are shown in Table 2.
With respect to the parameter invariance between the male and female groups, the imposition of restrictions led to small, almost negligible differences in the indicators analyzed. We underscore the fact that the differences in chi-square between the more restricted and less restricted models were not statistically significant (i.e. Δχ2 /Δdf <1.96), and the differences in CFI were less than 0.01. These results indicate that, for the first-order three-factor model, the factor loadings, thresholds and scalars were invariant between males and females (Cheung & Rensvold, 2002).
With respect to workers in the fields of humanities and exact sciences, the results also demonstrated the instrument's configural, metric and scalar invariance, since the differences occasioned by the restrictions were practically negligible and were not statistically significant. In this sense, the item parameters of the Multidimensional Scale of Perceived Social Support are not biased by the occupational field variable. Even in relation to the simulations conducted using the databases of 189 subjects (sample size of the smallest group examined, i.e. exact sciences), the statistical power was greater than 0.80, evidence that the different sizes of the groups examined via factorial invariance analysis did not influence the results.
Discussion
The present study focused on examining validity evidence of the MSPSS's internal structure, as well as its internal consistency and the invariance of item parameters. The results of both the Exploratory Graphical Analysis (EGA) and the Confirmatory Factor Analysis (CFA) pointed to the appropriateness of a three-dimensional model. The contradictory result of the parallel analysis, which indicated the extraction of only two dimensions, can be explained by this method's limitations: It tends to minimize the number of dimensions of models with high correlations between factors and a small number of items per factor (Crawford et al., 2010; Golino & Epskamp, 2017; Ruscio & Roche, 2012).
It is important to emphasize that the firstorder, three-factor model evaluated by the CFA was configured based on the instrument's original theoretical structure, thus preserving the hypothetical-deductive character of the analysis. Accordingly, the model confirms the instrument's original structure (Zimet et al., 1988), and it is consistent with the results of other studies of evidence of the validity of the scores (Aroian et al., 2010; Carvalho et al., 2011; Stewart et al., 2014; Wongpakaran et al., 2011). The three-factor model also demonstrates consistency with the theory of Zimet et al. (1988), according to which the perceived social support construct is multidimensional to the extent that the social support comes from various sources of the individual's social group.
Nevertheless, studies by Mantuliz and Castillo (2002) of a sample of hypertensive Chileans and a survey by Chou (2000) of Chinese adolescents did not replicate the three-factor structure; instead, they obtained a two-factor structure for the scale. In the present investigation, however, such a two-factor model exhibited a lower fit index than that of the original three-dimensional model. In this sense, the present study provides further evidence that the true model for the scale is closer to the three-factor model than to the two-factor model.
It should be noted, however, that the three-factor model showed a high correlation between the Family and Significant Others dimensions, yet lower than the average factor loadings for these dimensions. The higher correlation observed between these two dimensions converges with the results of other studies (Bruwer, Ems-ley, Kidd, Lochner, & Seedat, 2008; Wongpakaran et al., 2011), although in those studies the three-factor solution also presented better goodness-of-fit to the data. This result could be due to the fact that the meaning of "family" as a source of support is likely to change throughout the individual's life cycle, as in the case of individuals who have already formed their own families and come to see them also as their main source of support, in terms of people who are significant to the individual (Zimet et al., 1988). In any event, such assertions need to be confirmed in future studies.
The VME, CC and Cronbach's-alpha precision indicators exhibited high numerical values. The present study's results are similar to those observed in other contexts, such as the United States (Zimet et al., 1988), Portugal (Carvalho et al., 2011), Thailand (Wongpakaran et al., 2011) and the Republic of Malawi (Stewart et al., 2014). Similarly, the Cronbach's alpha observed in the general factor was also similar to that of other studies (Carvalho et al., 2011; Stewart et al., 2014; Wongpakaran et al., 201; Zimet et al., 1988). These results indicate that the scale's scores generally exhibit a satisfactory degree of accuracy in samples of different nationalities.
The results of the multigroup confirmatory factor analyses (MCFAs) demonstrated that the scale exhibited no response biases for men and women or for workers in the fields of exact sciences and humanities. Accordingly, one may affirm that the perceived social support scores obtained using the scale are invariant for these groups, which can thus be compared to each other. Such results can also be considered an indicator that the parameters of the scale items are stable in samples with different profiles.
Final Considerations
The present study's results indicate that the Multidimensional Scale of Perceived Social Support displayed internal structure validity evidence, satisfactory internal consistency and item parameter invariance. However, the study's limitations also merit discussion. One such limitation was the fact that the instrument we used was a self-report inventory; and examinees' responses on such inventories are not necessarily consistent with reality. Another limitation was that most of the sample was of a single region of Brazil, the Southeast, which makes it difficult to generalize the results for other Brazilian regions. Lastly, the number of humanities examinees was much higher than that of exact science examinees; and the amount of female participants was greater than that of male participants. It should be noted, however, that the statistical power was higher than 0.80 for all groups.
Concerning future research, we recommend conducting studies aimed at expanding the nomological network of perceived social support, especially with regard to the impact of the "family," "friends" and "significant others" factors on workers' well-being and life quality. Such studies could be of a longitudinal nature in order to gain a better understanding of the relationships between these variables. We also suggest performing comparative studies of groups with other characteristics, such as adolescents and adults, which probably have different perceptions as to social support. Despite the limitations mentioned above, the results we obtained permit concluding that the Brazilian version of the Multidimensional Scale of Perceived Social Support is an appropriate instrument for assessing (in Brazilian samples) an individual's perception of the social support received from family, friends and significant others.
References
Aroian, K. J., Templin, T. N., & Ramaswamy, V. (2010). Adaptation and psychometric evaluation of the Multidimensional Scale of Perceived Social Support for Arab immigrant women. Health Care for Women International, 31(2),153-169. doi: 10.1080/07399330903052145 [ Links ]
Borsa, J. C., Damásio, B. F., & Bandeira, D. R. (2012). Adaptação e validação de instrumentos psicológicos entre culturas: Algumas considerações. Paidéia (Ribeirão Preto), 22(53),423-432. doi: 10.1590/S0103-863X2012000300014 [ Links ]
Bruwer, B., Emsley, R., Kidd, M., Lochner, C., & Seedat, S. (2008). Psychometric properties of the Multidimensional Scale of Perceived Social Support in youth. Comprehensive Psychiatry, 49(2),195-201. doi: 10.1016/j.comppsych.2007.09.002 [ Links ]
Byrne, B. M. (2012). Structural equation modeling with Mplus: Basic concepts, applications, and programing. New York: Routledge. [ Links ]
Cardoso, H. F., & Baptista, M. N. (2014). Escala de Percepção de Suporte Social (versão adulta) - EPSUS-A: Estudo das qualidades psicométricas. Psico-USF, 19(3),499-510. doi: 10.1590/141382712014019003012 [ Links ]
Carlson, D. S., & Perrewé, P L. (1999). The role social support in the stressor-strain relationship: An examination of work-family conflict. Journal of Management, 25(4),513-540. doi: 10.1177/014920639902500403 [ Links ]
Carvalho, S., Pinto-Gouveia, Pimentel, P., Maia, D., & Mota-Pereira, J. (2011). Características psicométricas da versão portuguesa da Escala Multidimensional de Suporte Social Percebido (Multidimentional Scale of Perceived Social Support - MSPSS). Psychologica, (54),331-357. doi: 10.14195/1647-8606_54_13 [ Links ]
Cheung, G. W., & Rensvold, R. B. (2002). Evaluating goodness-of-fit indexes for testing measurement invariance. Structural Equation Modeling, 9(2),233-255. doi: 10.1207/S15328007SEM0902_5 [ Links ]
Chou, K. L. (2000). Assessing Chinese adolescents' social support: The Multidimensional Scale of Perceived Social Support. Personality and Individual Differences, 28(2),299-307. doi: 10.1016/S01918869(99)00098-7 [ Links ]
Cobb, S. (1976). Social support as a moderator of life stress. Psychosomatic Medicine, 38(5),300-314. doi: 10.1097/00006842-197609000-00003 [ Links ]
Cramer, D., Henderson, S., & Scott, R. (1997). Mental health and desired social support: A four-wave panel study. Journal of Social and Personal Relationships, 14(6),761-775. doi: 10.1177/0265407597146003 [ Links ]
Crawford, A. V., Green, S. B., Levy, R., Lo, W. J., Scott, L., Svetina, D., & Thompson, M. S. (2010). Evaluation of parallel analysis methods for determining the number of factors. Educational and Psychological Measurement, 70,885-901. doi: 10.1177/0013164410379332 [ Links ]
Damásio, B. F. (2013). Contribuições da análise fatorial confirmatória multigrupo (AFCMG) na avaliação de invariância de instrumentos psicométricos. Psico-USF, 18(2),211-220. doi: 10.1590/S1413-82712013000200005 [ Links ]
Golino, H. F., & Epskamp, S. (2017). Exploratory graph analysis: A new approach for estimating the number of dimensions in psychological research. Plos One. doi: https://doi.org/10.1371/journal.pone.0174035 [ Links ]
Hogan, B., Linden, W., & Najarian, B. (2002). Social support interventions: Do they work? Clinical Psychology Review, 22(3),381-440. doi: 10.1016/s0272-7358(01)00102-7 [ Links ]
Lobburi, P. (2012). The influence of organizational and social support on turnover intention in collectivist contexts. Journal of Applied Business Research, 28(1),93-104. doi: 10.19030/jabr.v28i1.6687 [ Links ]
Mantuliz, M., & Castillo, C. (2002). Validación de una escala de apoyo social percibido en un grupo de adultos mayors adscritos a un programa de hypertension de la region metropolitan. Ciencia y Enfermeria, 8(1),49-55. doi: 10.4067/S07175532002000100007 [ Links ]
Matsukura, T. S., Marturano, E. M., & Oishi, J. (2002). O questionário de suporte social (SSQ): Estudos de adaptação para o português. Revista Latino-Americana de Enfermagem, 10(5),675-681. doi: 10.1590/S0104-11692002000500008 [ Links ]
Muthén, L. K., & Muthén, B. O. (2002). How to use a Monte Carlo study to decide on sample sizes and determine power. Structural Equation Modeling, 9(4),599-620. doi: 10.1207/S15328007SEM0904_8 [ Links ]
Okun, M. A., & Lockwood, C. M. (2003). Does level of assessment moderate the relation between social support and social negativity? A meta-analysis. Basic and Applied Social Psychology, 25(1),15-35. doi: 10.1207/S15324834BASP2501_2 [ Links ]
Rodriguez, M. S., & Cohen, S. (1998). Social support. Encyclopedia of Mental Health, 3,535-544. Retrieved from http://www.psy.cmu.edu/~scohen/socsupchap98.pdf [ Links ]
Ruscio, J., & Roche, B. (2012). Determining the number of factors to retain in an exploratory factor analysis using comparison data of known factorial structure. Psychological Assessment, 24(2),282-292. doi: 10.1037/a0025697 [ Links ]
Sarason, I. G., Levine, H. M., Basham, R. B., & Sarason, B. R. (1983). Assessing social support: The social support questionnaire. Journal of Personality and Social Psychology, 44(1),127-139. doi: 10.1037//0022-3514.44.1.127 [ Links ]
Seeman, T. (2008). Social & social conflict: Section one - Social support. Retrieved from http://www.macses.ucsf.edu/research/psychosocial/socsupp.php. [ Links ]
Siqueira, M. M. M. (2008). Construção e validação da Escala de Percepção de Suporte Social. Psicologia em Estudo, 13(2),381-388. Recuperado em http://www.scielo.br/pdf/pe/v13n2/a21v13n2 [ Links ]
Stewart, R. C., Umar, E., Tomenson, B., & Creed, F. (2014).Validation of the multi-dimensional scale of perceived social support (MSPSS) and the relationship between social support, intimate partner violence and antenatal depression in Malawi. BioMed Central Psychiatry, 14(1),1-11. doi: 10.1186/1471-244X-14-180 [ Links ]
Wongpakaran, T., Wongpakaran, N., & Ruktrakul, R. (2011). Reliability and validity of the Multidimensional Scale of Perceived Social Support (MSPSS): Thai version. Clinical Practice & Epidemiology in Mental Health, 7,161-166. doi: 10.2174/1745017901107010161 [ Links ]
Zimet, G. D., Dahlem, N., Zimet, S., & Farley, G. (1988). The Multidimensional Scale of Perceived Social Support. Journal of Personality Assessment, 52(1),30-41. doi: 10.1207/s15327752jpa5201_2 [ Links ]
 Mailing address:
Larissa Maria David Gabardo-Martins
Rua Sérvulo Mello, 56, Caju, Silva Jardim
Niterói, RJ, Brazil 28820-000
Phone: 22 998578802
E-mail: laragabardo@yahoo.com.br
Received: 27/04/2016
1st revision: 04/05/2016
2nd revision: 03/10/2016
Accepted: 11/10/2016

