


Serviços Personalizados
Journal

artigo
 Inglês (pdf)
 Artigo em XML
 Referências do artigo
Indicadores
Compartilhar

 Permalink
Temas em Psicologia
versão impressa ISSN 1413-389X
Temas psicol. vol.26 no.4 Ribeirão Preto out./dez. 2018
https://doi.org/10.9788/TP2018.4-17Pt
ARTIGOS
Perceção da saúde: validação de uma escala para a população portuguesa
Percepción de la salud: validación de una escala para la población portuguesa
Teresa Soares SoutoI; Ana RamiresII; Ângela LeiteIII; Vanessa SantosIV; Raquel Espírito SantoV
IOrcid.org/0000-0001-7268-1747. Universidade Lusófona do Porto, Porto, Portugal
IIOrcid.org/0000-0002-3028-0563. Universidade Europeia, Lisboa, Portugal
IIIOrcid.org/0000-0003-0560-1756. Universidade Europeia, Lisboa, Portugal
IVOrcid.org/0000-0003-2197-3971. Universidade Lusófona do Porto, Porto, Portugal
VOrcid.org/0000-0003-0632-6338. Universidade Lusófona do Porto, Porto, Portugal
RESUMO
A validade do construto perceção da saúde tem aumentado ao longo do tempo; as pessoas avaliam melhor a sua saúde devido a um acréscimo da escolaridade. Diferentes instrumentos têm sido desenvolvidos para avaliar esta dimensão da saúde. Este estudo tem como objetivo a validação para a população adulta portuguesa do Health Perception Questionnaire, dada a inexistência no contexto português de instrumento validado que avalie a perceção da saúde. É um instrumento de autoresposta que avalia a perceção da saúde em três momentos - passado, presente e futuro, a resistência e atitudes em relação à doença. Participaram 1,139 sujeitos da população geral, com idades entre os 18 e os 79 anos e maioritariamente mulheres. Foram realizadas análises fatoriais exploratória e confirmatória, tendo sido encontrado um modelo de 2.ª ordem, onde a perceção da saúde se define em torno de dois fatores - saúde atual (sete itens) e saúde anterior (dois itens). A vivência de doença grave ou significativa, assim como o bem-estar e a saúde, assumem-se como elementos chave na construção individual da perceção de saúde anterior e atual respectivamente.
Palavras-chave: Psicologia, saúde, medicina do comportamento, estudos de validação, psicometria.
RESUMEN
La validez del constructo percepción de la salud ha aumentado a lo largo del tiempo; las personas evalúan mejor su salud debido al aumento en el nivel de escolaridad. Diferentes instrumentos se han desarrollado para evaluar esta dimensión de la salud. Este estudio tiene como objetivo la validación para la población adulta portuguesa del Health Perception Questionnaire, en ausencia de instrumento validado para evaluar la percepción de la salud en el contexto portuguése Es un instrumento de autorespuesta que evalúa la percepción de la salud en tres momentos - pasado, presente y futuro, la resistencia y actitudes en relación a la enfermedad. Participaron1,139 sujetos de la población general, con edades entre los 18 y los 79 años y mayoritariamente mujeres. Se realizaron análisis factoriales exploratorios y confirmatorios, habiendo sido encontrado un modelo de 2ª planta, donde la percepción de la salud se define en torno a dos factores - salud actual (siete ítems) y salud anterior (dos ítems). La vivencia de enfermedad grave o significativa, así como el bienestar y la salud, se asumen como elementos clave en la construcción individual de la percepción de salud anterior y actual respectivamente.
Palabras clave: Psicologia, salud, medicina de la conducta, estudios de validación, psicometría.
Enquadramento Teórico
O Constructo de Perceção da Saúde
A perceção é um processo em que o indivíduo organiza os estímulos sensoriais em informações significativas (Hamlyn, 2017; Ross, 2010). Embora muitos autores tenham procurado definir o conceito de saúde, cada pessoa tem uma perspetiva individual de saúde e de doença (Azêdo, 2010; Saleh et al., 2017; Santos, Barbosa, Faro, & Alves, 2005) e, portanto, da sua própria saúde. Na perspectiva do doente, a saúde diz respeito à capacidade de viver expressa no estado de saúde (Krabbe, 2016), referindo-se à forma como o sujeito a percebe tendo em conta os estímulos recebidos, não se centrando apenas nas indicações médicas objetivas mas sim na avaliação da sua saúde aos níveis físico e mental (McPherson, Melvin, Belew, & McGraw, 2016; Vintém, 2008). "A perceção de saúde engloba o bem-estar tanto físico como mental e, para alguns, até a própria realização espiritual" (Crown, 2012, p. 791). Trata-se de crenças pessoais e avaliações do estado geral da saúde que mostram o modo como as pessoas consideram estar bem ou não. É um conceito subjetivo, podendo as perceções refletir mais os sentimentos e crenças do que o seu estado físico atual (Ware, Johnston, Davies-Avery, & Brook, 1979; Ware & Karmos, 1976). As percepções gerais da saúde representam uma integração de vários conceitos de saúde como a saúde mental (Post, 2014).
Durante os últimos anos, os investigadores têm constatado que as perceções individuais afetam os comportamentos saudáveis (e.g., Coleman, Hicks-Coolick, & Brown, 2015; Rubin et al., 2016). De acordo com um estudo do Gabinete de Estatísticas da União Europeia (Eurostat, 2015) relativo à perceção de saúde da população da União Europeia, destacam-se dois indicadores centrais: a perceção de saúde, enquanto indicador global relativamente à saúde em geral, e a morbidade crónica como avaliação da presença de doenças de longa duração ou de problemas de saúde. Dois em cada três europeus com idade superior a 16 anos percecionam a sua saúde como muito boa ou boa. Particularmente, em Portugal, cerca de 46% da população relata essa mesma perceção, porém, com uma discrepância de género muito acentuada, tendendo os homens a avaliar mais favoravelmente a sua saúde do que as mulheres (Eurostat, 2015). A perceção de saúde varia de país para país (Assari, 2014; Assari & Lankarani, 2015).
Estudos na população geral indicam que a perceção de saúde é um preditor importante dos resultados no domínio da saúde (Goodwin & Engstrom, 2002; Zahrt & Crum, 2017). Esse valor preditivo pode ser explicado pelo papel desempenhado pelas características da personalidade na forma como individualmente é percebida a existência ou não de problemas médicos. A perceção acerca da saúde é decisiva na tomada de decisão no âmbito da intervenção em saúde, pois prediz a utilização de cuidados adequados (Cloninger & Zohar, 2011). A perceção de saúde tem sido estudada relacionada com: a perceção de doença (e.g., Meuleman, Chilcot, Dekker, Halbesma, & van Dijk, 2017), a qualidade de vida (e.g., Shetty, Wertheim, & Butt, 2017), os resultados em saúde (e.g., Conner & Norman, 2017), o bem-estar geral (e.g., Salloum, Cloninger, Salvador-Carulla, & Otero, 2016), o bem-estar psicológico (e.g., Fastame, Hitchcott, & Penna, 2017), a felicidade (e.g., Ngnoumen & Langer, 2016), a depressão (e.g., Oliveira et al., 2016), com a ansiedade (e.g., Lee & Sung, 2017), entre outros.
A validade do construto perceção da saúde tem aumentado ao longo do tempo; as pessoas avaliam melhor a sua saúde devido a um acréscimo do seu nível de escolaridade e das competências cognitivas, bem como a uma crescente exposição a informações de saúde, sendo a fonte de informação relevante (Schnittker & Bacak, 2014).
Instrumentos que Avaliam a Perceção de Saúde e da Doença
De acordo com a literatura, existem mais instrumentos que avaliam a perceção da doença do que a da saúde. Entre os que avaliam a perceção da doença, destacam-se:
The Brief Illness Perception Questionnaire (Brief IPQ) de Ng (2012) cujas dimensões são: identidade da doença, causa da doença, tempo da doença, consequências da doença e controlo da doença).
The Revised Illness Perception Questionnaire (IPQ-R) de Moss-Morris e colaboradores (2002), cujas dimensões são: identidade da doença, tempo da doença (aguda / crónica), tempo da doença (cíclica), consequências da doença, controle pessoal sobre a doença, controle do tratamento da doença, representações emocionais sobre a doença, coerência da doença, atribuições psicológicas da doença, atribuições de fatores de risco da doença, atribuições de imunidade à doença e atribuições de oportunidade face à doença.
Entre os que avaliam a perceção da saúde, salientam-se: Perception of Health Scale (PHS) de Diamond, Becker, Arenson, Chambers e Rosenthal (2007) cujas dimensões são: auto-controle, autoconsciência, certeza e importância da saúde.
36-Item Short Form Survey (SF-36) de Ware e Sherbourne (1992) cujas dimensões são: limitações nas atividades físicas devido a problemas de saúde; limitações nas atividades sociais devido a problemas físicos ou emocionais; limitações nas atividades funcionais habituais devido a problemas de saúde física; dor corporal; saúde mental geral -sofrimento psicológico e bem-estar; limitações nas atividades de funções habituais devido a problemas emocionais; vitalidade - energia e fadiga; e percepções gerais da saúde.
General Health Questionnaire (GHQ) de Goldberg e Hillier (1979) cujas dimensões avaliadas são: sintomas somáticos, ansiedade e insónia, disfunção social e depressão grave.
Health Percepcion Questionnnaire (Questionário de Perceção da Saúde, HPQ) de Ware (1976) cujas dimensões são: saúde atual, saúde anterior, perspetivas de saúde, resistência à doença, preocupação com a saúde e orientação da doença. As dimensões saúde atual, saúde passada e perspetivas de saúde permitem-nos conhecer a perceção de saúde ao longo do tempo, respetivamente, passado, presente e futuro. A dimensão resistência à doença avalia a vulnerabilidade individual sentida face ao adoecer. A dimensão preocupação com a saúde exprime a importância atribuída à saúde na sua vida e, finalmente, a orientação da doença relaciona-se com os comportamentos adotados face à doença. Esta última dimensão difere bastante das três primeiras, na medida em que se relaciona com os comportamentos de saúde que resultam de uma combinação de conhecimento, práticas e atitudes que contribuem para motivar as ações tomadas em relação à saúde; os comportamentos de saúde estão, ainda, relacionados com os resultados em saúde (Conner & Norman, 2017).
No contexto português, não existe nenhum instrumento validado que avalie a perceção da saúde, pelo que o presente estudo pretende colmatar esta lacuna, tendo como objetivo a validação do HPQ para a população portuguesa. Esta escolha decorre do fato de este instrumento avaliar a perceção da saúde ao longo do tempo (passado, presente e perspetivas futuras), permitindo uma análise temporal do construto; além disso, aprecia especificamente o constructo perceção da saúde, sendo um dos mais utilizados em investigação (e.g., Anthony & Barry, 2009; Lee & Oh, 2013; Michaelson, Pickett, Vandemeer, Taylor, & Davison, 2016; Tourani et al., 2018). Espeficamente, Anthony e Barry (2009) salientam que as pontuações obtidas nas subescalas saúde anterior e resistência a doença diferiram significativamente em função da variavel sexo - os homens obtinham em media resultados mais elevados do que as mulheres. Já relativamente aos resultados da subescala preocupação com a saúde, estes diferiram, entre os participantes em condição de sem-abrigo, de acordo com a fonte de saúde por estes relatada.
No âmbito da perceção de saúde, Michaelson e colaboradores (2016) destacam que a pereceção de boa saúde estará associada ao facto de esta ser personalizada e subjetiva. Por outro lado, Tourani e colegas (2018) referem que quer a avaliação quer a avaliação dos resultados em saúde permitem aferir o desempenho dos planos de saúde e respetivo impacto, constituindo um fonte de informação para os decisores no que âmbito da efetiva adoção de decisões baseadas em evidências científicas. Finalmente, Lee e Oh (2013) destacaram que a preocupação e ansiedade com a saúde (sub-variáveis da perceção da saúde) afetaram o benefício percebido, assim como, a barreira percebida (sub-variáveis da crença sobre a saúde) e que as preocupações e ansiedade com a saúde afetaram significativamente o exercício fisico orientado, a procura de passatempos (sub-variáveeis associadas à satisfação com a vida) e atividades dirigidas para o bem-estar.
Das vantagens do HPQ destacam-se o fato de ter sido um dos instrumentos que originou o SF-36, um instrumento de 36 itens (Ware & Sherbourne, 1992) usado na avaliação do estatuto da saúde no Medical Outcomes Study (MOS) e ter sido aplicado no Rand Health Insurance Experiment (RHIE), sendo usado como preditor da utilização dos cuidados de saúde mental (Ware et al., 1979).
Método
Participantes
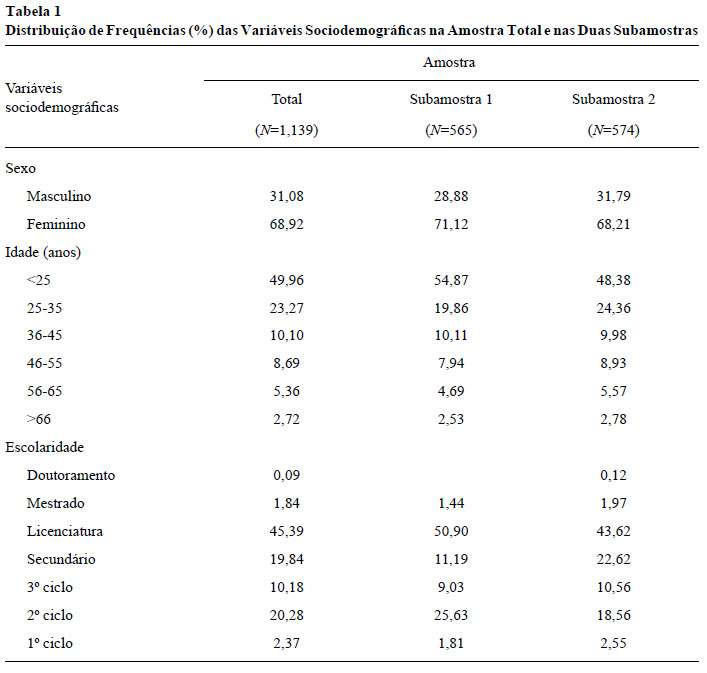
A amostra total é composta por 1,139 sujeitos provenientes da população adulta portuguesa geral: a maioria (69%) é do sexo feminino; a idade varia entre 17 e 79 anos, metade dos inquiridos apresenta menos de 25 anos e a média das idades é 31 anos (DP 13,45); cerca de metade dos participantes no estudo (47%) possui um grau académico superior e, em partes aproximadamente iguais (20% cada), o 2º ciclo e o ensino secundário completos (Tabela 1).
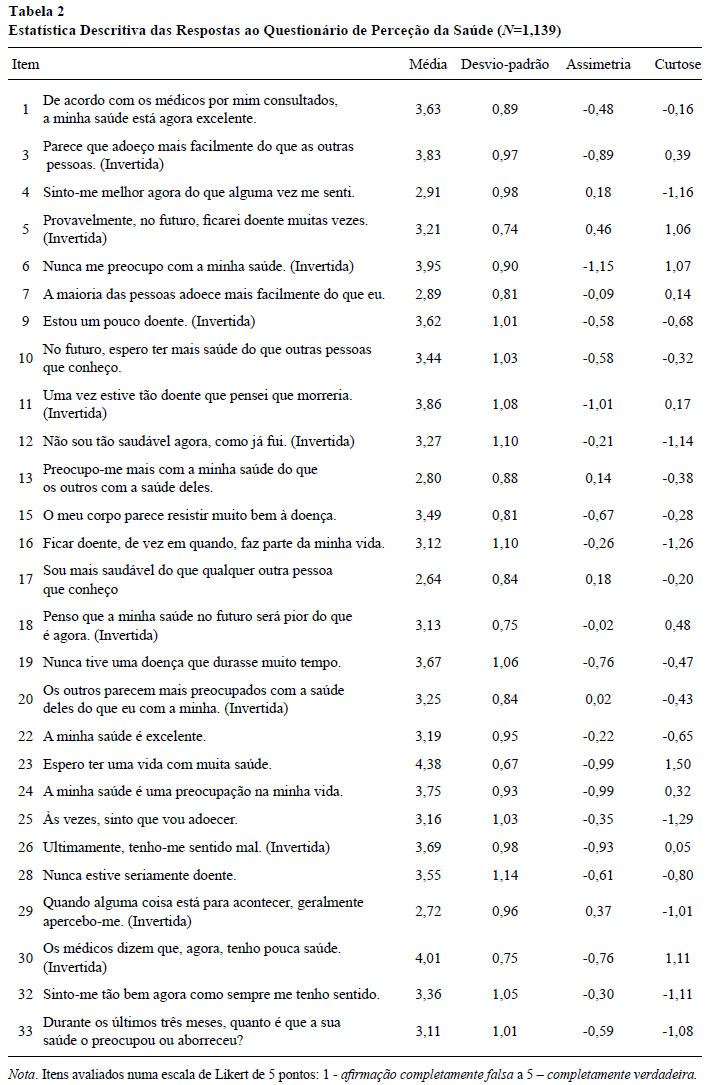
O Health Perception Questionnaire (Ware, 1976) é um instrumento de autoresposta que avalia a perceção da saúde em três momentos - passado, presente e futuro - e a resistência e atitudes em relação à doença (Ware, Manning, Duan, Wells, & Newhouse, 1984). O HPQ foi construído para a população norte-americana em geral por Ware e colaboradores (1979) e validado para a população mexicana por Beaman, Reyes-Frausto e Garcia-Pena (2003), sendo esta a única tradução disponível. O HPQ é constituído por 33 itens, sob a forma de uma afirmação, que são avaliados numa escala de Likert de 5 pontos (de 1 - afirmação completamente falsa a 5 - completamente verdadeira). Neste conjunto de 33 itens, 27 formam seis subescalas: saúde atual (nove itens - 1,4,9,12,17,22,26,30,32), saúde anterior (três itens - 11,19,28), perspetivas de saúde (quatro itens - 5,10,18,23), resistência à doença (quatro itens - 3,7,15,29), preocupação com a saúde (cinco itens - 6,13,20,24,33) e orientação da doença (dois itens - 16,25). As pontuações são calculadas para cada uma das seis subescalas. Entre estes 27 itens, encontram-se ainda os 22 itens que compõem o General Health Rating Index (GHRI) de Ware e colaboradores (1984) e que avalia a saúde geral. A pontuação de duas das subescalas - preocupação com a saúde e orientação da doença - foi invertida dado ser negativa em relação ao tema. Assim, uma pontuação elevada do total do HPQ e das suas subescalas representa uma melhor perceção acerca da saúde.
No estudo da validade das características psicométricas do HPQ realizado por Ware e colaboradores (1979), os procedimentos de análise fatorial dos testes preliminares confirmaram a existência de seis fatores principais e indicaram que cada escala contribui com informação única relevante para a perceção da saúde. Os valores de fiabilidade oscilaram entre 0,59 (orientação da doença) e 0,91 (saúde atual), sendo ligeiramente inferiores nos grupos caracterizados por estatuto socioeconómico mais baixo, menor escolaridade e mais idade (Ware et al., 1979). A fiabilidade teste-reteste do HPQ com intervalos de um, dois e três anos foi de 0,66, 0,59 e 0,56, respetivamente (Ware et al., 1984). Em relação à validade, os procedimentos de análise fatorial dos testes preliminares confirmaram a existência de seis fatores principais (Ware & Gandek, 1998). Contudo, existem seis itens no questionário que não integram estas dimensões e que dizem respeito à rejeição na doença e às atitudes em relação à ida ao médico (Davies, Sherbourne, Peterson, & Ware, 1988). Connelly, Philbrick, Smith, Kaiser e Wymer controlaram as diferenças ao nível da saúde física e encontraram associações significativas entre as pontuações das perceções acerca da saúde e da ansiedade, depressão, preocupação e a utilização de comportamentos tais como o número de visitas e telefonemas aos médicos (1989). A HPQ correlacionava-se 0,46 com a Quality of Well Being Scale (QWB) e 0,52 com a Sickness Impact Profile (SIP; Read, Quinn, & Hoefer, 1987).
Na Tabela 2, apresenta-se a análise descritiva para a amostra total das respostas ao HPQ, correspondendo a numeração dos itens à do instrumento original. Os 27 itens não apresentaram desvios significativos de normalidade (|sk |<3 e |ku|<10; Kline, 2015).
Procedimentos
O HPQ foi traduzido e retrotraduzido por três investigadores (dois portugueses e um inglês). A equivalência concetual e semântica dos itens foi analisada e a equivalência operacional foi avaliada, tendo os autores decidido manter a forma de aplicação do questionário, bem como as suas instruções.
O HPQ foi administrado a indivíduos na população adulta geral, em diversos contextos, académico, profissional e recreativo. Os participantes do estudo foram informados do seu objetivo, do carácter voluntário da participação e da garantia de confidencialidade e anonimato da informação recolhida. Foi conduzido previamente um estudo-piloto para garantir a compreensão efetiva da formulação dos diferentes itens que constituem a escala. De uma forma geral, os participantes compreenderam bem os itens e não sentiram dificuldade em responder às questões.
Resultados
Para o cumprimento do objetivo do estudo, a validação do HPQ para a população portuguesa, utilizou-se uma amostra de 1,139 indivíduos. A estrutura fatorial do HPQ foi avaliada dividindo aleatoriamente a amostra total em duas subamostras: a análise fatorial exploratória (AFE) foi realizada numa subamostra com 565 sujeitos e a análise fatorial confirmatória (AFC), na outra subamostra com 574 sujeitos (Fabrigar, Wegener, MacCallum, & Strahan, 1999). Consequentemente, a validação do HPQ, que implicou o desenvolvimento e especificação do modelo de medida, foi realizada em duas etapas. A análise estatística foi realizada com recurso ao software SPSS 22 e Amos 22.
Análise Fatorial Exploratória
A subamostra utilizada na primeira etapa do estudo, constituída por 565 sujeitos, caracteriza-se por a maioria ser do sexo feminino (71%) e ter menos de 25 anos de idade (55%). Cerca de metade destes participantes possui o grau académico de licenciatura (51%) e cerca de um quarto, o 2º ciclo de escolaridade (26%; Tabela 1).
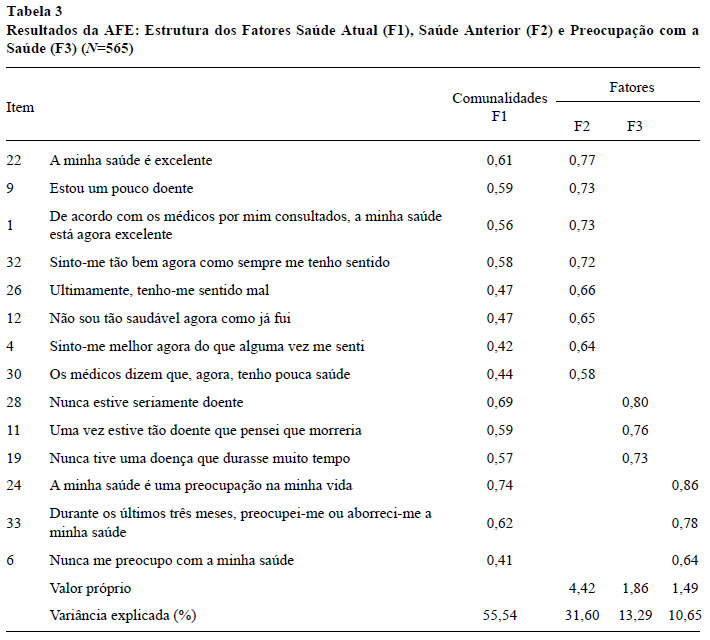
Nesta etapa, de caráter exploratório, para validar a estrutura dos 27 itens dos seis construtos do HPQ, foi utilizada a técnica da AFE (com análise de componentes principais, rotação ortogonal varimax e extração de fatores de acordo com a regra de Kaiser). A adequabilidade da amostra foi analisada de acordo com a estatística Kaiser-Meyer-Olkin (0,70 a 0,80 - aceitável e >0,80 - meritosa) e o teste de esfericidade de Bartlett (p <0,05); a validade fatorial e a discriminante dos itens foi verificada através dos valores dos pesos fatoriais (elevados num único fator e superiores a 0,50) e o nível de consistência interna de cada fator pelo índice alfa de Cronbach (a's entre 0,60 e 0,70 - aceitáveis e superiores a 0,70 - recomendados; Hair, Black, Babin, & Anderson, 2014).
A subamostra apresentou adequabilidade ao procedimento de AFE, KMO = 0,82; χ2(351) = 4084.58, p < 0,001. Na estrutura da solução inicial, composta por sete fatores, identificaram-se itens com comunalidades reduzidas (<0,35) e com ausência de validade fatorial e discriminante. Após a eliminação sucessiva de cada um desses itens, repetiu-se o procedimento, tendo os resultados indicado, de novo, adequabilidade da amostra à análise, KMO = 0,83; χ2(91) = 241451, p < 0,001. A estrutura factorial resultante (Tabela 3) apresentou-se bem definida e com validade fatorial (λ's>0,58) e discriminante, sendo composta por 14 itens em três fatores que explicam 56% da variância total e níveis de consistência interna para os fatores entre aceitáveis e bons: saúde atual (itens 1, 4, 9, 12, 22, 26, 30 e 32; a = 0,85), saúde anterior (itens 11, 19 e 28; a = 0,71) e preocupação com a saúde (itens 6, 24 e 33; a=0,65). A correlação entre a saúde anterior e a saúde atual é média (Cohen, 1988), positiva e significativa (r = 0,38; p < 0,001). A preocupação com a saúde não se correlaciona significativamente com a saúde anterior (r = 0,04; p = 0,412) nem com a saúde atual (r = 0,01; p = 0,860).
Análise Fatorial Confirmatória
A subamostra utilizada nesta etapa do estudo é definida por 574 sujeitos: a maioria é do sexo feminino (68%) e a faixa etária mas representativa possui entre 17 e 24 anos de idade (48%). Uma elevada percentagem (44%) tem o grau académico de licenciatura a que se segue o ensino secundário completo (23%; Tabela 1).
Na segunda etapa do estudo, de caráter confirmatório, foi aplicado o procedimento de AFC, com o método de máxima verosimilhança, sobre os dados da segunda subamostra para confirmar a estrutura fatorial e avaliar a qualidade do ajustamento do modelo especificado pela AFE. Os pressupostos de normalidade univariada e multivariada dos itens foram avaliados de acordo com os valores dos coeficientes de assimetria (sk) e de curtose (ku). A qualidade do ajustamento do modelo foi aferida através do cumprimento dos valores de referência, indicadores de boa qualidade, dos seguintes índices: Normed Chi-square (χ2/gl <3, aceitável; Kline, 2015), Standardized root mean residual (SRMR < 0,08, aceitável; Hu & Bentler, 1999), Root mean square error of approximation (RMSEA < 0,07, aceitável e < 0,03, excelente) (Steiger, 2007) e Comparative fit índex (CFI > 0,95 bom; Hu & Bentler, 1999). Com o RMSEA foi considerado o respetivo intervalo de confiança a 90% que, num modelo bem ajustado, deve apresentar o limite inferior próximo de zero e o superior abaixo de 0,08 (Steiger, 2007). Para a reespecificação do modelo analisou-se as distâncias de Mahalanobis d-squared (DM, p1 e p2 < 0,001 identificam outliers multivariados) e os índices de modificação (IM > 11 traduzem melhorias significativas desde que as alterações sejam teoricamente justificáveis; Hair et al., 2014). Não sendo possível submeter o modelo modificado a uma validação externa com uma amostra independente, a parcimónia dos modelos foi avaliada pelo Modified expected cross-validation index (MECVI), que reflete o ajustamento teórico do modelo noutras amostras semelhantes, e pelo teste da diferença do ajustamento do qui-quadrado (Maroco, 2010).
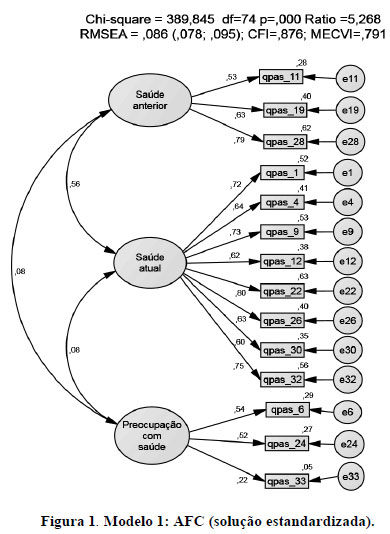
Na Figura 1, apresenta-se o resultado da aplicação da AFC ao modelo trifatorial com 14 itens (Modelo 1) obtido pela AFE. Os 14 itens não apresentaram violações severas de normalidade univariada (|sk |< 1,29 e |ku| < 1,48) mas apresentaram de normalidade multivariada (ku = 25,42, p <0,001). A qualidade de ajustamento do modelo foi aceitável, porém sofrível, χ2 (74) = 38,85, p < 0,001; χ2/gl = 5,27; RMSEA = 0,09 e IC90% = [0,08, 0,10]; SRMR = 0,07; CFI = 0,88; MECVI = 0,79, pelo que se procedeu à sua reespecificação. Na modificação do Modelo 1, considerou-se a estrutura correlacional entre os fatores que sugeriu: a existência de uma estrutura hierárquica de segunda ordem; a exclusão de itens que apresentavam pesos fatoriais relativamente fracos (< 0,60); e IM indicadores de saturação dos itens em mais que um fator.
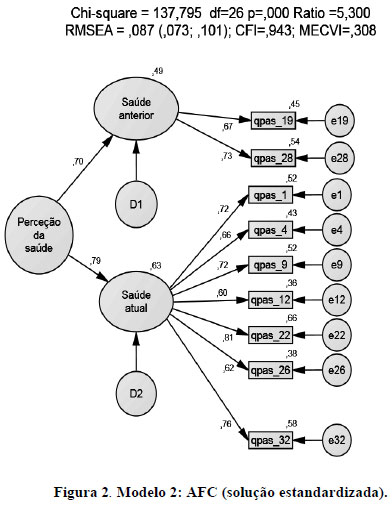
O Modelo 2 (Figura 2) resulta assim da eliminação dos itens 6, 11, 24, 30 e 33 (consequentemente, da eliminação do fator preocupação com a saúde) e da adição de um fator de segunda ordem designado por perceção da saúde. Os nove itens do modelo resultante não apresentaram violações severas de normalidade multivariada (ku = 10,57, p < 0,001). Os valores dos índices de qualidade de ajustamento observaram melhorias ligeiras, χ2(26) = 137,80, p < 0,001; χ2/gl = 5,30; RMSEA = 0,09 e IC90% = [0,07, 0,10]; SRMR = 0,04; CFI = 0,94; MECVI = 0,31. A análise das DM identificou quatro outliers multivariados e dos IM sugeriu a adição de covariâncias entre os erros de medida dos itens 9 e 26, 4 e 28 e 6 e 32. De um ponto de vista teórico, o estabelecimento de covariâncias entre itens do mesmo construto justificam-se pela semelhança do conteúdo dos itens, e de covariâncias entre os erros de medida dos itens 4 ("Sinto-me melhor agora do que alguma vez me senti") e 28 ("Nunca estive seriamente doente"), pela complementaridade de conteúdo.
O Modelo Simplificado de 2ª ordem (Figura 3), cujo construto exógeno é a perceção da saúde, ficou assim definido por nove itens distribuídos em dois fatores, saúde atual (sete itens) e saúde anterior (dois itens), 570 observações e três covariâncias entre resíduos. Os itens não apresentaram violações severas de normalidade multivariada (ku = 10,01, p < 0,001) e todos os índices em avaliação sustentaram a existência de bom ajustamento global do modelo, χ2 (23) = 51,10, p < 0,001; χ2/gl = 2,22; RMSEA = 0,05 e IC90% = [0,03, 0,06]; SRMR = 0,03; CFI = 0,99; MECVI = 0,17.
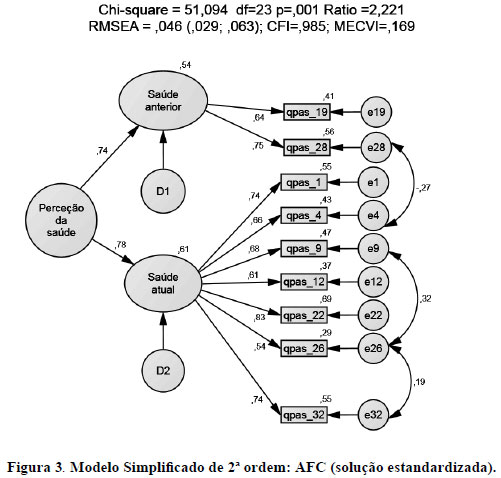
A saúde anterior é avaliada por dois itens (19 - Nunca tive uma doença que durasse muito tempo e 28- Nunca estive seriamente doente) que se centram na história prévia de doenças graves ou significativas. A saúde atual é avaliada por sete itens (1- De acordo com os médicos por mim consultados, a minha saúde está agora excelente; 4 - Sinto-me melhor agora do que alguma vez me senti; 9 - Estou um pouco doente; 12- Não sou tão saudável agora como já fui; 22 - A minha saúde é excelente; 26 - Ultimamente, tenho-me sentido bem; 32 - Sinto-me tão bem agora como sempre me tenho sentido). A perceção de saúde atual inclui avaliações objetivas e subjetivas da saúde, bem-estar (itens 4 e 32), mal-estar e doença (itens 9, 12 e 26)
Comparando o Modelo Simplificado de 2ª ordem com o Modelo 2 conclui-se que o primeiro é mais parcimonioso, e o resultado do teste de diferenças do χ2confirma que a qualidade de ajustamento é superior, dχ2(3) = 86,70, p < 0,001.
O estudo da qualidade do instrumento de medida envolveu a avaliação dos níveis de consistência interna e de fiabilidade compósita de cada fator (FC > 0,70 aceitável; Hair et al., 2014); e a avaliação das quatro componentes da validade (Hair et al., 2014): de conteúdo; fatorial (pesos fatoriais λ > 0,50 ou idealmente > 0,70 e fiabilidades individuais R2 > 0,25); convergente (variância extraída média dos fatores VEM > 0,50); e discriminante (VEM's > quadrado da correlação entre fatores; Fornell & Larker, 1981).
O modelo apresenta bons níveis de consistência interna de cada fator e boa fiabilidade compósita para o total da escala - perceção de saúde (a = 0,85; FC = 0,72) e para a saúde atual (a = 0,65; FC = 0,86), embora a fiabilidade compósita da saúde anterior esteja abaixo do valor de referência (a = 0,87; FC = 0,66).
As duas componentes da validade de conteúdo do modelo foram analisadas. A validade facial foi assegurada pelos procedimentos descritos e pela realização do estudo piloto; a correlação entre os construtos saúde anterior e saúde actual é moderada, positiva e significativa (r = 0,42; p < 0,001); entre a perceção da saúde e a saúde anterior é elevada (Cohen, 1988), positiva e significativa (r = 0,65; p < 0,001), bem como entre a perceção da saúde e a saúde atual (r = 0,96; p < 0,001), forneceram evidência de validade nomológica.
Todos os itens apresentam pesos fatoriais elevados (l's entre 0,54 e 0,75) e fiabilidades individuais adequadas (R2 entre 0,29 e 0,69), estabelecendo a validade fatorial (Figura 3). Os valores da variância média extraída encontram-se em níveis apropriados (saúde atual -0,48, saúde anterior -0,49 e perceção de saúde -0,56), indicando boa validade convergente dos fatores e do total da escala. Os resultados demonstraram a existência de validade discriminante entre os dois fatores saúde atual e saúde anterior (VEM's >0,33).
Discussão
A validação do HPQ para a população portuguesa procurou ser uma resposta efetiva para a escassez de instrumentos que permitem obter uma adequada perceção da saúde indi-vidual. Assim sendo, o objetivo fundamental desta investigação foi adaptar este instrumento para a população portuguesa, analisando as suas características psicométricas, identificando e confirmando a sua estrutura fatorial.
O modelo do autor (Ware, 1976) não se confirmou, na medida em que eram propostos 27 itens distribuídos por seis subescalas. Este modelo não se confirmou na AFE (que sugeriu a existência de três fatores) nem na AFC (que sugeriu a existência de dois fatores). O modelo final, adaptado à população portuguesa, é definido por nove itens incluídos em dois fatores (saúde anterior - dois itens; saúde atual - sete itens), o que inviabiliza a comparação dos valores de consistência interna entre o modelo original e o modelo deste estudo. Contudo, os itens retidos no modelo final mantiveram-se nos fatores (iguais para o modelo original e para o final). Assim, na população estudada, o que permite avaliar a perceção da saúde é a história prévia e a situação atual da saúde e não as perspetivas de saúde, a preocupação com a saúde, a resistência à doença e a orientação da doença. De fato, estudos com populações de sujeitos portadores de mutação genética de doenças fatais apresentam melhor perceção da saúde do que sujeitos da população geral enquanto não se tornam sintomáticos (Leite, Paúl, & Sequeiros, 2002); isto é, parece que apenas na presença de sintomatologia ou da manifestação explícita da doença é que os sujeitos percecionam negativamente a sua saúde. Estes resultados são assegurados pela existência de correlações significativas entre as três dimensões finais do modelo de segunda ordem (saúde anterior, saúde atual e perceção da saúde) e também pela ausência observada de correlações significativas entre a preocupação com a saúde e a saúde atual e anterior no modelo trifatorial. Assim, a perceção acerca da saúde anterior resulta de uma avaliação feita acerca da existência ou não de doença grave ou significativa; a saúde atual refere-se maioritariamente à perceção da saúde atual que se exprime em conceitos objetivos e subjetivos, em bem-estar,-mal-estar e doença. Este resultado é concordante com Simon (1990) quando este afirma que a subescala saúde actual está fortemente associada a variáveis relacionadas com a saúde física. Parece existir uma dicotomia entre o que determina a perceção de saúde anterior - a doença - e o que determina a perceção de saúde atual - a saúde; embora esta perceção de saúde presente inclua referência às doenças, são sobretudo itens relacionados com o bem-estar e a saúde que contribuem para a perceção da saúde atual. Bernstein e colegas (2016) já tinha descoberto que piores percepções de saúde estavam associadas a um pior curso de doença.
A HPQ não foi validada para outras populações pois cedo deu origem à 36-Item Short Form Survey (SF-36) de Ware e Sherbourne (1992) que foi traduzida e validada para diferentes populações. Por esta razão, surge a dificuldade em comparar estruturas factoriais de validações préviascom o mesmo instrumento. Contudo, vários autores utilizaram o HPQ ou formas revistas do mesmo em diferentes tipos de populações. A maior parte dos autores que utilizou a HPQ não questionaram a estrutura factorial da mesma (e.g., Bernhard & Sheppard, 1993; Coehlo, Hooker, & Bowman, 2007; Duffy & MacDonald, 1990; Gennaro, Brooten, Roncoli, & Kumar, 1993; Kim, Kim, & Sok, 2008; Lee, 1991; Oelofsen & Richardson, 2006). Outros autores utilizaram apenas uma das subescalas da HPQ, nomeadamente, a percepção de saúde actual (e.g., Elliott, & Marmarosh, 1994; Frazier & Waid, 1999; Hooker, Monahan, Bowman, Frazier, & Shifren, 1998; Jones, Jaceldo, Lee, Zhang, & Meleis, 2001; Simon, 1990; Thomas, 1989; Thomas & Atakan, 1993); apenas Duffy (1997) utilizou três subescalas do HPQ: percepção de saúde passada, presente e futura. Os resultados encontrados pelos autores nem sempre se sobrepõem aos nossos. Ao contrário do nosso estudo, Anthony e Barry (2009) descobriram que as pontuações na subescala saúde anterior diferiam significativamente por género, com os homens a apresentar valores médios mais altos do que as mulheres. Outros autores estudaram os mesmos conceitos através dos mesmos instrumentos mas em relação a variáveis por nós não estudadas, como por exemplo, Klm e Jung (2015) que revelam que o comportamento promotor de saúde tem uma correlação forte e positiva com a percepção de saúde, com o conhecimento de saúde e com o estado de saúde subjetivo; e Brewer, Robinson, Sumra, Tatsi e Gire, (2015) que relatam que a religião e o apoio social têm um impacto positivo na percepção de saúde actual, na depressão e na perspectiva futura de saúde.
A dimensão do modelo final (nove itens), por comparação com o modelo proposto (33 itens), é uma vantagem quando se tem em vista a generalização da aplicação do instrumento em contexto de saúde. Por outro lado, rivaliza com as medidas de um único item, cuja fiabilidade é muito discutível (Fuchs & Diamantopoulos, 2009; Ware, 1976).
O estudo realizado apresenta algumas limitações, nomeadamente, o fato de a amostra utilizada não ser representativa da população portuguesa. Contudo, nenhum dos estudos referidos utilizou amostras representativas das populações estudadas, apesar de algumas populações serem bastantes específicas (e.g., Conner & Norman, 2017; Fastame et al., 2017; Lee, & Sung, 2017; Meuleman et al., 2017; Ngnoumen & Langer, 2016; Oliveira et al., 2016; Salloum et al., 2016; Shetty et al., 2017). Além disso, dado que a amostra foi avaliada num único momento, carece de validação da estabilidade temporal. No futuro, seria importante comparar os resultados obtidos com outros resultados decorrentes da aplicação de diferentes instrumentos previamente validados para a população portuguesa que medissem o mesmo construto.
Referências
Anthony, J. S., & Barry, D. G. (2009). Perceptions of health status among women and men in an urban homeless population. Journal of National Black Nurses' Association, 20(1),36-41. [ Links ]
Assari, S. (2014). Cross-country variation in additive effects of socio-economics, health behaviors, and comorbidities on subjective health of patients with diabetes. Journal of Diabetes & Metabolic Disorders, 13(1),36. doi: 10.1186/2251-6581-13-36 [ Links ]
Assari, S., & Lankarani, M. M. (2015). Does multi-morbidity mediate the effect of socioeconomics on self-rated health? Cross-country differences. International Journal of Preventive Medicine, 6,85. doi: 10.4103/2008-7802.164413 [ Links ]
Azêdo, D. B. M. (2010). O suporte social e a perceção do estado de saúde na maternidade na adolescência (Dissertação de mestrado em Psicologia da Saúde Comunitária). Universidade Fernando Pessoa, Faculdade de Ciências Humanas e Sociais, Porto, Portugal. [ Links ]
Beaman, P. E., Reyes-Frausto, E., & Garcia-Pena, C. (2003). Validation of the Health Perceptions Questionnaire for an older Mexican population. Psychological Reports, 92,723-734. [ Links ]
Bernhard, L. A., & Sheppard, L. (1993). Health, symptoms, self-care, and dyadic adjustment in menopausal women. Journal of Obstetric, Gynecologic, & Neonatal Nursing, 22(5),456-461. [ Links ]
Bernstein, E. E., Rabideau, D. J., Gigler, M. E., Nierenberg, A. A., Deckersbach, T., & Sylvia, L. G. (2016). Patient perceptions of physical health and bipolar symptoms: The intersection of mental and physical health. Journal of Affective Disorders, 189,203-206. doi: 10.1016/j.jad.2015.09.052 [ Links ]
Brewer, G., Robinson, S., Sumra, A., Tatsi, E., & Gire, N. (2015). The influence of religious coping and religious social support on health behaviour, health status and health attitudes in a British Christian sample. Journal of Religion and Health, 54(6),2225-2234. doi: 10.1007/s10943-014-9966-4 [ Links ]
Cloninger, C. R., & Zohar, A. H. (2011). Personality and the perception of health and happiness. Journal of Affective Disorders, 128 (1),24-32. doi: 10.1016/j.jad.2010.06.012 [ Links ]
Coehlo, D. P., Hooker, K., & Bowman, S. (2007). Institutional placement of persons with dementia: What predicts occurrence and timing?. Journal of Family Nursing, 13(2),253-277. doi: https://doi.org/10.1177/1074840707300947 [ Links ]
Cohen, J. (1988). Statistical power analysisfor the behavioral sciences (2nd Ed.). Hillsdale, NJ: Erlbaum. [ Links ]
Coleman, A. M., Hicks-Coolick, A., & Brown, A. F. (2015). The role of perception in developing healthy lifestyles and community engagement. Journal of the Georgia Public Health Association, 5(1),45-50. [ Links ]
Connelly, J. E., Philbrick, J. T., Smith, G. R., Kaiser, D. L., & Wymer, A. (1989). Health perceptions of primary care patients and the influence on health care utilization. Medical Care,27(Suppl. 3),99-109. [ Links ]
Conner, M., & Norman, P. (2017). Health behaviour: Current issues and challenges. Psychology & Health, 32(8),895-906. doi: https://doi.org/10.1080/08870446.2017.1336240 [ Links ]
Crown, K. (2012). Health Perception. In S. Loue & M. Sajatovic (Eds.), Encyclopedia of Immigrant Health (pp. 791-791). New York: Springer. [ Links ]
Davies, A. R., Sherbourne, C. D., Peterson, J. R., & Ware, J. E. (1988). Scoring manual: Adult health status and pacient satisfaction measures used in Rand's Health Insurance Experiment. Santa Mónica, CA: Rand Corporation. [ Links ]
Diamond, J. J., Becker, J. A., Arenson, C. A., Chambers, C. V., & Rosenthal M. P. (2007). Development of a Scale to Measure Adults' Perceptions of Health. Journal of Community Psychology, 35(5),557-561. doi: https://doi.org/10.1002/jcop.20164 [ Links ]
Duffy, M. E. (1997). Determinants of reported health promotion behaviors in employed Mexican American women. Health Care for Women International, 18(2),149-163. [ Links ]
Duffy, M. E., & MacDonald, E. (1990). Determinants of functional health of older persons. The Gerontologist, 30(4),503-509. [ Links ]
Elliott, T. R., & Marmarosh, C. L. (1994). Problem-solving appraisal, health complaints, and health-related expectancies. Journal of Counseling & Development, 72(5),531-537. [ Links ]
Fabrigar, L. R., Wegener, D. T., MacCallum, R. C., & Strahan, E. J. (1999). Evaluating the use of exploratory factor analysis in psychological research. Psychological Methods, 4(3),272-299. [ Links ]
Fastame, M. C., Hitchcott, P. K., & Penna, M. P. (2017). Does social desirability influence psychological well-being: Perceived physical health and religiosity of Italian elders? A developmental approach. Aging & Mental Health, 21(4),348-353. doi: 10.1080/13607863.2015.1074162 [ Links ]
Frazier, L. D., & Waid, L. D. (1999). Influences on anxiety in later life: The role of health status, health perceptions, and health locus of control. Aging & Mental Health, 3(3),213-220. [ Links ]
Fornell, C., & Larcker, D. F. (1981). Evaluating structural equation models with unobservable variables and measurement error. Journal of Marketing Research, 18(1),39-50. [ Links ]
Fuchs, C., & Diamantopoulos, A. (2009). Using single-item measures for construct measurement in management research. Die Betriebswirtschaft, 69(2),195-210. [ Links ]
Gabinete de Estatísticas da União Europeia. (2015). Self-perceived health statistics. Luxembourg: Publications Office of the European Union. Retrieved from http://ec.europa.eu/eurostat/statistics-explained/index.php/Self-perceived_health_statistics [ Links ]
Gennaro, S., Brooten, D., Roncoli, M., & Kumar, S. P. (1993). Stress and health outcomes among mothers of low-birth-weight infants. Western Journal of Nursing Research, 15(1),97-113. [ Links ]
Goldberg, D. P., & Hillier, V. F. (1979). A scaled version of the General Health Questionnaire. Psychological Medicine, 9(1),139-45. [ Links ]
Goodwin, R., & Engstrom, G. (2002). Personality and the perception of health in the general population. Psychological Medicine, 32(2),325-332. doi: https://doi.org/10.1017/S0033291701005104 [ Links ]
Hair, J. F., Black, W. C., Babin, B. J., & Anderson, R. E. (2014). Multivariate data analysis (7th ed.). Harlow, UK: Pearson Educational Limited. [ Links ]
Hamlyn, D. W. (2017). The psychology of perception: A philosophical examination of Gestalt theory and derivative theories of perception (Vol. 13). New York: Routledge. [ Links ]
Hooker, K., Monahan, D. J., Bowman, S. R., Frazier, L. D., & Shifren, K. (1998). Personality counts for a lot: Predictors of mental and physical health of spouse caregivers in two disease groups. The Journals of Gerontology Series B: Psychological Sciences and Social Sciences, 53(2),73-85. [ Links ]
Hu, L.-t., & Bentler, P. M. (1999). Cutoff criteria for fit indexes in covariance structure analysis: Conventional criteria versus new alternatives. Structural Equation Modeling, 6(1),1-55. doi: https://doi.org/10.1080/10705519909540118 [ Links ]
Jones, P. S., Jaceldo, K. B., Lee, J. R., Zhang, X. E., & Meleis, A. I. (2001). Role integration and perceived health in Asian American women caregivers. Research in Nursing & Health, 24(2),133-144. doi: https://doi.org/10.1002/nur.1016 [ Links ]
Kim, K. B., Kim, H. A., & Sok, S. H. R. (2008). A study on health perception, health knowledge, and health promoting behavior in the elderly. Journal of East-West Nursing Research, 14(1),56-67. [ Links ]
Kline, R. B. (2015). Principles and practice of structural equation modeling. London: Guilford. [ Links ]
Klm, S., & Jung, E. (2015). A relevance on health perception, health knowledge and health promotion behavior of the university students. Journal of the Korea Academia-Industrial cooperation Society, 16(8),5394-5403. doi: 10.5762/KAIS.2015.16.8.5394 [ Links ]
Krabbe, P. (2016). The measurement of health and health status: Concepts, methods and applications from a multidisciplinary perspective. San Diego, CA: Elsevier Academic Press. [ Links ]
Lee, B. A., & Oh, D. J. (2013). The effects of health perception on living health belief, living satisfaction and wellbeing-oriented activities according to swimming participation with middle-aged women. Journal of Exercise Rehabilitation, 9(3),381. doi: 10.12965/jer.130047 [ Links ]
Lee, E. J., & Sung, M. H. (2017). Impacts of health perception, aging anxiety and perception of successful aging on health promotion behavior of Late Middle-aged women. Korean Journal of Women Health Nursing, 23(3),181-190. doi: 10.4069/kjwhn.2017.23.3.181 [ Links ]
Lee, H. J. (1991). Relationship of hardiness and current life events to perceived health in rural adults. Research in Nursing & Health, 14(5),351-359 [ Links ]
Leite, Â., Paúl, C., & Sequeiros, J. (2002). O bem-estar psicológico em indivíduos de risco para doenças neurológicas hereditárias de aparecimento tardio e controlos. Psicologia, Saúde & Doenças, 3(2),113-118. [ Links ]
Maroco, J. (2010). Análise de equações estruturais: Fundamentos teóricos, software & aplicações. Pêro Pinheiro, Portugal: ReportNumber. [ Links ]
McPherson, F., Melvin, K. C., Belew, D. L., & McGraw, L. K. (2016). Health Perception and Wellness Behavior Survey among Military Beneficiaries. Annals of Psychiatry and Mental Health, 4(2),1060. [ Links ]
Meuleman, Y., Chilcot, J., Dekker, F. W., Halbesma, N., & van Dijk, S. (2017). Health-related quality of life trajectories during predialysis care and associated illness perceptions. Health Psychology, 36(11),1083-1091. doi: 10.1037/hea0000504 [ Links ]
Michaelson, V., Pickett, W., Vandemeer, E., Taylor, B., & Davison, C. (2016). A mixed methods study of Canadian adolescents' perceptions of health. International Journal of Qualitative Studies on Health and Well-Being, 11(1),32891. doi: 10.3402/qhw.v11.32891 [ Links ]
Moss-Morris, R., Weinmanb, J., Petriea, K., Hornec, R., Camerona, L., & Buickc, D. (2002). The Revised Illness Perception Questionnaire (IPQ-R). Psychology and Health, 17(1),1-16. [ Links ]
Ng, T. (2012). The Brief Illness Perception Questionnaire (Brief IPQ). Journal of Physiotherapy,58(3),202. doi: https://doi.org/10.1016/S1836-9553(12)70116-9 [ Links ]
Ngnoumen, C. T., & Langer, E. J. (2016). Mindfulness: The essence of well-being and happiness. In I. Ivtzan & T. Lomas (Eds), Mindfulness in Positive Psychology: The Science of Meditation and Wellbeing (pp. 97-107). London: Routledge. [ Links ]
Oelofsen, N., & Richardson, P. (2006). Sense of coherence and parenting stress in mothers and fathers of preschool children with developmental disability. Journal of Intellectual and Developmental Disability, 31(1),1-12. doi: https://doi.org/10.1080/13668250500349367 [ Links ]
Oliveira, C., Sole, A., Girón, R. M., Quintana-Gallego, E., Mondejar, P., Baranda, F., ...Quittner, A. (2016). Depression and anxiety symptoms in Spanish adult patients with cystic fibrosis: Associations with health-related quality of life. General Hospital Psychiatry, 40, 39-46. doi: 10.1016/j.genhosppsych.2016.02.002 [ Links ]
Post, M. (2014). Definitions of quality of life: What has happened and how to move on. Topics in Spinal Cord Injury Rehabilitation, 20(3),167-180. doi: 10.1310/sci2003-167 [ Links ]
Read, J. L., Quinn, R. J., & Hoefer, M. A. (1987). Measuring overall health: An evaluation of three important approaches. Journal of Chronic Diseases, 40(Suppl. 1),7-21. [ Links ]
Ross, K. (2010). Assessing diferences in perceptions and actual health status: A national cross-sectional analysis (Dissertação de mestrado em Filosofia). Kansas State University, Manhattan, KS. [ Links ]
Rubin, J., Taylor, J., Krapels, J., Sutherland, A., Felician, M., Liu, J., ...Rohr, C. (2016). Are better health outcomes related to social expenditure? A cross-national empirical analysis of social expenditure and population health measures. Santa Monica, CA: RAND Corporation. Retrieved from https://www.rand.org/pubs/research_reports/RR1252.html [ Links ]
Saleh, Z. T., Connell, A., Lennie, T. A., Bailey, A. L., Elshatarat, R. A., Yousef, K., & Moser, D. K. (2017). Cardiovascular disease risk predicts health perception in prison inmates. Clinical Nursing Research. Retrieved from http://journals.sagepub.com/doi/pdf/10.1177/1054773817740534 [ Links ]
Salloum, I. M., Cloninger, C. R., Salvador-Carulla, L., & Otero, A. A. (2016). Health status: From illness to wellbeing. In J. E. Mezzich, M. Botbol, G. Christodoulou, C. R. Cloninger, & I. Salloum (Eds), Person centered psychiatry (pp 157-164). New York: Springer [ Links ]
Santos, A. F., Barbosa, R. B., Faro, S. R. S., & Alves, A., Jr. (2005). Representações sociais no processo saúde-doença entre nefrologistas e pacientes renais crónicos. Psicologia, Saúde e Doença, 6(1),57-67. [ Links ]
Schnittker, J., & Bacak, V. (2014). The increasing predictive validity of self-rated health. PLOS One, 22. Retrieved from http://journals.plos.org/plosone/article?id=10.1371/journal.pone.0084933 [ Links ]
Shetty, A. A., Wertheim, J. A., & Butt, Z. (2017). Health-related quality of life outcomes after Kidney Transplantation. In G. Orlando, G. Remuzzi, & D. F. Williams (Eds.), Kidney Transplantation, Bioengineering and Regeneration (pp. 699-708). San Diego, CA: Elsevier Academic Press. [ Links ]
Simon, J. M. (1990). Humor and its relationship to perceived health, life satisfaction, and moral in older adults. Issues in Mental Health Nursing, 11(1),17-31. doi: https://doi.org/10.3109/01612849009014542 [ Links ]
Steiger, J. H. (2007). Understanding the limitations of global fit assessment in structural equation modeling. Personality and Individual Differences, 42(5),893-898. doi: https://doi.org/10.1016/j.paid.2006.09.017 [ Links ]
Thomas, S. P. (1989). Gender differences in anger expression: Health implications. Research in Nursing & Health, 12(6),389-398. doi: 10.1002/nur.4770120609 [ Links ]
Thomas, S. P., & Atakan, S. (1993). Trait anger, anger expression, stress, and health status of American and Turkish midlife women. Health Care for Women International, 14(2),129-143. doi: https://doi.org/10.1080/07399339309516035 [ Links ]
Tourani, S., Behzadifar, M., Martini, M., Aryankhesal, A., Mirghaed, M. T., Salemi, M., ...Bragazzi, N. L. (2018). Health-related quality of life among healthy elderly Iranians: A systematic review and meta-analysis of the literature. Health and Quality of Life Outcomes, 16(1),18. doi: 10.1186/s12955-018-0845-7 [ Links ]
Vintém, J. M. (2008). Inquéritos Nacionais de Saúde: Auto-perceção do estado de saúde: Uma análise em torno da questão de género e da escolaridade. Revista Portuguesa de Saúde Pública, 26(2),5-16. [ Links ]
Ware, J. E., Jr. (1976). Scales for measuring health perceptions. Health Services Research, 11(4),396-415. [ Links ]
Ware, J. E., Jr., & Gandek, B. (1998). Overview of the SF-36 Health Survey and the International Quality of Life Assessment (IQOLA) Project. Journal of Clinical Epidemiology, 51(11),903-12. [ Links ]
Ware, J. E., Jr., Johnston, S. A., Davies-Avery, A., & Brook, R. H. (1979). Conceptualization and measurement of health for adults in the Health Insurance Study:Vol. III.Mental Health. Santa Monica, CA: Rand Corporation. [ Links ]
Ware, J. E., Jr., & Karmos, A. H. (1976). Development and validation of scales to measures (Vol. 2) of a Final Report, NTIS publication. Perceived Health and Patient Role Propensity. Springfield, VA: National Technical Information Service. [ Links ]
Ware, J. E., Jr., Manning, W. G, Duan, N., Wells, K. B., & Newhouse, J. P. (1984). Health Status and the use of Outpatient Mental Health Services. American Psychologist, 39(10),1090-1100. doi: http://dx.doi.org/10.1037/0003-066X.39.10.1090 [ Links ]
Ware, J. E., Jr., & Sherbourne, C. D. (1992). The MOS 36 Item Short-Form Health Survey (Sf-35). I. Conceptual framework and item selection. Medical Care, 30(6),473-483. [ Links ]
Zahrt, O. H., & Crum, A. J. (2017). Perceived physical activity and mortality: Evidence from three nationally representative US samples. Health Psychology, 36(11),1017-1025. doi: 10.1037/hea0000531 [ Links ]
 Endereço para correspondência:
Teresa Soares Souto
Universidade Lusófona do Porto, Faculdade de Psicologia, Educação e Desporto
R. de Augusto Rosa, 24
4000-098 Porto, Portugal
E-mail: p2683@ulp.pt, anaramires.ps@gmail.com, angelamtleite@gmail.com, v_mas@hotmail.com e raquel_santo@hotmail.com
Recebido: 30/07/2017
1ª revisão: 17/12/2017
2ª revisão: 06/02/2018
Aceite final: 07/02/2018
Contribuições dos Autores
Contribuição substancial no conceito e desenho do estudo: Teresa Soares Souto; Ângela Leite.
Contribuição na coleta de dados: Vanessa Santos; Raquel Espírito Santo.
Contribuição na análise e interpretação de dados: Ana Ramires; Ângela Leite; Teresa Soares Souto.
Contribuição para a preparação do manuscrito:Teresa Soares Souto; Ângela Leite; Ana Ramires.
Contribuição à revisão crítica, agregando conteúdo intelectual: Teresa Soares Souto; Ângela Leite; Ana Ramires; Vanessa Santos; Raquel Espírito Santo.
Conflitos de interesse
Os autores declaram não ter conflito de interesse relacionado à publicação deste manuscrito.

