


Services on Demand
article
 text in
  English (pdf)
 Article in xml format
 Article references
Indicators

Share

 Permalink
Psicologia: teoria e prática
Print version ISSN 1516-3687
Psicol. teor. prat. vol.19 no.1 São Paulo Apr. 2017
http://dx.doi.org/10.5935/1980-6906/psicologia.v19n1p137-151
ARTICLES
PSYCHOLOGICAL ASSESSMENT
Risk-taking game: construction, validity evidence and gender differences
Karina Alessandra FattoriI; Anna Beatriz Carnielli Howat-RodriguesII; Patrícia IzarIII
IUniversidade de São Paulo - USP, SP, Brasil
IIUniversidade Federal do Rio de Janeiro - UFRJ, RJ, Brasil
IIIUniversidade de São Paulo - USP, SP, Brasil
ABSTRACT
This study's objective was to construct, standardize, and identify validity evidence regarding a card game in order to study risk propensity. Risk-taking outcomes were investigated using a coefficient of variation and a risk-adjusted performance measure. The hypothesis considered was that a valid instrument would successfully distinguish sex differences, indicating men are more prone to risk than women. In addition to the card game, which initially included eight rounds, the 243 participants completed a sociodemographic questionnaire. The results indicate that six rounds were more pertinent and presented validity evidence based on response processes and external criteria; men scored higher in risk propensity than women. The conclusion is that the instrument is innovative, considering loss was added to the study of risk, and proved to be valid for use with Brazilian samples.
Keywords: risk; psychological measure; instrument; decision-making; quantitative research.
Introduction
The study of risk propensity among humans can be quite complex. The reason is that risk propensity is a term that may be defined differently according to individual perceptions of what risk is, individual characteristics (e.g., age, gender, etc.), individual skills related to performing a given task, perception and social/group judgment of risk, the characteristics of the task itself, and balance of loss and gain of certain alternatives (Figner & Weber, 2011).
In this study, we adopted the finance approach, which considers risk propensity to be a tendency to choose, in a given context, among alternatives with uncertain gains but that promise high returns, rather than alternatives with certain gains (Figner & Weber, 2011; Helfinstein et al., 2014). An example is the risk involved in investment in a stock exchange (e.g., variable income) versus a savings account (e.g. fixed income). A stock exchange is a variable income investment because it assumes that return is randomly determined around a growth trend: dispersion of return, i.e., how much results vary, is sufficient for this return to be uncertain in a given period of time, which can range from extremely positive to extremely negative. A savings account, on the other hand, is a fixed income asset, so that variance of profitability tends to be null; i.e., profitability tends to be the same at any period of time. Therefore, a savings account is considered by the market to be the asset with the lowest risk.
This context requires different ways to measure risk propensity and implies there is difficulty in building and standardizing instruments. The most frequently used instruments are scales and games involving risk (Charness, Gneezy, & Imas, 2013). In general, items are assessed on Likert scales based on dichotomous choices (i.e., yes or no). Usually scales measure personality traits, such as sensation seeking and impulsiveness or the measure the probability of individual taking risks in a given task (Charness, et al. 2013).
The exclusive use of scales, however, is limited because participants need to show how they would respond to situations that are not actually happening, and they may make an assessment based on what is socially expected. Games, on the other hand, lead participants to access emotional responses more readily, inducing more spontaneous actions (Loewenstein, Weber, Hsee, & Welch, 2001).
Instruments aiming to produce greater involvement of participants in a task include go-no-go and gambling task games. In the first group are games such as the balloon analogue risk task (Bart) (Lejuez, et al., 2002). These games usually measure impulsiveness and require participants to refrain from performing a given task to avoid losing points, for instance, the task is to click the button that makes the car stop when the sign is red. The second group includes the Iowa Gambling Task (IGT) (Bechara, Damasio, Damasio, & Anderson, 1994), the Columbia Card Task (Figner & Weber, 2011), and the card game proposed by Weber, Shafir, and Blais (2004). These games are similar to the risk-taking presented in gambling situations. Their characteristics include the presentation of two or more possibilities of action that are related to a possibility of achieving a gain. They also enable participants to analyze the least and greatest gains, in addition to giving hints on the variation of results of each choice.
In this study we present the development and validation of a gambling task game, based on the instrument developed by Weber et al. (2004). The original game consists of presenting the participants two piles of cards, each with 50 cards, in five rounds. The two piles present equal expected return, however, one always presents the same positive reward (x, for instance, x=3), while the other pile, presents a variable reward (0 and y, while y>x, for instance, 6>3, therefore y=6). The participant cannot view all the cards in the piles, but can take samples of each pile at the beginning of each round, in whatever order desired, until s/he has an idea which pile would yield the best monetary return. After taking the cards samples, the individual chooses the pile considered to be more profitable. Next, the participant is instructed to take a card from the pile chosen. At the end, all the scores obtained by the participants in the five rounds are recorded and participants spin a roulette wheel to know what the monetary payment will be (Weber et al., 2004).
Usually, gambling task instruments use variance as a risk-sensitivity measure; variance refers to the variability of potential outcomes. Between two choices with different variances, the one with greater variance has the most risk, and choosing the option with greater variance is seen as risk propensity (Weber et al., 2004; Blais & Weber, 2006). Weber et al. (2004) suggest the use of a coefficient of variation (CV) because they propose that both non-human animals and humans should have the ability to perceive that outcomes vary relative to their means, but not in an absolute fashion. Note that there are no losses in this game, and in a situation of gains, the higher the CV, the higher the risk. Variance can only be compared between alternatives with equal initial conditions (same average), while CV is a measure of variability relative to risk alternatives and can be calculated by dividing the standard deviation by the mean; comparatively, it is more comprehensive than variance.
Gambling task games work with the possibility of gain, that is, participants may score higher or gain more or fewer rewards, depending on their choices. We did not find instruments measuring the possibility of loss. We propose a new game because we consider risk to be dependent on the certainty one has regarding the results of actions and the guarantee of resources (Figner & Weber, 2011; Helfinstein et al., 2014). As a new proposal for gambling task games, we implemented loss in risk situations so that participants have both the possibility of gain and loss as a result of their choices. When there is the possibility of loss, we propose the downside risk (δ(k)) index be used as a measure of risk. This measure is only concerned with undesirable variability, that is, variability that leads to losses, while taking into account a minimum return rate. The higher and more positive the δ(k) index, the better the fund performance, because these alternatives are less likely to yield below some expected level. This index is achieved through the square root of the difference between expected return from the uncertain choice (µ(k)) and minimum profitability from the certain choice multiplied by a period of time (Eid Jr, Rochman, & Taddeo, 2005).
This study's objective was to develop, standardize, and identify validity evidence of a card game in order to study risk propensity among Brazilian individuals. This proposal is intended to establish evidence of the instrument's validity based on response processes and external criteria. Taking into account the definition of risk propensity that is present in individuals' choices and depending on the variation of gains (uncertain and certain) (Figner & Weber, 2011; Helfinstein et al., 2014), we consider validity evidence based on the response processes if the instrument reflects such uncertainty of gains in its alternatives. The development of the methodology involving gains and losses enables greater involvement on the part of participants in tasks to study risk propensity and supports a greater understanding of how human decision-making actually takes place. Additionally, it expands the discussion regarding methodology in a field that lacks standardization of instruments (Charness et al., 2013).
In regard to standardization, in addition to structural information, we intend to better define the index provided by the instrument to measure risk sensibility. We will analyze whether the participants' choices are more in agreement with the CV index or with the δ(k) index.
In order to test validity evidence based on external criteria, we used an analysis of contrasting groups based on groups of men and women. Sex differences have been frequently reported in the literature as elements that influence variation in risk propensity (Charness & Geneezy, 2011; Van den Bos, Homberg, & de Visser, 2013). Charness and Gneezy (2011) analyzed the difference between women and men in regard to finance risk, shown through an investment game in which women invest less and, therefore, seem to be more averse to risk than men. Therefore, we consider the hypothesis that if the instrument is valid, it distinguishes between men and women, indicating that men are more prone to taking risks.
If we consider an evolutionary approach, these differences may be explained by Trivers' Parental Investment Theory (1972). The author proposes that sex differences found in the reproduction process of mammals, in which females are responsible for the entire process of pregnancy and lactation, leads to their reproductive success depending on parental investment to ensure that their offspring reach reproductive age and all the female energetic expenditure not being in vain. Because parental investment takes place in the long run, women tend to be more averse to risk, considering the high energetic cost of taking risks. For males, reproductive success is restricted to the number of partners with which they are able to maintain sexual intercourse. Therefore, men invest less in parental care than women and may increase their reproductive potential with an increased number of potential partners. These biological differences restricting reproductive success favored men more focused on intrasexual competition as a way to increase their number of partners, therefore, making them more prone to risk in general.
Note than Van den Bos et al. (2013) suggest that the analysis of sex differences in a game instrument should take into account characteristics inherent to the game that is proposed. The authors state that games involving risk do not always elicit different scores between men and women. Proposing the study of sex differences based on the Iowa Gambling Task, which presented 100 random rounds to 73 men and 140 women, the authors concluded that sex differences exist in the task, especially in the initial rounds, which are considered ambiguous rounds because the participants do not have prior information regarding the choices that yield higher values. In these rounds, men more frequently chose the options that yield advantages in the long run, compared to women, who are more sensitive to occasional losses that take place in options with advantages in the long run. These differences, however, are diluted around the 40th60th rounds, when women reach the same performance as men.
Method
This study has a quantitative nature and included two data collections in the instrument's development, with both following the same methodology. Note that the second data collection was not foreseen as necessary in the study's design. Nonetheless, after analysis of data collected in the first effort and the need to exclude two rounds from the instrument because they did not fit the validity evidence based on response process, we verified a new data collection to be necessary to check whether the exclusion of these rounds would change the game's general structure.
Participants
The participants were selected based on factors that were indicated in the literature as influencing risk propensity rates, such as age and sex (in order to establish evidence validity based on external criteria). We included men and women aged between 18 and 25 years old. The sample size was adjusted considering a representativeness of five participants per amount of choices in the first data collection and n > 30 in the second data collection.
A total of 211 people participated in the first data collection: 121 women aged 21.60 years on average (SD= 2.19) and 90 men aged 21.46 on average (SD= 2.0). The mean purchasing power was 31.05 (SD= 7.39). In the second data collection, 32 people participated: 17 women aged 21.71 years old (SD= 2.39) and 15 men aged 22.33 on average (SD= 2.06). The mean purchasing power was 32.59 (SD= 8.91).
Instruments
Sociodemographic questionnaire: A sociodemographic questionnaire with open and closed questions was used to identify the participants' profiles (i.e., sex, age, education, scores of the Criteria of Economic Classification Brazil - CCEB). The CCEB is originally established in categories (classes A, B, C and D) and is used to estimate the purchasing power of urban families. In this study, however, it was used as a continuous measure, so that the responses of each participant scored from zero to 46 points.
Development of the Risk-Taking Game: The game was based on the instrument applied in the study by Weber et al. (2004). Additionally, in order to include situations of loss in the game, we based it on the idea of a game popularly known as Blackjack or twenty-one, a card game played in casinos in which the objective is to score higher than the dealer, but not above 21, which would result in a loss. The instrument developed by Weber et al. (2004), consisted of two piles with 26 cards each, which were presented to the participant in each round. The participant could gain pieces of candy if s/he scored better than the previous participants, according to a ranking that was formed during data collection. The participant knew how many rounds s/he would play before the game started. Similar to Blackjack, the objective of this game was to reach a total of 21 points in each round. In each round, the researcher gave a card with a number for the participant to keep. The participant also had to choose one of two piles to play. The participant could not move the piles until a choice was made, but was informed of which pile always presented the same positive reward (x) - the certainty pile, and which presented two different rewards (0 and y, where y>x) - the uncertainty pile. The participant was also informed whether there were more zero cards or more y cards, or whether there was the same amount of 0 and y; however, the real proportion between these amounts was not reported. In each pair of piles, the choices presented different variances and equal expected returns. The player took three cards from the chosen pile in whatever order desired. The choice was made according to the players' strategies to reach the game objective (a score of 21). The participant was also informed that the score doubled whenever s/he scored 21, that is, s/he would score 42. If, however, s/he scored higher than 21, s/he would lose the round and score zero. There were eight rounds in total.
Procedures
The study project was approved by the Institutional Review Board, at the Federal University of Espírito Santo (No. 198/11), in accordance with the guidelines established by the National Council of Health (196/96), which regulates research with human subjects. The participants were approached in teaching institutions (college and vocational programs) and received clarification concerning the study that was provided by the primary author. Those who consented signed free and informed consent forms.
Data were collected individually in an experimental setting and the game was manually applied. In order to involve the participants in the game, a ranking was created and participants were ranked according to their performances/scores. The ranking was updated whenever a new participant played the game and the one who was ranked first (highest score) was granted a reward (candy). This reward included products valued by each age group and did not represent certain gain, but rather a possibility of gain.
A reward is justified because risk is seen as dependent on uncertain outcomes and the guarantee there will be resources determined by outcomes (Figner & Weber, 2011; Helfinstein et al., 2014). Applying the procedure without including the possibility of real gain could hinder the objective of measuring risk propensity per se, which was what was proposed for the tasks.
In order to explore the behavior of the indexes provided by the instrument and analyze how they fit with the validity evidence based on response processes, data analysis included descriptive analysis with central tendency measures (mean and standard deviation). Analysis of the indexes CV and δ(k) of each round was performed based on expected return (µ(k)) and standard deviation (σ(k)) (Eid Jr et al., 2005). Analysis of correlation was performed between the means of risk indexes obtained in the rounds CV and δ(k), between the frequency of risk moves and between the sum of the score obtained in the rounds, in order to explore the relationships among these indexes. In order to verify whether the risk choice was being influenced by the score obtained in the previous move, we performed analysis of correlation between risk choices in previous moves with the score of previous moves. A comparative analysis was also performed between groups (men versus women) based on the univariate analysis of variance (ANOVA), to verify the measure's validity evidence based on external criteria. Data were analyzed using SPSS® 16 (Statistical Package for the Social Sciences 16).
Results
Analysis of risk sensibility indexes
Table 1 presents the descriptive analysis of each round, with the values each participant had in their hands, return yielded by certainty (certain return) and uncertainty (associated return) piles in each round and the calculation of the CV and δ(k) indexes.
We verified that according to the CV index, people should more frequently make risky choices in rounds 5, 6, 2, 1, 3, 4, 8 and 7, because risky choices in this order, concerning magnitude of loss, would result in lower losses. If the δ(k) index is considered, people should more frequently make risky choices in the rounds with the best expected returns, that is, round 4, then round 3, and then rounds 7, 6, 2, 5, 8 and 1.
In the first data collection, the participants more frequently made risky choices in all the rounds. In the first round, 68.24% made risky choices, while in the second round, 74.88% chose the risky alternative, 98.58% in the third, 94.79% in the fourth round, 58.29% in the fifth round, 68.72% in the sixth, 73.46% in the seventh, and 83.89% in the eighth round. In all the rounds, there were participants who chose risk-free alternatives. Note that only two and 11 participants made this choice in rounds 3 and 4, respectively. In contrast with the order established by the indexes, more risky decisions were made in round 3, then in rounds 4, 8, 2, 7, 6, 1 and 5.
Note that the third and fourth rounds, in which participants had a card with the lowest score in a hand (1 point) and obtained a low score if they did not take risks (4 points), people preferred risky choices. In these rounds, the participants had a low chance of gain. As the possibility of achieving a gain increased with safe alternatives (9 points for rounds 1 and 2, 15 points for rounds 7 and 8, and 17 points for rounds 5 and 6), the number of people who avoided risky choices in these rounds also increased. Because the characteristics of rounds 3 and 4 were not compatible with the measurement of risk proposed, these rounds were excluded from the analysis and a new data collection was performed (n=32).
Similar to the first data collection, participants in the second data collection more frequently made risky choices in all the rounds. In the first round, 81.25% made risky choices, 56.25% in the fifth, 71.86% in the sixth, 59.38% in the seventh, and 84.38% in the eighth choice. In all the rounds there were participants who chose the risk-free alternative. More risky decisions were made in round 8, then in rounds 1, 2, 6, 7 and 5; again, differs from what the indexes indicated.
The means of all risk scores were strongly correlated with each other (p<0.001): CV and δ(k), r=0.93; δ(k) and frequency of risky choices, r=0.96; CV and frequency of risky choices, r=0.93. The mean of scores was not correlated with any of the other variables. Choices between rounds were independent. Weak correlation was found only between round 1 with a risky choice in round 2 (r=-0.142; p=0.039).
Validity evidence based on response processes
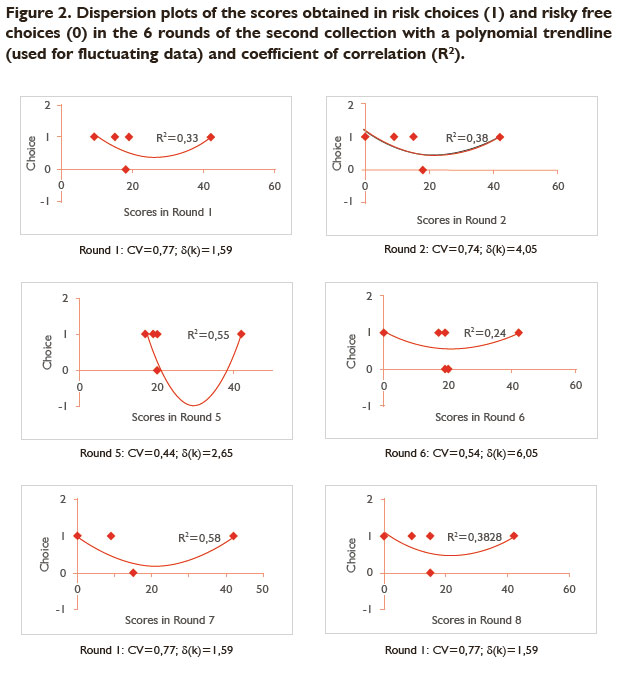
Figures 1 and 2 show dispersion of scores based on risk choices and risk-free choices in each round, together with trendlines for both times of data collection. Except for rounds 3 and 4, the trendlines are concave upward, indicating that risk-free choices resulted in median scores; that is, these individuals did not score high enough to receive a reward, while risky choices fluctuated between extremes (Figure 1).
The dispersion plots for the second sample (Figure 2), together with the polynomial trendline, indicate the same pattern presented in Figure 1 for all the rounds. No correlation was found in the choices between rounds and the score from the previous round; that is, the result obtained in one round did not impact in the risk decision in the following round. The reliability of the set of rounds was estimated by the frequency of risk-prone choices or risk-averse choices in each round; KR-20 was 0.54.
Validity evidence based on external criteria
In the first data collection, men and women differed in the three measures indicated in the instrument: mean of CV index [F(1, 209)=7.55; p=0.007; effect=0.04]; men obtained the highest means (Mmen=0.74; SD=0.26; Mwomen=0.65; SD=0.19); frequency of risky choices [F(1, 209) = 7.24; p=0.008; effect=0.03]; men also presented the highest means (Mmen=4.59; SD=1.60; Mwomen=4.04; Sd=1.60); δ(k) [F(1, 209)=4.81; p=0.03; effect=0.02]; again, men obtained the highest scores (Mmen=2.91; SD=0.84; Mmen=2.62; SD=1.05).
Likewise, in the second collection there was a difference between men and women in the three measures: mean of CV index [F(1, 30)=8.59; p=0.006; effect=0.22]; mean obtained the highest means (Mmen=0.79; SD=0.19; Mwomen=0.55; SD=0.26); frequency of risky choices [F(1, 30) = 8.42; p=0.008; effect=0.007], also with the highest means among men (Mmen=5.00; SD=1.07; Mwomen=3.71; SD=1.40); δ(k) [F(1, 30)=10.61; p=0.003; effect=0.26] with the highest mean obtained by men (Mmen=3.21; SD=0.78; Mwomen=2.20; SD=0.96).
Discussion
This study's objective was to develop, standardize and validate a card game instrument to study risk propensity, including uncertainty regarding outcomes. Based on these initial hypotheses of validity and the analysis of the most appropriate index to measure risk, we reached an instrument with validity evidence based on response processes and external criteria for six alternatives.
We had originally considered eight alternatives, however, two rounds (3 and 4) were excluded from the final instrument because their indexes were not compatible with the proposed definition of risk. A descriptive analysis of rounds 3 and 4 indicated they were the options with the best return of scores for those who took risks (δ(k)). The chance to lose was small and participants gained much if they took the risk, which was favorable for those choosing the risk alternative, without necessarily having to make a decision regarding gains and losses (Das & Teng, 2001; Figner & Weber, 2011; Helfinstein et al., 2014). As the chances of gain became greater in the certainty pile, the number of people who avoided risks also increased.
The six remaining rounds presented variation of return based on scores obtained in relation to the strategy chosen (risk versus no risk). As previously discussed, it is essential that chances of outcomes vary for us to nominate a choice as being risky (Figner & Weber, 2011; Helfinstein et al., 2014). Lack of correlation between rounds suggests there is a certain degree of independence among them, indicating that people analyzed the circumstances regarding the possibility of losses and gains in each round and not in relation to the score they obtained over the course of the game. Evidence regarding such independence, however, should be verified in future research. Considering the findings of Van den Bos et al. (2013) on the existence of a learning curve over the course of rounds, it is important to increase the number of rounds and make them random so that more information can be obtained regarding this independence.
This study's results confirm the results reported by previous studies, indicating that men are more prone to risk than women (Charness & Geneezy, 2011; Van den Bos et al., 2013) for all the indexes analyzed. This leads to the conclusion that this instrument is valid in terms of contrasting groups.
In regard to the indexes measuring risk sensibility, in contrast with what is proposed by Weber et al. (2004), that is, using CV for gambling task instruments and approaches that indicate the use of the δ(k) index including the element of loss (Eid Jr et al., 2005), the results found in this study do not allow us to establish the most appropriate risk measurement index to be used in this instrument. The reason is that sometimes participants' decisions were more similar to the CV index and sometimes more similar to the δ(k) index. When rounds 3 and 4 were still being considered, the participants seemed to identify the best return between these two alternatives, and more than 90% made risky decisions, which approximates the participants' perception of the δ(k) index. The order of risk propensity assumed in the other rounds, that is, descending in the rounds from participants who assumed more risks to those who assumed fewer risks, however, did not indicate that they considered the best return or analyzed the variability of results around the mean (CV). We should, however, consider that this order was relatively stable in the two data collections: in the first collection, the rounds in which the participants more frequently took risks were 8, 2, 7, 6, 1 and 5; in the second collection, the distribution was 8, 1, 2, 6, 7 and 5. Therefore, the results do not allow us to discard any of the indexes before more studies are conducted.
Additionally, the participants had incomplete information on each choice, as the exact percentage of cards with zero and cards with numbers was not reported, a procedure that differs from what was adopted by Weber and collaborators (2004). According to Rode, Cosmides and Tooby (1999), when comparing the result of the same option in which information is reported on probability versus incomplete information, the result in relation to risk changes, indicating there is an ambiguity effect when probability is not reported. Rather than analyzing the choice only, to make a decision based on incomplete information, the participants have to take into account the outcome expectation, the variability outcome, and one's need to reach the more likely decision to satisfy such a need. Given the previous discussion, we suggest future studies to investigate the order of risk propensity when making decisions based on instructions that report the probability of each choice.
Additionally, the inclusion of loss must be related to the unexpected result that the participants made more risky choices in all the rounds, considering that research indicates that human beings are averse to risk, as well as other animals, when they are not in danger (i.e., risk of dying of hunger - Weber et al., 2004). According to Das and Teng (2001), risk aversion is more predictable in situations in which there is only possibility of gain, however, an adjustment of strategies seem to exist in situations of loss. Kahneman and Tversky (1979) believe that even though people instinctively make decisions by judging probability of gain and loss of each action, they end up being prone to risk in situations of loss in order to recover from loss, since we are more sensitive to loss than to gains.
The conclusion is that the gambling task instrument was composed of six independent rounds and presents indications of validity evidence based on response processes and external criteria. Future research should compare instructions with complete and incomplete information regarding the probability of choices, in order to compare how the structure of the game influences the outcome and also proceed with investigating which is the most suitable index of sensibility to risk. In the future, we suggest keeping the possibility of losing points and also a ranking, since we perceive these are alternatives for research conducted in the Brazilian context and observe the participants engaging in the task. We also believe the sample needs to be expanded in terms of age and socioeconomic groups to validate the instrument more broadly.
References
Bechara, A., Damasio, A. R., Damasio, H., & Anderson, S. W. (1994). Insensitivity to future consequences following damage to human prefrontal cortex. Cognition, 50(1-3),7-15. doi: 10.1016/0010-0277(94)90018-3 [ Links ]
Blais, A. R., & Weber, E. U. (2006). Testing invariance in risking taking: a comparison between Anglophone and Francophone groups. Scientific Series (CIRANO), 1-25. [ Links ]
Boyer, T. W. (2006). The development of risk-taking: a multi-perspective review. Developmental Review, 26(3),291-345. doi: 10.1016/j.dr.2006.05.002. [ Links ]
Charness, G., & Gneezy, U. (2011). Strong evidence for gender differences in risk taking. Jornal of Economic Behavior & Organization, 83(1),50-58. doi: 10.1016/j.jebo.2011.06.007. [ Links ]
Charness, G., Gneezy, U., & Imas, A. (2013). Experimental methods: eliciting risk preferences. Jornal of Economic Behavior & Organization, 87(March),43-51. doi: 10.1016/j.jebo.2012.12.023. [ Links ]
Das, T. L., & Teng, B. S. (2001). Strategic risk behaviour and its temporalities: between risk propensity and decision context. Journal of Management Studies, 38(4),515-534. doi: 10.1111/1467-6486.00247. [ Links ]
Eid, Jr., W., Rochman, R. R., & Taddeo, M. (2005). Medidas de desempenho de fundos considerando risco de estimação. In Encontro Brasileiro de Finanças, 5, São Paulo, Anais. São Paulo: Sociedade Brasileira de Finanças. [ Links ]
Figner, B., & Weber, E. U. (2011). Who takes risk when and why? Determinants of risk-taking. Current Directions in Psychological Science, 20(4),211-216. doi: 10.1177/0963721411415790. [ Links ]
Helfinstein, S. M., Schonberg, T., Congdon, E., Karlsgodt, K. H., Mumford, J. A., Sabb, F. W., Cannon, T. D., London, E. D., Bilder, R. M., & Poldrack, R. A. (2014). Predicting risky choices from brain activity patterns. Proceedings of the National Academy of Sciences, 111(7),2470-2475. doi: http://10.1073/pnas.1321728111. [ Links ]
Kahneman, D., & Tversky, A. (1979). Prospect theory: an analysis of decisions under risk. Econometrica, 47(2),262-291. [ Links ]
Lejuez, C. W., Read, J. P., Kahler, C. W., Richards, J. B., Ramsey, S. E., ... Stuart, G. L.. (2002). Evaluation of a behavioral measure of risk taking: the balloon analogue risk task (BART). Journal of Experimental Psychology: Applied, 8(2),75-84. doi: 10.1037/1076-898X.8.2.75. [ Links ]
Loewenstein, G. F. Weber, E. U., Hsee, C. K. & Welch, E. S. (2001). Risk as feelings. Psychological Bulletin, 127(2),267-286. doi: 10.1037/0033-2909.127.2.267. [ Links ]
Resolução n. 196 (1996, 10 de Outubro). Conselho Nacional de Saúde (National Health Concil), Brasília, DF. Disponível: conselho.saude.gov.br/docs/Reso196.doc. [ Links ]
Rode, C., Cosmides, L., Hell, W., & Tooby, J. (1999). When and why do people avoid unknown probabilities in decision under uncertainty? Testing some predictions from optimal foraging theory. Cognition, 72(3),269-304. doi: 10.1016/S00100277(99)00041-4. [ Links ]
Trivers, R. L. (1972). Parental investment and sexual selection. In B. Campbell (Ed.). Sexual selection and the descent of man (pp. 136-207). Chicago: Aldine Publishing Company 1871-1971. [ Links ]
Van den Bos, R., Homberg, J., & de Visser, L. (2013). A critical review of sex differences in decision-making tasks: focus on the Iowa Gambling Task. Behavioural Brain Research, 238(0),95-108. doi: 10.1016/j.cobeha.2017.03.001. [ Links ]
Weber, E. U., Shafir, S. & Blais, A. R. (2004). Predicting risk-sensitivity in humans and lower animals: risk as variance or coefficient of variation. Psychology Review, 111(2),430-445. doi: 10.1037/0033-295X.111.2.430. [ Links ]
Submission: 12.2.2016 Mailing address:
Patrícia Izar
Universidade de São Paulo, Instituto de Psicologia, Departamento de Psicologia Experimental
Av. Prof. Mello Moraes, 1721. Butantã
CEP: 05508030 - São Paulo, SP - Brasil
E-mail:patrizar@usp.br
Acceptance: 18.4.2017

