


Serviços Personalizados
artigo
 texto em
  Inglês (pdf)
 Artigo em XML
 Referências do artigo
Indicadores

Compartilhar

 Permalink
Psicologia: teoria e prática
versão impressa ISSN 1516-3687
Psicol. teor. prat. vol.23 no.3 São Paulo set./dez. 2021
http://dx.doi.org/10.5935/1980-6906/ePTPPE13873
10.5935/1980-6906/ePTPPE13873 ARTICLES
PSYCHOLOGY AND EDUCATION
Development and validation of the Environment Characterization Inventory for Early Education
Desenvolvimento e validação do inventário de caracterização de ambientes para a educação inicial
Desarrollo y validación del inventario de caracterización de ambientes para educación inicial
Nadir Díaz-Simón ; Dinorah de León; Dahiana Fitipalde; Alejandro Vásquez-Echeverría
University of the Republic, Montevideo, Uruguay
ABSTRACT
In this study, the Environment Characterization Inventory for Early Education (INCA-EI) psychometric properties and the effect of socioeconomic context and type of institution on the quality of environments were assessed. One hundred forty-two early education classrooms were evaluated. The analysis of Unidimensionality for the Structure Dimension and the CFA for the Process Dimension showed a good fit of the items to the Structure sub-dimensions (p > .05; CFI > .90; RMSEA < .08) and validated the organization of three correlated factors in the Process sub-dimensions (χ2=323.82; RMSEA=.06; CFI=.96; TLI=.96). The instrument presents good internal consistency values (α=.88; ω=.93) and moderate to considerable agreements in most scores in the inter-rater reliability analysis (ICC=.80). Differences are presented between the quality of the environment of schools and kindergartens and Institutions of different socioeconomic contexts. The results show that INCA-EI is a valid and reliable instrument for evaluating environments in early education, which can be used for research purposes and monitoring of public policies.
Keywords: school environment; early education; validity; reliability; socioeconomic status.
RESUMO
Neste estudo, foram avaliadas as propriedades psicométricas do Inventário de Caracterização de Ambientes para a Educação Inicial (INCA-EI) e o efeito do contexto socioeconômico e do tipo de instituição na qualidade dos ambientes. Foram avaliadas 142 salas de aula de educação inicial. A análise da Unidimensionalidade para a Dimensão Estrutura e a AFC para a Dimensão Processo mostraram um bom ajuste dos itens às subdimensões da Estrutura (p>.05; CFI >.90; RMSEA<.08), validando a organização de três fatores correlacionados nas subdimensões do Processo (χ2=323.82; RMSEA=.06; CFI=.96; TLI=.96). O instrumento apresenta bons valores de consistência interna (α =.88; ω =.93) e acordos moderados e consideráveis na maioria das pontuações no acordo entre juízes (ICC=.80). São apresentadas diferenças entre a qualidade do ambiente de escolas entre jardins e instituições de diferentes contextos socioeconômicos. Os resultados mostram que o INCA-EI constitui um instrumento válido e confiável para avaliação de ambientes na educação inicial, que pode ser utilizado para fins de pesquisa e monitoramento de políticas públicas.
Palavras-chave: ambiente escolar; educação inicial; validade; confiabilidade; contexto socioeconômico.
RESUMEN
En este estudio se evaluaron las propiedades psicométricas del Inventario de Caracterización de Ambientes para Educación Inicial (INCA-EI), y el efecto del contexto socioeconómico y tipo de institución en la calidad de ambientes. Fueron evaluadas 142 aulas de educación inicial. El análisis de Unidimensionalidad para la Dimensión Estructura y el AFC para Dimensión Proceso mostró buen ajuste de los ítems a las subdimensiones de Estructura (p>.05; CFI >.90; RMSEA<.08), validando la organización de tres factores correlacionados en las subdimensiones de Proceso (χ2=323.82; RMSEA=.06; CFI=.96; TLI=.96). El instrumento presenta buenos valores de consistencia interna (α =.88; ω =.93), y acuerdos moderados y considerables en la mayoría de puntuaciones en el acuerdo interjueces (CCI=.80). Se presentan diferencias entre la calidad de ambiente de Escuelas y Jardines e Instituciones de diferentes contextos socioeconómicos. Los resultados muestran que el INCA-EI constituye un instrumento válido y confiable para la evaluación de ambientes en educación inicial, que puede ser utilizado con fines investigativos y monitoreo de políticas públicas.
Palabras clave: ambiente escolar; educación inicial; validez; confiabilidad; contexto socioeconómico.
1. Introduction
The first years of life are crucial for developing cognitive, affective, motor, and social skills, when educational investment yields high return rates (Araujo & López-Boo, 2010). Consequently, the quality of care and educational service environments provided to children at this stage are a central issue in educational policy, developmental research, and professional practice (Perlman & Fantuzzo, 2013). In recent decades, several Latin American governments have focused their efforts on expanding early childhood education coverage (Berlinski & Schady, 2015) and ratified their commitment in regional agreements, such as The Educational Goals, 2021 (Organización de Estados Iberoamericanos para la Educación, la Ciencia y la Cultura, 2008) or the UN Sustainable Development Goals (United Nations General Assembly, 2015). Attendance to educational institutions has been made compulsory from the age of five years old in countries like Colombia, four years old in countries such as Argentina, Uruguay, and Brazil, and even from the age of three years old in Mexico and Peru (Gamboa & Krüger, 2016). The next natural step to promote equality of development in the educational context is to improve the quality of preschool environments.
The educational environment is defined as the broad set of physical, social, psychological, and intellectual conditions in which the teaching and learning process occurs (American Psychological Association, 2015). It is possible to identify two major dimensions in the study of the quality of educational environment (Burchinal, Magnuson, Powell, & Hong, 2015). The first dimension consists of the structural elements, which include the number of students enrolled in the classroom, the student-teacher ratio, the length of the school day, the quality of the spaces and furniture, and the variety of teaching materials available in the institution. The second dimension comprises the procedural aspects of the school environment, including the organization of the school day; habits, routines, and norms; the quality of interactions between teaching staff and students; emotional and institutional support; interaction with external agents, such as parents and community institutions; and continuous improvement systems, which constitute measures to promote improvements in the conditions of educational centers.
The quality of the educational environment has been related to different outcomes in child development and teacher well-being and is considered crucial to achieving Goal 4.2 of the Sustainable Development Goals, which refers to school readiness (Unicef, 2012; Vásquez-Echeverría, 2020). For example, regarding structural elements, it has been found that the distribution of classroom furniture promotes a greater number of interactions between teachers and students (Cardellino, Araneda, García-Alvarado, 2018). Likewise, research has shown the relevance of having furniture designed and adapted to children's anthropometric characteristics to avoid neck pain and potential injuries to the musculoskeletal system, back, and shoulder (Milanese & Grimmer, 2004). It has also been suggested that noise in classrooms affects school performance (Klatte, Bergström, & Lachmann, 2013), that poor ventilation and air temperature can reduce school performance by up to 30% (Wyon et al., 2010), and that lighting characteristics can affect students' concentration (Singh et al., 2020).
Regarding procedural or interaction variables, the quality of interactions between teachers and students has been studied extensively. These predict children's performance in language (Sabol & Pianta, 2014), academic performance (Shamaki, 2015), and executive functions (Weiland et al., 2013). Students in lower-quality educational environments are more likely to present anxious and aggressive behaviors (Werthamer-Larsson et al., 1991). Mashburn et al. (2008) reported that higher richness in instructional and emotional interactions is related to better academic and socioemotional skills in children, respectively. In another study, Anderson and Phillips (2017) showed that instructional and emotional support from preschool teachers is related to academic development and, through these immediate effects, predicts performance in school with small effects. On the other hand, a higher-quality school environment and, more specifically, better processes have been related to teacher well-being and lower levels of burnout (Braun, Roeser, Mashburn, & Skinner, 2019; Hoglund, Klingle, & Hosan, 2015), showing the importance of considering the quality of the educational environment as an integral part of working conditions.
Many educational environment assessment instruments are used as tools for research, monitoring, accreditation, and improvement of preschool educational programs (Berlinski & Schady, 2015; Halle, Vick Whittaker, & Anderson, 2010). Two of the most widely used instruments are the Classroom Assessment Scoring System (CLASS) (Pianta, La Paro, & Hamre, 2008) and the Early Childhood Environment Rating Scale-Revised (ECERS-R) (Harms, Clifford, & Cryer, 1998). The CLASS, which was developed as a part of the Teaching through Interactions model (Hamre & Pianta, 2007), seeks to understand the classroom processes that contribute to student learning and development by evaluating the classroom environment's procedural aspects. Likewise, the ECERS-R was developed to provide a self-assessment tool for programs and identify programs' strengths and weaknesses for continuous quality improvement in early childhood centers (Harms et al., 1998) by evaluating structural and procedural aspects of the classroom environment.
However, the availability of instruments for assessing and characterizing the classroom environments that are culturally valid and accessible to educational systems continues to be a challenge (Berlinski & Schady, 2015). Evidence suggests that the most widely used scales have limitations in cultural adaptation to Latin American and other regions' school centers. For example, the CLASS presents significantly lower values in the Emotional Support and Institutional Support subscales in Chilean institutions (Leyva et al., 2015) than those reported in the United States (Burchinal et al., 2008), which could be interpreted as a cross-cultural difference. On the other hand, the revised version of the ECERS and specifically the items that assess child-centered activities did not show structural or predictive validity in 61 Colombian classrooms (Betancur-Cortes, 2016). Researchers in Switzerland (Kärrby, 1989), China (Li, Ying Hu, Pan, Qin, & Fan, 2014), India (Isley, 2000), and Cambodia (Rao & Pearson, 2007) have had to introduce substantive changes to the scale to adapt the items to the particularities of the social and educational context of those countries. Furthermore, research on the underlying organization of the ECERS/ECERS-R has found inconsistent results in terms of factor structure, varying from one unidimensional global quality factor (Holloway, Kagan, Fuller, Tsou, & Carroll, 2001) to two factors (Cassidy, Hestenes, Hegde, Hestenes, & Mims, 2005) or three factors (Perlman, Zellman, & Le, 2004). The inconsistencies in this instrument's factor structure in different countries may also be related to the cultural specificity of how the quality of the environment in preschool manifests or is socially defined.
Considering this background and the concerns related to the validity of the instruments available for measuring the environment's quality (Burchinal, Kainz, & Cai, 2011), we consider that any use of the existing scales in a new cultural context implies a process of adaptation and validation. Likewise, the high cost of acquiring the instruments and the certified training required for their use is a significant limitation for a projected intensive use on a national scale in a developing country. Therefore, a new assessment tool was needed for a high-frequency, reliable, and valid assessment of Uruguay's educational environment. The Environment Characterization Inventory for Early Education (INCA-EI by its acronym in Spanish) was developed to address these difficulties. This tool aims to be a scale that integrates the assessment of structural and procedural aspects with cultural sensitivity, open access, and independence in the training of local applicators for research and monitoring of public policies in early childhood. Therefore, the present work has two main objectives: a) to determine the initial psychometric properties of INCA-EI, a new instrument for assessing the quality of environments for preschool education; and b) to analyze the association between the quality of a school environment with the socioeconomic context of the center and its typology within the Uruguayan educational system.
2. Method
2.1 Development of the First Version of the Instrument
The development of the dimensional structure and the INCA-EI items was based on three steps. First, a review was carried out in the EBSCO host database using the keywords "classroom environment", "preschool education", and "quality of classroom environments.'' Refereed publications in English or Spanish between January 2000 and June 2019 with populations that comprised preschool ages (approximately 3 to 5 years old) were selected, systematized, and codified. This search made it possible to identify aspects of the quality of educational environments related to child development and personnel well-being. Based on this search, we found that the tools most used in these studies were the CLASS (Pianta et al., 2008) and the ECERS-R (Harms et al., 1998). Finally, we analyzed the Uruguayan Early Education system's governing documents (e.g., preschool education programs). Based on this information, a first version of the instrument was created and organized into two large dimensions, Structure and Processes, which we iterated in the quantity and contents of the items based on the work that we describe below. To evaluate their content validity, we submitted the dimensional structure and items to the judgment of six experts with background in child development or development environments, who met the criteria established by Skjong and Wentworth (2001) of experience in conducting judgments and decision making based on evidence or expertise, reputation in the community, availability, motivation to participate, and impartiality. Subsequently, a pilot study was carried out in 19 classrooms of 10 institutions of the public system in Montevideo to analyze the items' adequacy and the usability of the instrument. According to the type of center and socioeconomic level, the educational authorities selected these institutions based on representativeness criteria. Based on the pilot study's quantitative-qualitative analysis and the experts' judgments, changes were made to the inventory, or indicators that were difficult to measure were eliminated.
2.2 Participants
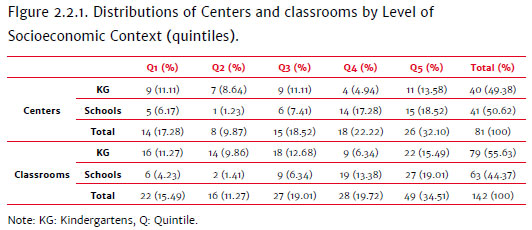
A total of 142 classes from 81 urban educational centers in Montevideo's public early education system were evaluated. Evaluations were carried out in 40 kindergartens (63.49% of the 63 public kindergartens in the capital) and 41 primary schools with preschool classes (17.01% out of the 241 primary schools with a preschool). The educational authority provided the list of centers to contact, which did not imply their obligation to participate in the study. From this list, a member of the research team contacted a randomly selected center by telephone, respecting quotas in the assignment to strata according to the type of center, level, and quintile of socioeconomic status. The teachers' mean work experience was 16.53 years (SD=7.67, range 1 to 43). The average number of enrolled students per class was 26 (SD=4.24), and the average attendance percentage of students enrolled on the assessment day was 73.76%.
Public preschools can be classified according to two main elements: the type of institution and the level of socioeconomic context (LSC). According to the type of institution, the centers are classified into kindergartens (centers that only have Age 3, 4 and 5 classrooms) and schools (centers with Age 3, 4 and 5 classrooms and all elementary school grades). According to the LSC, the centers are organized into quintiles. Quintile 1 includes 20% of the centers with the most vulnerable context, and quintile 5 includes the 20% with the least social vulnerability. These quintiles are constructed based on the characteristics of the population that attends the centers and considers the educational level of the children's parents and the basic needs met by the families (Figure 2.2.1). Some of the centers included in quintiles 1 and 2 integrate the Priority Attention Program in Environments with Relative Structural Difficulties (Aprender by its acronym in Spanish), through which an attempt is made to deploy inclusion policies to integrate and articulate actions that focus on the most vulnerable populations. Therefore, they receive priority in terms of pedagogical attention and distribution of material resources.
2.3 Instruments
Environment Characterization Inventory for Early Education (INCA-EI): it was designed to evaluate the classroom environment's structural and processual aspects in regard to early childhood education. It has two sources of information: non-participant direct observation and a semi-structured interview with the teacher. The version used in this study was composed of 71 items divided into two dimensions: Structure (44 items) and Processes (27 items). These items are answered on a four-point scale based on the presence or absence of specific indicators.
The Structure dimension assesses the infrastructural conditions necessary for educational experiences that promote the development and learning to occur. It has two subscales, the first Spaces of the Center, which groups the items that are evaluated in the Classroom (7 items), Bathroom (5), Canteen (7), Courtyard (5), and Common Indoor Space (6). Also, the INCA-EI allows measurements of cross-sectional indicators to be obtained, such as Amplitude, Ventilation, Acoustics, Brightness, Cleanliness, Safety, Accessibility, and Maintenance. The second subscale is Didactic Materials, which evaluates the quality and variety of didactic materials available in the classroom or the institution (ten items). The Processes dimension assesses how the educational process occurs: how it is implemented by the teaching staff, as well as the characteristics of the interactions between the institution's staff, family members, and children. This dimension is composed of four subscales: Classroom Organization (9 items), Teaching Practices (7), Emotional Support (6), and Relationship with the Family (5). It is necessary to observe the class for at least four hours in one day to administer the INCA-EI, including students' entry into or exit from the center. Likewise, it is recommended that the attendance of the registered children be more than 50% during the assessment day.
2.4 Procedure
The Ethics Committee of the Faculty of Psychology of the University of the Republic and the Council of Preschool and Elementary Education (CEIP) of the National Administration of Public Education approved this project. Using a database with information on the educational centers with preschool education classrooms in Montevideo (CEIP, 2018), the centers' principals were contacted by telephone to receive an invitation to participate in the study. Of the total 118 institutions contacted, 81 agreed to participate (acceptance rate=69%); 21 centers (18%) indicated that they did not have availability; 16 (14%) initially accepted the invitation, but the visit could not be made for various reasons beyond the control of the research team. The day of the visit to the center was coordinated with the centers' principals. An evaluator trained in INCA-EI administration attended with the necessary documentation (copy of CEIP authorization, study information sheet, and informed consent). For the inter-observer agreement analysis, 27 classrooms of the total 142 were independently assessed by two evaluators.
A total of six evaluators carried out the fieldwork, including two stable members of the research team and four undergraduate students, who received university credits for their participation in the project and took a 26-hour course on development and school environment assessment using the INCA-EI. The evaluators who were members of the research team carried out 86% of the total evaluations. The students had to reach agreement indices of k=.80 with the research team member with whom they completed the training. Once in the classroom, the researcher introduced him/herself and sat at the back of the room or in a place where the class dynamics would be less affected. As indicated in the INCA-EI Application Manual, the evaluation usually begins with the Structure dimension items, but the processes that occur in the different activities proposed by the teacher during class are always kept in mind. It was typical for the evaluator to accompany the group to another educational center sector (e.g., courtyard, gymnastics room, library). At this time, the school's internal maintenance was observed, as well as the security conditions and the distance from the bathrooms to the classroom. During the class break or while the children were completing a task, the researcher interviewed the teachers about their training and group characteristics.
2.5 Data Analysis
We used SPSS v20 and Mplus 8.0 for data analysis. For the imputation of missing data, the EM algorithm (Expectation-Maximization) was used with 25 iterations, given that Little's MCAR test allowed it (χ2=195.02; p=.99).
Cronbach's Alpha (α) and McDonald's Omega (ω) coefficients were used to analyze internal consistency. Values above .65 were considered acceptable (Katz, 2006) and can be considered of good consistency as of .70, in both coefficients (Oviedo & Campos-Arias, 2016). For the inter-rater agreement analysis, the Intraclass Correlation Index was used; we considered values between .50 and .75 as moderate agreement, between .75 and .90 as considerable agreement, and higher than .90 as excellent agreement (Koo & Li, 2016). For the analysis of internal structure validity, a unidimensionality analysis was performed on the Structure scores, and a comprehensive analysis of the Processes dimension was performed by carrying out a Confirmatory Factor Analysis (CFA). Since the fit estimators used are sensitive to sample size, only subscales with more than 100 valid cases were included. The criteria of Sharma, Mukherjee, Kumar, and Dillon (2005) were used: Root Mean Square Error of Approximation (RMSEA) close to 0.05; Comparative Fit Index (CFI) and Tucker Lewis Index (TLI) greater than or equal to 0.90. Regarding the magnitude of the effects, the criteria of Ferguson (2009) were followed. For minimum practical utility, the Cohen's d value will be d > 0.41, and eta squared will be (η2) > .04; moderate effects will be considered d > 1.15 andη2 > .25; strong effects will be considered d > 2.70 andη2 > .64.
3. Results
3.1 Validity of Internal Structure
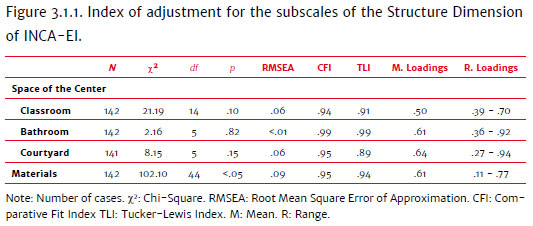
Initially, an analysis was performed to confirm the unidimensionality of the Structure subscales (Figure 3.1.1). Of the 81 institutions evaluated, 41 of them (50.62%) had Canteens, and 48 had a Common Indoor Space (59.26%), so the total number of classrooms was insufficient for the factor analysis, and they were excluded. The results indicate a good fit to the confirmatory model for all the subscales of Structure (p > .05; CFI > .90; RMSEA < .08) (Sharma et al., 2005) except for Didactic Materials, which presents some suboptimal indicators, but which is acceptable as a whole. The CFA results on the Processes dimension show a good fit to a model composed of three correlated factors (χ2=323.82; RMSEA=.06; CFI=.96; TLI=.96). The Relationship with the Families subscale was also excluded from the analysis because of the low number of cases (N=51). It should be noted that modeling a second-order factor of the Processes dimension generates almost identical results in the fit.
3.2 Descriptive Analysis
The descriptive analyses (central tendency and dispersion) of the INCA-EI items and scores showed adequate variability. The analysis of frequencies in the categories showed that 62 items (86.11% of the total) used the full range of scores (from 1 to 4). Among those that did not achieve this, the case of Accessibility stands out. Accessibility evaluates the presence of structures and accessories that enable access and use of spaces for people with reduced mobility, such as students, staff, or family members who use wheelchairs, walkers, or crutches. The mean of the cross-sectional indicator Accessibility is the lowest of the entire scale, with frequent use of low scores (1 and 2). For example, in the item Bathroom Accessibility (E32), 60% of the scores indicate the absence of structures such as ramps, handrails, or sufficient space for the use of restrooms by children with reduced mobility.
3.3 Correlations and Internal Consistency Analysis
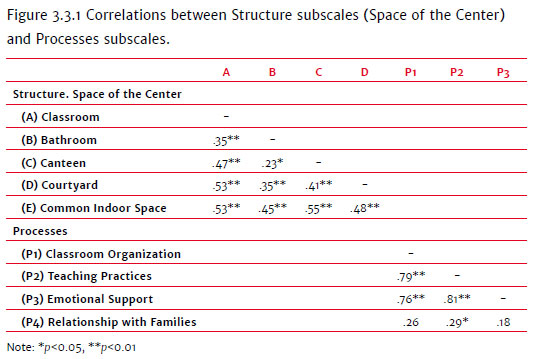
The relationship between the scores of the Dimensions and Subscales was analyzed through Pearson's correlation coefficient. Moderate correlations were observed between the subscales (see Figure 3.3.1). A moderate and significant correlation, r=.34; p < 0.01, was also found between the two dimensions' scores (Structure and Process) of the INCA-EI.
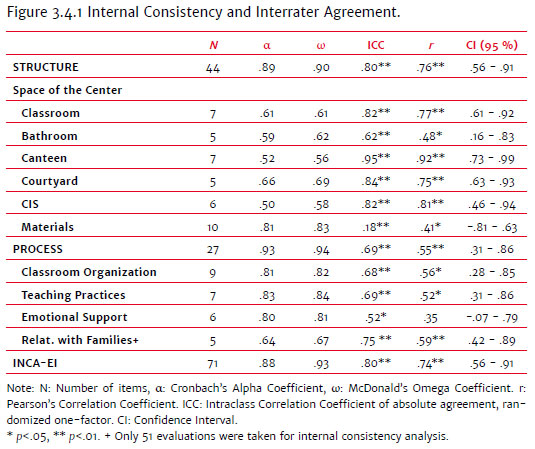
The results of the internal consistency analysis (Figure 3.4.1) show that both dimensions (Structure and Processes) show reliability values above .80, which can be considered good according to George and Mallery (2003). Regarding the reliability analysis performed through the McDonald's Omega Coefficient, which is a more robust measure that is less affected by the number of items (McDonald, 1999), we observed subscales with values above .65, which is considered an acceptable consistency (Katz, 2006), and subscales in the range of .70 to .90, which is considered good (Campo-Arias & Oviedo, 2008). Both dimensions' scores present excellent coefficients.
3.4 Inter-observer Agreement Analysis
The analysis of the Intraclass Correlation Index (ICI) to evaluate the inter-observer agreement of the evaluation of the 27 classrooms shows degrees of agreement ranging from Moderate (.41-.60), to Considerable (.61-.80), to Almost perfect (.81-1.00). Only the Materials subscale showed low inter-rater agreement, while the Acoustics cross-cutting indicator and the Emotional Support subscale show room for improvement (see Figure 3.4.1).
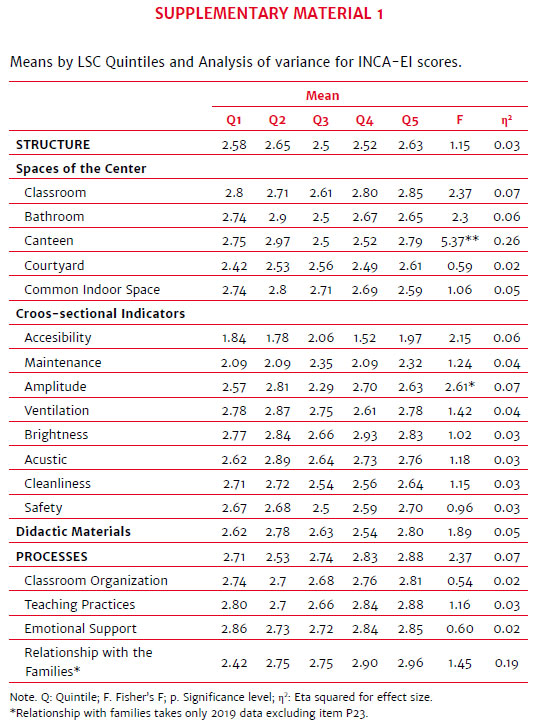
3.5 Differences between quintiles of socioeconomic context
Analysis of Variance (ANOVA) was performed to determine the LSC's effect on the classroom environment's quality. Statistically significant differences with moderate effect size were found with respect to Canteen scores (F (4,62)=5.37; p < .01;η2=.26) and with low effect size for Amplitude (F (4, 137)=2.61; p=.04;η2=.07), reaching the lowest scores in quintile 3 in both cases. Tukey's test for post hoc analysis shows statistically significant differences between Canteen scores of quintile 2 and those of quintile 3 (p < .01) and quintile 4 (p < .01). Regarding Amplitude, differences were found between quintiles 2 and 3 (p=.05). No significant differences were found in the Processes Dimension. However, we found some differences with marginal statistical significance (p=.06) that may be of interest to consider. This is the case for Classroom (F (4, 137)=2.37; p=.06;η2=.07), Bathroom (F (4, 137)=2.30; p=.06,η2=.06), and the Process Dimension (F (4, 132)=2.37; p=.06;η2 =.07) (see Supplementary Material 1).
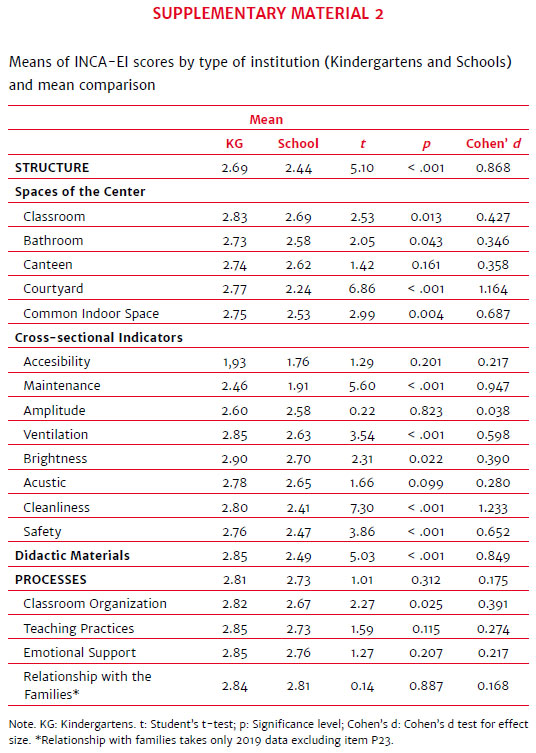
3.6 Differences between schools and kindergartens
The descriptive statistics and mean differences between the dimensions and subscales of the INCA-EI by type of institution (schools and kindergartens) are shown in Supplementary Material 2. The results show statistically significant differences that favor kindergartens in the Structure dimension (t=5.10; p < .001; d=.87). Regarding Center Spaces, we found differences in Classroom (t=2.53; p=.01; d=.43), Restrooms (t=2.05; p=.04, d=.35), Courtyard (t=6.86; p < .001; d=1.16), and Common Indoor Space (t=2.99; p=.01; d=.69). For cross-sectional indicators, we found differences for Maintenance (t=5.60; p < .001; d=.94), Ventilation (t=3.54; p < .001; d=.60), Brightness (t=2.31; p=.02; d=.39), Cleanliness (t=7.30; p < .001; d=1.23), and Safety (t=3.86; p < .001; d=.65). We found differences for Teaching materials available (t=5.03; p < .01; d=.85). In the Process Dimension, we only found differences in Classroom Organization (t=2.27; p=.02; d=.39). Finally, in all subscales in which statistically significant differences were found, the kindergartens have higher scores compared to the schools (see Supplementary Material 2).
4. Discussion
Having valid and reliable instruments adapted to educational systems that allow the assessment of learning environment's structural and procedural components is a necessary starting point for conducting research and informing decision-makers in evidence-based educational policies. Advances in the quality of environments guarantee children's right to receive a quality education and better conditions for teaching performance. This study systematized the evaluation of a large sample of public institutions for early education in the Uruguayan capital city to assess the validity and reliability of an instrument developed to characterize the structural and procedural elements of the classroom environment.
The analyses performed tested the instrument's psychometric properties and allowed us to propose the INCA-EI as a reliable tool for measuring the educational environment for research and public policy advice purposes. Regarding the reliability analysis, which was evaluated through internal consistency and inter-rater agreement assessment of the subscales, dimensions, and overall scale score, very good internal consistency results were found (above .80) both at the subscales and scale levels, similar to the consistency values shown by instruments with similar objectives, such as the ECERS-R (Harms et al., 1998) and the CLASS (Pianta et al., 2008). This evidence shows that the scores obtained at the item level jointly measure the proposed constructs. Regarding the inter-observer agreement assessment, moderate and considerable values were reached, showing shared procedures during the observation process. However, the subscale Materials showed suboptimal results, suggesting that the description or training demanded by the INCA-EI for this subscale should be refined. In the meantime, an alternative for researchers to consider is to use a Structure score without adding the Materials items.
Regarding the validity analysis of the INCA's internal structure, the CFA results show that the set of items of the Processes Dimension is organized based on three factors proposed in the organization of the scale: Classroom Organization, Teaching Practices, and Emotional Support. These results are consistent with the factor structure of instruments focused on assessing processual aspects of the classroom environment, such as CLASS (Pianta, La Paro, & Hamre et al., 2015), and do not support the idea of possible solutions of two potential factors (e.g., Hamre et al., 2013). As a novelty, we note that the second-order model fits the data well in this sample, representing that the total Processes score can be interpreted with confidence by researchers. More broadly, the results suggest that interventions to promote school readiness (Unicef, 2012) at the level of educator-child interactive processes can be oriented towards three major intervention areas as well as the syllabus of teachers' training programs to improve the classroom environment. These learning or public policy programs can eventually be measured through the application of the INCA-EI.
According to the LSC and type of institution, we found significant differences with mainly moderate and high effect sizes, generally in structural aspects (center spaces and materials). Moreover, we show some differences that tend to have statistical significance and for which we would need to continue to expand the sample for greater statistical power. This result supports one of the reasons for creating the INCA-EI, which was conceived to have a discriminatory capacity in these aspects. Concerning the LSC, the differences observed in a "U" shape at the structure level may be due to the particular support policies that schools in quintiles 1 and 2 (belonging to the "Programa Aprender") have received, while those in higher quintiles may be due to the activity of joint initiatives between the school and the family for the improvement of material conditions and teaching staff. The differences between the types of institutions could be explained by the fact that kindergartens present a more specialized infrastructure for the age range of the attending preschool children compared to primary schools with kindergarten classrooms, which are designed for the use of a wider range of ages.
A relevant indicator that should characterize the quality of formal education environments is to allow students, staff, and family members to access and use the center's spaces safely, autonomously, and comfortably. Perhaps one of the most critical results obtained from applying the INCA-EI refers to the limitations in accessibility for people with reduced mobility or visual impairment in a considerable number of centers. This is evidenced by architectural barriers and the absence of ramps, handrails, and other elements that allow people with different needs to use the institution's spaces daily.
Although these results constitute a solid basis for generating continuous evaluation systems for measuring the quality of educational environments, it is also necessary to emphasize two main limitations of this study. First, the sample is made up of only urban early education institutions in the public system in the capital city; it is necessary to broaden the sample in terms of representativeness at the national level for schools and kindergartens including other regions, rural schools, and private educational institutions. This will allow a better characterization of the spectrum of realities in which students and teachers develop the teaching and learning process, and expand the sample size. Finally, there is no test-retest reliability analysis. These limitations are the guidelines for future research in the INCA-EI development.
References
American Psychological Association - APA (2015). APA Dictionary of Psychology. (G. VandenBos, Ed.), APA Dictionary of Psychology (Second Edition). Washington: American Psychological Association. doi: 10.1037/h0081324 [ Links ]
Anderson, S., & Phillips, D. (2017). Is pre-K classroom quality associated with kindergarten and middle-school academic skills? Developmental Psychology, 53(6),1063-1078. doi: 10.1037/dev0000312 [ Links ]
Araujo, M. A., & López-Boo F. (2010) Invertir en los primeros años de vida: Una prioridad para el BID y los países de América Latina y el Caribe. Washington: Banco Interamericano de Desarrollo. [ Links ]
Berlinski, S., & Schady, N. (Eds). (2015). Los primeros años: el bienestar infantil y el papel de las políticas públicas. Washington: Banco Interamericano de Desarrollo. [ Links ]
Betancur-Cortes, L. (2016). Measuring quality of preschool education in low-and middle-income countries: Analysis of validity of the Early Childhood environment rating scale-revised in Colombia. (Master's Thesis). University of Pittsburgh, Pittsburgh. [ Links ]
Braun, S. S., Roeser, R. W., Mashburn, A. J., & Skinner, E. (2019). Middle school teachers' mindfulness, occupational health and well-being, and the quality of teacher- student interactions. Mindfulness, 10(2),245-255. doi: 10.1007/s12671-018-0968-2 [ Links ]
Burchinal, M., Howes, C., Pianta, R. C., Bryant, D., Earl, D., Clifford, R., & Barbarin, O. (2008). Predicting child outcomes at the end of kindergarten from the quality of pre-kindergarten teacher-child interactions and instruction. Applied Developmental Science, 12(3),140-153. doi: 10.1080/10888690802199418 [ Links ]
Burchinal, M., Kainz, K., & Cai, Y. (2011). How well do our measures of quality predict child outcomes? A meta-analysis and coordinated analysis of data from large-scale studies of early childhood settings. In M. Zaslow (Ed.), Quality measurement in early childhood settings (pp. 11-33). Baltimore, MD: Paul H. Brookes. [ Links ]
Burchinal, M., Magnuson, K., Powell, D., & Hong, S. S. (2015). Early childcare and education. In R. M. Lerner & M. E. Lamb. (Eds), Handbook of child psychology and developmental science (pp. 223-267, Vol. 3). New Jersey: John Wiley & Sons. [ Links ]
Campo-Arias, A., & Oviedo, H. C. (2008). Propiedades psicométricas de una escala: La consistencia interna. Revista de salud pública, 10(5),831-839. [ Links ]
Cardellino, P., Araneda, C., & García-Alvarado, R. (2018). Interventions in the classroom: The influence of spatial organisation on educational interaction in Uruguay. Architectural Engineering and Design Management, 14(6),413-426. doi: 10.1080/17452007.2018.1477727 [ Links ]
Cassidy, D. J., Hestenes, L. L., Hegde, A., Hestenes, S., & Mims, S. (2005). Measurement of quality in preschool child care classrooms: An exploratory and confirmatory factor analysis of the early childhood environment rating scale-revised. Early Childhood Research Quarterly, 20(3),345-360. doi: 10.1016/j.ecresq.2005.07.005 [ Links ]
CEIP (2018). Monitor Educativo del CEIP: Estado de Situación 2018. Retrieved from http://www.anep.edu.uy/monitorRepo/Presentaciones%20PDF%20y%20documentos/Estado%20de%20Situacion%202018.pdf [ Links ]
Ferguson, C. J. (2009). An effect size primer: A guide for clinicians and researchers. Professional Psychology: Research and Practice, 40(5),532-538. doi: 10.1037/a0015808 [ Links ]
Gamboa, L. F., & Krüger, N. (2016). ¿Existen diferencias en América Latina en el aporte de la educación preescolar al logro educativo futuro?: PISA 2009-2012. Revista Cepal, (118),85-100. [ Links ]
George, D., & Mallery, P. (2003). SPSS for Windows step by step: A simple guide and reference. 11.0 update (4th ed.). Boston: Allyn & Bacon. [ Links ]
Halle, T., Whittaker, J. V., & Anderson, R. (2010). Quality in Early Childhood Care and Education Settings: A Compendium of Measures, Second Edition. Washington, DC: Child Trends. [ Links ]
Hamre, B. K., & Pianta, R. C. (2007). Learning opportunities in preschool and early elementary classrooms. In R. C. Pianta, M. J. Cox, & K. L. Snow (Eds.), School readiness and the transition to kindergarten in the era of accountability (p. 49-83). Baltimore: Paul H Brookes Publishing. [ Links ]
Hamre, B. K., Pianta, R. C., Downer, J. T., Decoster, J., Mashburn, A. J., Jones, S. M., ... Hamagami, A. (2013). Teaching through interactions: Testing a developmental framework of teacher effectiveness in over 4,000 classrooms. The Elementary School Journal, 113(4),461-487. doi: 10.1086/669616 [ Links ]
Harms, T., Clifford, R. M., & Cryer, D. (1998). Early Childhood Environment Rating Scale. Revised ed. New York: Teachers College Press. [ Links ]
Hoglund, W. L., Klingle, K. E., & Hosan, N. E. (2015). Classroom risks and resources: Teacher burnout, classroom quality and children's adjustment in high needs elementary schools. Journal of School Psychology, 53(5),337-357. [ Links ]
Holloway, S. D., Kagan, S., Fuller, B., Tsou, L., & Carroll, J. (2001). Assessing child-care quality with a telephone interview. Early Childhood Research Quarterly, 16(2),165-189. [ Links ]
Isley, B. J. (2000). Tamil Nadu Early Childhood Environment Rating Scale (TECERS). Madras, India: M.S. Swaminathan Research Foundation. [ Links ]
Kärrby, G. (1989). A Swedish research version of the Early Childhood Environment Rating Scale (ECERS). Göteborg, Sweden: University of Gothenburg, Department of Education. [ Links ]
Katz, M. H. (2006). Multivariable analysis (2nd ed.). Cambridge: Cambridge University Press. [ Links ]
Klatte, M., Bergström, K., & Lachmann, T. (2013). Does noise affect learning? A short review on noise effects on cognitive performance in children. Frontiers in Psychology, 4,1-6, doi: 10.3389/fpsyg.2013.00578 [ Links ]
Koo, T. K., & Li, M. Y. (2016). A guideline of selecting and reporting intraclass correlation coefficients for reliability research. Journal of Chiropractic Medicine, 15(2),155-163. doi: 10.1016/j.jcm.2016.02.012 [ Links ]
Leyva, D., Weiland, C., Barata, M., Yoshikawa, H., Snow, C., Treviño, E., & Rolla, A. (2015). Teacher-child interactions in Chile and their associations with prekindergarten outcomes. Child development, 86(3),781-799. [ Links ]
Li, K., Ying Hu, Y., Pan, Y, Qin, J, & Fan, X. (2014). Chinese Early Childhood Environment Rating Scale (trial) (CECERS): A validity study. Early Childhood Research Quarterly, 29(3),268-282. doi: 10.1016/j.ecresq.2014.02.007 [ Links ]
Mashburn, A. J., Pianta, R. C., Hamre, B. K., Downer, J. T., Barbarin, O. A., Bryant, D., ... Howes, C. (2008). Measures of classroom quality in prekindergarten and children's development of academic, language, and social skills. Child Development, 79(3),732-749. doi: 10.1111/j.1467-8624.2008.01154.x [ Links ]
McDonald, R. P. (1999). Test theory: A unified treatment. Mahwah, N. J.: L. Erlbaum Associates. [ Links ]
Milanese, S., & Grimmer, K. (2004). School furniture and the user population: An anthropometric perspective. Ergonomics, 47(4),416-426. doi: 10.1080/0014013032000157841 [ Links ]
Organización de Estados Iberoamericanos. (2008). Metas Educativas 2021. La educación que queremos para la generación de los bicentenarios (Documento para el debate. Primera versión). Madrid: Organización de Estados Iberoamericanos. [ Links ]
Oviedo, C. H., & Campos Arias, A. (2016). Aproximación al uso del coeficiente alfa de Cronbach. Revista Colombiana de Psiquiatría, 34(4),572-580. Retrieved from http://www.redalyc.org/articulo.oa?id=80634409 [ Links ]
Perlman, M., Zellman, G. L., & Le, V. (2004). Examining the psychometric properties of the early childhood environment rating scale-revised (ECERS-R). Early Childhood Research Quarterly, 19(3),398-412. doi: 10.1016/j.ecresq.2004.07.006 [ Links ]
Perlman, S., & Fantuzzo, J. W. (2013). Predicting risk of placement: A population-based study of out-of-home placement, child maltreatment, and emergency housing. Journal of the Society for Social Work and Research, 4(2),99-113. doi: 10.1016/j.childyouth.2013.02.016 [ Links ]
Pianta, R. C., La Paro, K. M., & Hamre, B. K. (2008). Classroom Assessment Scoring System (CLASS). Baltimore, MD: Brookes. [ Links ]
Pianta, R. C., La Paro, K. M., & Hamre, B. K. (2015). Classroom Assessment Scoring System Manual, Pre-K. Baltimore, MD: Paul H. Brookes Publishing Co. [ Links ]
Pianta, R., Downer, J., & Harare, B. (2016). Quality in early education classrooms: Definitions, gaps, and systems. The Future of Children, 26(2),119-137. [ Links ]
Rao, N., & Pearson, E. (2007). An evaluation of early childhood care and education programmes in Cambodia. UNICEF, Geneva. Retrieved from http://www.unicef.org/evaldatabase/files/CBD_early_childhoodcare_evaluation.pdf [ Links ]
Sabol, T. J., & Pianta, R. C. (2014). Do standard measures of preschool quality used in statewide policy predict school readiness? Education Finance and Policy, 9(2),116-164. doi: 10.1162/EDFP_a_00127 [ Links ]
Shamaki, T. A. (2015). Influence of Learning Environment on Students' Academic Achievement in Mathematics: A Case Study of Some Selected Secondary. Journal of Education and Practice, 6(34),40-44. [ Links ]
Sharma, S., Mukherjee, S., Kumar, A., & Dillon, W. R. (2005). A simulation study to investigate the use of cutoff values for assessing model fit in covariance structure models. Journal of Business Research, 58(7),935-943. [ Links ]
Singh, P., Arora, R., & Goyal, R. (2020). Impact of lighting on performance of students in Delhi schools. In A. Sharma, R. Goyal & R. Mittal (Eds.), Indoor Environmental Quality (pp. 95-108). Springer: Singapore. [ Links ]
Skjong, R., & Wentworth, B. H. (2001, June). Expert judgment and risk perception. In the eleventh international offshore and polar engineering conference. OnePetro. [ Links ]
Unicef (2012). School readiness. A conceptual framework. New York: United Nations Children's Fund. [ Links ]
United Nations General Assembly (2015). Transforming Our World: The 2030 Agenda for Sustainable Development. Resolution adopted by the General Assembly on September 25, 2015. A/RES/70/1, October, 21. [ Links ]
Vásquez-Echeverría, A. (Ed.) (2020). El Inventario de Desarrollo Infantil y la evaluación sistemática del desarrollo en contextos educativos. Teoría, creación e implementación. PsyArVix Preprints. doi: 10.31234/osf.io/xg2hj [ Links ]
Weiland, C., Ulvestad, K., Sachs, J., & Yoshikawa, H. (2013). Associations between classroom quality and children's vocabulary and executive function skills in an urban public prekindergarten program. Early Childhood Research Quarterly, 28,199-209. doi: 10.1016/j.ecresq.2012.12.002 [ Links ]
Werthamer-Larsson, L., Kellam, S., & Wheeler, L. (1991). Effect of first-grade classroom environment on shy behavior, aggressive behavior, and concentration problems. American journal of community psychology, 19(4),585-602. [ Links ]
Wyon, D. P., Wargocki, P., Toftum, J., & Clausen, G. (2010). Classroom ventilation must be improved for better health and learning. The REHVA European HVAC Journal, 47(4),35-39. [ Links ]
 Correspondence:
Alejandro Vásquez- Echeverría
Instituto de Fundamentos y Métodos, Facultad de Psicología, Udela
R. Dr. Tristán Narvaja, 1674
CP. 11200. Montevideo, Uruguay
E-mail: avasquez@psico.edu.uy
Submission: August 5th, 2020
Acceptance: March 16th, 2021
Authors' note: Nadir Díaz-Simón, Interdisciplinary Center in Cognition for Teaching and Learning, University of the Republic, Uruguay; Dinorah de León, Interdisciplinary Center in Cognition for Teaching and Learning, University of the Republic; Dahiana Fitipalde, Interdisciplinary Center in Cognition for Teaching and Learning, University of the Republic; Alejandro Vásquez-Echeverría, Interdisciplinary Center in Cognition for Teaching and Learning and Institute of Foundations and Methods in Psychology, Faculty of Psychology, University of the Republic.