<?xml version="1.0" encoding="ISO-8859-1"?><article xmlns:mml="http://www.w3.org/1998/Math/MathML" xmlns:xlink="http://www.w3.org/1999/xlink" xmlns:xsi="http://www.w3.org/2001/XMLSchema-instance">
<front>
<journal-meta>
<journal-id>0104-1282</journal-id>
<journal-title><![CDATA[Journal of Human Growth and Development]]></journal-title>
<abbrev-journal-title><![CDATA[J. Hum. Growth Dev.]]></abbrev-journal-title>
<issn>0104-1282</issn>
<publisher>
<publisher-name><![CDATA[Centro de Estudos de Crescimento e Desenvolvimento do Ser Humano]]></publisher-name>
</publisher>
</journal-meta>
<article-meta>
<article-id>S0104-12822018000300017</article-id>
<article-id pub-id-type="doi">10.7322/jhgd.152198</article-id>
<title-group>
<article-title xml:lang="en"><![CDATA[Research methodology topics: Cross-sectional studies]]></article-title>
<article-title xml:lang="pt"><![CDATA[Tópicos de metodologia de pesquisa: Estudos de corte transversal]]></article-title>
</title-group>
<contrib-group>
<contrib contrib-type="author">
<name>
<surname><![CDATA[Zangirolami-Raimundo]]></surname>
<given-names><![CDATA[Juliana]]></given-names>
</name>
<xref ref-type="aff" rid="A01"/>
</contrib>
<contrib contrib-type="author">
<name>
<surname><![CDATA[Echeimberg]]></surname>
<given-names><![CDATA[Jorge de Oliveira]]></given-names>
</name>
<xref ref-type="aff" rid="A01"/>
</contrib>
<contrib contrib-type="author">
<name>
<surname><![CDATA[Leone]]></surname>
<given-names><![CDATA[Claudio]]></given-names>
</name>
<xref ref-type="aff" rid="A01"/>
</contrib>
</contrib-group>
<aff id="A01">
<institution><![CDATA[,Centro Universitário Faculdade de Medicina do ABC Laboratório de Delineamento de Estudos e Escrita Científica ]]></institution>
<addr-line><![CDATA[Santo André SP]]></addr-line>
<country>Brazil</country>
</aff>
<pub-date pub-type="pub">
<day>00</day>
<month>00</month>
<year>2018</year>
</pub-date>
<pub-date pub-type="epub">
<day>00</day>
<month>00</month>
<year>2018</year>
</pub-date>
<volume>28</volume>
<numero>3</numero>
<fpage>356</fpage>
<lpage>360</lpage>
<copyright-statement/>
<copyright-year/>
<self-uri xlink:href="http://pepsic.bvsalud.org/scielo.php?script=sci_arttext&amp;pid=S0104-12822018000300017&amp;lng=en&amp;nrm=iso"></self-uri><self-uri xlink:href="http://pepsic.bvsalud.org/scielo.php?script=sci_abstract&amp;pid=S0104-12822018000300017&amp;lng=en&amp;nrm=iso"></self-uri><self-uri xlink:href="http://pepsic.bvsalud.org/scielo.php?script=sci_pdf&amp;pid=S0104-12822018000300017&amp;lng=en&amp;nrm=iso"></self-uri><abstract abstract-type="short" xml:lang="en"><p><![CDATA[In health the most frequent researches are done in the form of observational studies. In this type of scientific research the researchers do not interfere with the phenomena under study, only observe in a systematic and standardized manner, collecting and recording information, data or materials that spontaneously occur at a particular time of the health-disease process, or along its natural evolution, and then proceed with its description and/or analysis. In observational studies normally four types of study design are used: case series studies, cross-section studies, case-control studies and cohort studies. Thus, cross-sectional studies are very useful in descriptive studies when used in studies that are proposed to be analytical, the results must be interpreted by researchers with good experience in that specific field of knowledge, using a lot of caution and common sense.]]></p></abstract>
<abstract abstract-type="short" xml:lang="pt"><p><![CDATA[No campo da saúde as pesquisas mais frequentes são feitas na forma de estudos observacionais. Nesse tipo de investigação científica os pesquisadores não interferem nos fenômenos em estudo, apenas os observam de maneira sistemática e padronizada, coletando e registrando informações, dados ou materiais que ocorrem espontaneamente num determinado momento do processo saúde-doença, ou ao longo de sua evolução natural, para posteriormente proceder à sua descrição e/ou análise. Nos Estudos observacionais normalmente quatro tipos de desenho de estudo são passíveis de utilização: estudos de series de casos, estudos de corte transversal. estudos de caso-controle e estudos de coorte. Assim, salienta-se que os estudos de corte transversal têm sua grande utilidade em estudos descritivos ao mesmo tempo que, quando utilizados em estudos que se propõem a serem analíticos, os resultados devem ser interpretados por pesquisadores com boa experiência naquele campo específico de conhecimento, valendo-se de muita cautela e bom senso.]]></p></abstract>
<kwd-group>
<kwd lng="en"><![CDATA[observational study]]></kwd>
<kwd lng="en"><![CDATA[cross-sectional studies]]></kwd>
<kwd lng="en"><![CDATA[study design]]></kwd>
<kwd lng="en"><![CDATA[prevalence]]></kwd>
<kwd lng="pt"><![CDATA[estudo observacional]]></kwd>
<kwd lng="pt"><![CDATA[estudos transversais]]></kwd>
<kwd lng="pt"><![CDATA[desenho dos estudos]]></kwd>
<kwd lng="pt"><![CDATA[prevalência]]></kwd>
</kwd-group>
</article-meta>
</front><body><![CDATA[ <p align="right"><font size="2" face="Verdana, Arial, Helvetica, sans-serif"><b>ORIGINAL    ARTICLE</b></font></p>     <p>&nbsp;</p>     <p><font face="Verdana, Arial, Helvetica, sans-serif" size="4"><b><a name="top"></a>Research    methodology topics: Cross-sectional studies</b></font></p>     <p>&nbsp;</p>     <p>&nbsp;</p>     <p><font face="Verdana, Arial, Helvetica, sans-serif" size="2"><b>Juliana Zangirolami-Raimundo;    Jorge de Oliveira Echeimberg; Claudio Leone</b></font></p>     <p><font face="Verdana, Arial, Helvetica, sans-serif" size="2">Laborat&oacute;rio    de Delineamento de Estudos e Escrita Cient&iacute;fica. Centro Universit&aacute;rio    Faculdade de Medicina do ABC, Santo Andr&eacute;, SP, Brazil</font></p>     <p><font face="Verdana, Arial, Helvetica, sans-serif" size="2"><a href="#corresp">Correspondence</a></font></p>     <p>&nbsp;</p>     <p>&nbsp;</p> <hr noshade size="1">     ]]></body>
<body><![CDATA[<p><font face="Verdana, Arial, Helvetica, sans-serif" size="2"><b>ABSTRACT</b></font></p>     <p><font face="Verdana, Arial, Helvetica, sans-serif" size="2">In health the most    frequent researches are done in the form of observational studies. In this type    of scientific research the researchers do not interfere with the phenomena under    study, only observe in a systematic and standardized manner, collecting and    recording information, data or materials that spontaneously occur at a particular    time of the health-disease process, or along its natural evolution, and then    proceed with its description and/or analysis. In observational studies normally    four types of study design are used: case series studies, cross-section studies,    case-control studies and cohort studies. Thus, cross-sectional studies are very    useful in descriptive studies when used in studies that are proposed to be analytical,    the results must be interpreted by researchers with good experience in that    specific field of knowledge, using a lot of caution and common sense.</font></p>     <p><font face="Verdana, Arial, Helvetica, sans-serif" size="2"><b>Keywords</b>:    observational study, cross-sectional studies, study design, prevalence.</font></p> <hr noshade size="1">     <p>&nbsp;</p>     <p>&nbsp;</p>     <p><font face="Verdana, Arial, Helvetica, sans-serif" size="3"><b>INTRODUCTION</b></font></p>     <p><font face="Verdana, Arial, Helvetica, sans-serif" size="2">In health, whether    in public health or medicine, the most frequent surveys are done in the form    of observational studies. In this type of scientific investigation researchers    do not interfere in the phenomena under study, they only observe them in a systematic    and standardized way, collecting and registering information, data or materials    (such as blood, biopsies and other examples) that occur spontaneously at a given    moment in the health-disease process, or during its natural evolution, and then    proceed to its description and/or analysis<sup>1</sup>.</font></p>     <p><font face="Verdana, Arial, Helvetica, sans-serif" size="2">The aim of cross-sectional    studies is to obtain reliable data that make possible to generate, robust conclusions,    and create new hypotheses that can be investigated with new research.</font></p>     <p><font face="Verdana, Arial, Helvetica, sans-serif" size="2">Analytical studies    seek to establish relationships and associations between two or more phenomena    (called variables in the analysis process), and descriptive studies are only    about the detailed and organized description of one or more phenomena, the quality    of data required for study in addition to the systematization and standardization    of the collection methods, also the strategy adopted to obtain them, which is    called the design or, more correctly, the study design.</font></p>     <p><font face="Verdana, Arial, Helvetica, sans-serif" size="2">In observational    studies normally four types of study design are used<sup>2</sup>:</font></p>     ]]></body>
<body><![CDATA[<blockquote>        <p><font face="Verdana, Arial, Helvetica, sans-serif" size="2">- Series of cases,</font></p>       <p><font face="Verdana, Arial, Helvetica, sans-serif" size="2">- Cross-Sectional,</font></p>       <p><font face="Verdana, Arial, Helvetica, sans-serif" size="2">- Case-control      and,</font></p>       <p><font face="Verdana, Arial, Helvetica, sans-serif" size="2">- Cohort Studies.</font></p> </blockquote>     <p><font face="Verdana, Arial, Helvetica, sans-serif" size="2">These designs,    which has been used in early research, and also perhaps the most frequently    used is the cross-sectional study.</font></p>     <p><font face="Verdana, Arial, Helvetica, sans-serif" size="2">The main characteristic    of cross-sectional studies is that the observation of variables, whether they    are cases, individuals, or other types of data, is performed in a single moment    (the same), when the researcher records a "photograph" of the facts (variables)    of interest and not the "movie" of its evolution<sup>1,2</sup>. Also called    transversal, sectional, or prevalence, the cross-sectional study has the advantages    of allowing the direct observation by the researcher of the phenomena to be    investigated, of performing the information collection in a short time (in public    health is very frequent the use of collective effort), without the need for    follow-up of the participants, and to produce faster results, therefore, at    a lower cost than the other designs<sup>1,3</sup>.</font></p>     <p><font face="Verdana, Arial, Helvetica, sans-serif" size="2">These characteristics    make cross-sectional studies particularly useful for studying the prevalence<sup><a name="top_fna"></a><a href="#back_fna">a</a></sup>    of a particular phenomenon, whether it is assumed to be the cause or the consequence,    or both, in a defined population. These studies, even if purely observational    and descriptive, are very useful in the field of Public Health. Of course this    type of design is appropriate for problems with prolonged or chronic evolution    and is not generally suitable for the study of acute situations, when the interest    is the incidence<sup><a name="top_fnb"></a><a href="#back_fnb">b</a></sup> of    new events.</font></p>     <p><font face="Verdana, Arial, Helvetica, sans-serif" size="2">Beyond the pure    description of phenomena, cross-sectional design is also useful in studies that    investigate causal and effect relationships, which seek, at least preliminarily,    to analyze the relationships between risk factors, determinants and what are    supposed to be their consequences or effects (outcomes), such as diseases, sequelae    and damages or even advantages (protection) of any kind.</font></p>     <p><font face="Verdana, Arial, Helvetica, sans-serif" size="2">Examples of cross-sectional    studies, probably one of the most popular, are population censuses (demographic),    systematically carried out by many countries in order to identify characteristics    of their populations at a given time, analyze their evolution over time, and    to establish some relationships between these features that deserve to be analyzed<sup>3,4</sup>.</font></p>     ]]></body>
<body><![CDATA[<p><font face="Verdana, Arial, Helvetica, sans-serif" size="2">A census involves    a lot of time and resources because it covers the collection of data from the    entire population (the universe) that is to be evaluated and, therefore, makes    its routine use practically unfeasible in most scientific research.</font></p>     <p><font face="Verdana, Arial, Helvetica, sans-serif" size="2">As a consequence,    to reduce the cost and time of conducting the survey it is often necessary to    use samples (from the universe) that, based on statistical analyzes, produce    results and estimates capable of producing generalizable conclusions, even with    some limitations<sup>4</sup>.</font></p>     <p><font face="Verdana, Arial, Helvetica, sans-serif" size="2">For this to be    possible it is necessary that the sample used in the research be as representative    as possible the study universe, be accurate<sup><a name="top_fnc"></a><a href="#back_fnc">c</a></sup>,    and that its size (n) is sufficient to guarantee results with the necessary    precision<sup><a name="top_fnd"></a><a href="#back_fnd">d</a></sup>. Accuracy    and precision are not equivalent, because depending on the sample type and its    size (n), it can be accurate but very precise or imprecise, but little accurate.    The ideal condition is to obtain from the sample an accurate result that, at    the same time, is also precision<sup>3</sup>.</font></p>     <p><font face="Verdana, Arial, Helvetica, sans-serif" size="2">Unfortunately,    in many research situations it is impossible to obtain a representative sample,    so when this is the case, one uses the best sample that can be obtained, always    seeking to have a minimum of representativeness. This type of sample is named    the convenience sample.</font></p>     <p><font face="Verdana, Arial, Helvetica, sans-serif" size="2">In those circumstances,    despite the fact that the use of a convenience sample does not completely prevents    the conduct of a study, it should be in mind that this situation imposes limitations    on the interpretation of results, particularly with regard to the generalization    of its findings, because it is practically impossible to assess its accuracy.</font></p>     <p><font face="Verdana, Arial, Helvetica, sans-serif" size="2">The study populations    (or universes) can either be a population of a city, a state or a country as    a whole, as the population of certain subgroups, for example the female or child    population, or the population with a certain health problem, such as the population    of diabetics or hypertensives, or with exposure to risks such as smokers, sedentary    and so on. Researchers must define, from their research hypothesis, which population    is to be studied, that is, the one from which a sample will be selected. Whenever    it is not possible to obtain a representative sample, the researcher will be    analyzing data of what is called the hypothetical population<sup><a name="top_fne"></a><a href="#back_fne">e</a></sup>.</font></p>     <p><font face="Verdana, Arial, Helvetica, sans-serif" size="2">When it is desired    to go beyond purely descriptive aspects, seeking to identify relationships that    may exist between study variables, such as the relationship between risk factors    and their possible consequences, such as diseases, damages, sequelae, etc.,    the cross-sectional is considered analytical, establishing comparisons between    subjects of the sample exposed to a certain risk factor and those not exposed,    whether or not they have a particular disease. Conversely, the study also allows    comparisons between patients and non-patients, who were exposed to an alleged    risk factor<sup>5</sup>.</font></p>     <p><font face="Verdana, Arial, Helvetica, sans-serif" size="2">Thus, for this    analysis it is possible to divide the subjects of the sample, according to the    risk factor and outcome (disease), into four distinct groups:</font></p>     <blockquote>        <p><font face="Verdana, Arial, Helvetica, sans-serif" size="2">- those who have      the risk factor and have the outcome;</font></p>       ]]></body>
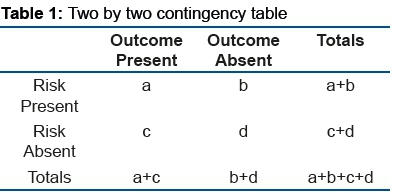
<body><![CDATA[<p><font face="Verdana, Arial, Helvetica, sans-serif" size="2">- those who have      the risk factor and do not have the outcome;</font></p>       <p><font face="Verdana, Arial, Helvetica, sans-serif" size="2">- those who do      not have the risk factor and have the outcome and;</font></p>       <p><font face="Verdana, Arial, Helvetica, sans-serif" size="2">- those who do      not have the risk factor and do not have the outcome.</font></p> </blockquote>     <p><font face="Verdana, Arial, Helvetica, sans-serif" size="2">In addition, it    is possible to divide them into four subgroups based on the disease:</font></p>     <blockquote>        <p><font face="Verdana, Arial, Helvetica, sans-serif" size="2">- those who have      the outcome and have the risk factor;</font></p>       <p><font face="Verdana, Arial, Helvetica, sans-serif" size="2">- those who have      the outcome and do not have the risk factor;</font></p>       <p><font face="Verdana, Arial, Helvetica, sans-serif" size="2">- those who do      not have the outcome and have the risk factor;</font></p>       <p><font face="Verdana, Arial, Helvetica, sans-serif" size="2">- those that      do not have the outcome and do not have the risk factor.</font></p> </blockquote>     <p><font face="Verdana, Arial, Helvetica, sans-serif" size="2">The distribution    of the research subjects is used to make this evaluation, according to the absolute    and relative frequency with which they are classified in relation to the two    characteristics (risk factor and outcome), in tables named of contingency (<a href="#t1">Table    1</a>), or association, which are always structured this way:</font></p>     ]]></body>
<body><![CDATA[<p><a name="t1"></a></p>     <p>&nbsp;</p>     <p align="center"><img src="/img/revistas/rbcdh/v28n3/17t1.jpg"></p>     <p>&nbsp;</p>     <p><font face="Verdana, Arial, Helvetica, sans-serif" size="2">In these tables,    the data of the boxes (a, b, c and d) are compared with those expected from    a distribution that is totally determined by chance. The less divergent the    values obtained in the research under analysis from those expected by chance,    the lower the probability that there is an association between risk and disease.    On the contrary, the greater the divergence of the observed than the expected    by chance, the greater the probability that there is an association between    the risk factor and the outcome.</font></p>     <p><font face="Verdana, Arial, Helvetica, sans-serif" size="2">The Chi-square    methods and the Fisher's exact test are used in this association analysis because    they are based on the diference between the expected values and those observed    in the research to define their statistical significance<sup>6</sup>.</font></p>     <p><font face="Verdana, Arial, Helvetica, sans-serif" size="2">In this sense it    is important to remember that a statistically significant association simply    means that there is a probability of being associated, not absolute certainty.    In addition, the presence of this probable association does not necessarily    imply a relation of determination, that is, of the cause/effect type. An example    of this may be the finding, based on a sample of adults, of a statistically    significant association between overweight and hypertension. Can obesity lead    to hypertension? It may seem true, however there may be another cause, or risk    factor, that may be the cause of both: anxiety. An anxious individual may manifest    hypertension and become obese, making these two outcomes appear to be one cause    and the other the outcome. If the sample is not raised also considering the    presence or not of anxiety in the patients , at leastthere is a risck of concluding    that hipertension is a case of obesity.</font></p>     <p><font face="Verdana, Arial, Helvetica, sans-serif" size="2">In addition to    statistical associations, this type of analysis also allows us to calculate    the Prevalence Ratio (PR), defining whether and in which group it is higher.    Assuming that it was the same, the result of the division (ratio) of the prevalence    of the risk group by that of the risk-free group would be "1". Any significant    result other than "1" may indicate that there is an association. If the association    is of risk the quotient will be greater than "1", or if it is a protection factor    it will be less than "1". Because it is an analysis from a sample, it is difficult    to obtain an exact value of "1", which is why the confidence interval (CI) of    the obtained value is also estimated. When the value "1" does not fall within    the limits of the CI, it means that there is a difference (statistic) between    the two groups and, when the value "1" is part of the possible results described    by the CI, it is admitted that there is no significant difference between the    two groups, exposed and not exposed to the possible risk factor<sup>5,6</sup>.</font></p>     <p><font face="Verdana, Arial, Helvetica, sans-serif" size="2">In this model it    is also possible to analyze from the outcome, calculating the ratio (quotient)    between the proportions of individuals who have exposure to the risk factor    in the group with the outcome, the disease, for example, and the group that    does not have the outcome. The calculated result is called Odds Ratio (OR),    an estimator that is used as an approximation to Relative Risk (RR). When the    proportions of the two groups are equal, the result of the OR will be "1", indicating    that there is no association between the disease and the exposure to the factor    that was supposed to be at risk. The interpretation of other OR values follows    exactly the same logic described for PR, now based on the calculated CI for    OR.</font></p>     <p><font face="Verdana, Arial, Helvetica, sans-serif" size="2">The cross-sectional    design can also be used for multi-variable analyzes, such as binary logistic    regression, in order to simultaneously calculate the ORs of several risk factors    and their statistical significance, ranking them by order of influence on the    outcome under analysis. Moreover, in this analysis it is also possible to calculate    the significance and explanatory capacity of the model generated by the set    of factors that evidenced statistically significant ORs in the binary logistic    regression analysis.</font></p>     ]]></body>
<body><![CDATA[<p><font face="Verdana, Arial, Helvetica, sans-serif" size="2">When the phenomena    to be studied (risk and outcome) are quantitative (numerical) variables, it    is also possible to analyze their relations by means of comparisons of means    or medians using parametric statistical tests (Student's T, Fisher's Exact)    or non-parametric (Mann- Whitney). In these conditions it is also possible to    calculate correlation coefficients (Pearson or Spearman) and, possibly, linear    regression models and even to evaluate sensitivity, specificity and predictive    values (+ or -) using ROC Curves (Receiver Operating Characteristics Curves).</font></p>     <p><font face="Verdana, Arial, Helvetica, sans-serif" size="2">Despite the potential    advantages: faster realization, lower cost, lower losses and the possibility    of direct observation of phenomena to be analyzed (avoiding the bias due to    memory leaks or inadequate recording or absent stunted information), and enable    a wide variety of alternative methods that can be used to statistically analyze    data, cross- sectional design (such as the Del Ciampo <i>et al</i><sup>7</sup>,    Lucena <i>et al</i><sup>8</sup> study) presents some important drawbacks that    make it difficult to interpret association results.</font></p>     <p><font face="Verdana, Arial, Helvetica, sans-serif" size="2">The disadvantages    are fundamentally due to the fact of collecting information about risk factors    and outcomes are collected in a single moment (the same), which makes it difficult    to analyze associations to assess possible cause / effect relationships.</font></p>     <p><font face="Verdana, Arial, Helvetica, sans-serif" size="2">The coexistence    of the possibilities of association between risk and outcome, previously described,    at the same time (that of the research) nullify the temporal relation that must    exist between cause and effect, since it is a <i>sine qua non </i>condition    that the cause always precedes the outcome, for this to occur. This can result    in the phenomenon of reverse causality. Supposing a sample of the population    to observe an association between obesity and joint pain in the lower limbs,    it would be valid to suppose that the overload of the weight on the joints would    be causing lesions, even if small ones, that would cause the pains. However,    it would not be wrong to hypothesize also that chronic joint problems with major    pain could condition a reduction in daily activities and a sedentary lifestyle    that could lead to obesity.</font></p>     <p><font face="Verdana, Arial, Helvetica, sans-serif" size="2">Another disadvantage    also arising from the design is the almost impossibility of applying it when    it is desired to approach situations in which the outcome or the risk factor    or both are rare in the population, since it would require a very large sample    to obtain the number of carriers of the disease required to perform the association    analyzes, which at least would increase the time and also the costs for its    realization<sup>5</sup>.</font></p>     <p><font face="Verdana, Arial, Helvetica, sans-serif" size="2">As the whole, despite    the difficulties, remain as final considerations that the cross-sectional, design    can be very useful to assess the frequency of risk behaviors and / or exposure    to risks, necessary for the development of public health policies, can also    serve as a basis for calculating sample size in the planning of future analytical    research with more robust designs to assess cause and effect hypotheses, such    as cohort or case-control<sup>1</sup>.</font></p>     <p>&nbsp;</p>     <p><font face="Verdana, Arial, Helvetica, sans-serif" size="3"><b>FINAL CONSIDERATION</b></font></p>     <p><font face="Verdana, Arial, Helvetica, sans-serif" size="2">Cross-sectional    studies have their great use in descriptive studies, while used in studies that    are proposed to be analytical, the results must be interpreted by researchers    with good experience in that specific field of knowledge, using a lot of caution    and common sense.</font></p>     <p>&nbsp;</p>     ]]></body>
<body><![CDATA[<p><font face="Verdana, Arial, Helvetica, sans-serif" size="3"><b>REFERENCES</b></font></p>     <!-- ref --><p><font face="Verdana, Arial, Helvetica, sans-serif" size="2">1.Kramer M.S. Clinical    Epidemiology and Biostatistics. Berlin: Springer-Verlag, 1988.    &nbsp;&nbsp;&nbsp;&nbsp;&nbsp;&nbsp;&nbsp;&nbsp;[&#160;<a href="javascript:void(0);" onclick="javascript: window.open('/scielo.php?script=sci_nlinks&ref=2540655&pid=S0104-1282201800030001700001&lng=','','width=640,height=500,resizable=yes,scrollbars=1,menubar=yes,');">Links</a>&#160;]<!-- end-ref --></font></p>     <!-- ref --><p><font face="Verdana, Arial, Helvetica, sans-serif" size="2">2. Katz M.H. Study    Design and Statistical Analysis. New York: Cambridge University Press, 2006.    &nbsp;&nbsp;&nbsp;&nbsp;&nbsp;&nbsp;&nbsp;&nbsp;[&#160;<a href="javascript:void(0);" onclick="javascript: window.open('/scielo.php?script=sci_nlinks&ref=2540657&pid=S0104-1282201800030001700002&lng=','','width=640,height=500,resizable=yes,scrollbars=1,menubar=yes,');">Links</a>&#160;]<!-- end-ref --></font></p>     <!-- ref --><p><font face="Verdana, Arial, Helvetica, sans-serif" size="2">3.Hennekens C.H.    and Buring J.E. Epidemiology in Medicine. Boston: Little, Brown and Company,    1987.    &nbsp;&nbsp;&nbsp;&nbsp;&nbsp;&nbsp;&nbsp;&nbsp;[&#160;<a href="javascript:void(0);" onclick="javascript: window.open('/scielo.php?script=sci_nlinks&ref=2540659&pid=S0104-1282201800030001700003&lng=','','width=640,height=500,resizable=yes,scrollbars=1,menubar=yes,');">Links</a>&#160;]<!-- end-ref --></font></p>     <!-- ref --><p><font face="Verdana, Arial, Helvetica, sans-serif" size="2">4.Porta M. A Dictionary    of Epidemiology 5th ed. New York: Oxford University Press, 2008.    &nbsp;&nbsp;&nbsp;&nbsp;&nbsp;&nbsp;&nbsp;&nbsp;[&#160;<a href="javascript:void(0);" onclick="javascript: window.open('/scielo.php?script=sci_nlinks&ref=2540661&pid=S0104-1282201800030001700004&lng=','','width=640,height=500,resizable=yes,scrollbars=1,menubar=yes,');">Links</a>&#160;]<!-- end-ref --></font></p>     <!-- ref --><p><font face="Verdana, Arial, Helvetica, sans-serif" size="2">5.Friis R.H. and    Sellers T.A. Epidemiology for Public Health Practice 4th ed. Sudbury Massachussetts,    2009.    &nbsp;&nbsp;&nbsp;&nbsp;&nbsp;&nbsp;&nbsp;&nbsp;[&#160;<a href="javascript:void(0);" onclick="javascript: window.open('/scielo.php?script=sci_nlinks&ref=2540663&pid=S0104-1282201800030001700005&lng=','','width=640,height=500,resizable=yes,scrollbars=1,menubar=yes,');">Links</a>&#160;]<!-- end-ref --></font></p>     <!-- ref --><p><font face="Verdana, Arial, Helvetica, sans-serif" size="2">6.Kirkwood B.R.    and Sterne A.C. Essential Medical Statistics 2nd ed. Malden, Massachusetts,    2006.    &nbsp;&nbsp;&nbsp;&nbsp;&nbsp;&nbsp;&nbsp;&nbsp;[&#160;<a href="javascript:void(0);" onclick="javascript: window.open('/scielo.php?script=sci_nlinks&ref=2540665&pid=S0104-1282201800030001700006&lng=','','width=640,height=500,resizable=yes,scrollbars=1,menubar=yes,');">Links</a>&#160;]<!-- end-ref --></font></p>     <!-- ref --><p><font face="Verdana, Arial, Helvetica, sans-serif" size="2">7.Del Ciampo LA,    Louro AL, Del Ciampo IRL, Ferraz IS. Characteristics of sleep habitsamong adolescents    living in the city of Ribeir&atilde;o Preto (SP). J Hum Growth Dev. 2017; 27(3):    307-314. DOI: <a href="http://dx.doi.org/10.7322/jhgd.107097" target="_blank">http://dx.doi.org/10.7322/jhgd.107097</a></font>&nbsp;&nbsp;&nbsp;&nbsp;&nbsp;&nbsp;&nbsp;&nbsp;[&#160;<a href="javascript:void(0);" onclick="javascript: window.open('/scielo.php?script=sci_nlinks&ref=2540667&pid=S0104-1282201800030001700007&lng=','','width=640,height=500,resizable=yes,scrollbars=1,menubar=yes,');">Links</a>&#160;]<!-- end-ref --><!-- ref --><p><font face="Verdana, Arial, Helvetica, sans-serif" size="2">8.Lucena KDT, Deninger    LSC, Coelho HFC, Monteiro ACC, Vianna RPT, Nascimento JA. Analysis of the cycle    of domestic violence against women. J Hum Growth Dev. 2016; 26(1): 139-146.    <a href="http://dx.doi.org/10.7322/jhgd.119238" target="_blank">http://dx.doi.org/10.7322/jhgd.119238</a></font>&nbsp;&nbsp;&nbsp;&nbsp;&nbsp;&nbsp;&nbsp;&nbsp;[&#160;<a href="javascript:void(0);" onclick="javascript: window.open('/scielo.php?script=sci_nlinks&ref=2540668&pid=S0104-1282201800030001700008&lng=','','width=640,height=500,resizable=yes,scrollbars=1,menubar=yes,');">Links</a>&#160;]<!-- end-ref --><p>&nbsp;</p>     <p>&nbsp;</p>     <p><font face="Verdana, Arial, Helvetica, sans-serif" size="2"><a href="#top" name="corresp"><img src="/img/revistas/rbcdh/v28n3/seta.jpg" border="0"></a>    <b>Correspondence</b>:    <br>   <a href="mailto:escritacientifica@fmabc.br">escritacientifica@fmabc.br</a></font></p>     <p><font face="Verdana, Arial, Helvetica, sans-serif" size="2">Manuscript received:    June 2018    ]]></body>
<body><![CDATA[<br>   Manuscript accepted: October 2018    <br>   Version of record online: November 2018</font></p>     <p>&nbsp;</p>     <p>&nbsp;</p>     <p><font face="Verdana, Arial, Helvetica, sans-serif" size="2"><a name="back_fna"></a><a href="#top_fna">a</a>    Prevalence: is the proportion of a given population that at the moment of the    study presents a disease, risk factor and/or other type of problem.    <br>   <a name="back_fnb"></a><a href="#top_fnb">b</a> Incidence: corresponds to the    proportion of new cases (disease, risk or any problem) that occur in the study    population over a defined period of time and not just in a single moment.    <br>   <a name="back_fnc"></a><a href="#top_fnc">c</a> Accurate: is the result obtained    from a sample, provides a very close value to the one to be estimated in a given    population. The accuracy does not depend on a greater or lesser precision of    the estimated value, but on the sample representativeness and reliability of    the data collected.    <br>   <a name="back_fne"></a><a href="#top_fne">e</a> Hypothetical population: the    one to which the study's conclusions apply, in other words, if there are populations    similar to those in the sample, the conclusions will be valid for them.    <br>   <a name="back_fnd"></a><a href="#top_fnd">d</a> Precision correspond to the    variation that a result would have if it were calculated from several samples    (from the same population) selected in the same way.The confidence interval    (CI) is the one way to represent its precision. The smaller the difference between    the extremes of the CI, the greater the precision of the result. Precision does    not have to do with the representativeness of the sample, but it depends very    much on the size of the sample, that is, on the number of subjects that compose    it.</font></p>      ]]></body>
<back>
<ref-list>
<ref id="B1">
<label>1</label><nlm-citation citation-type="book">
<person-group person-group-type="author">
<name>
<surname><![CDATA[Kramer]]></surname>
<given-names><![CDATA[M.S]]></given-names>
</name>
</person-group>
<source><![CDATA[Clinical Epidemiology and Biostatistics]]></source>
<year>1988</year>
<publisher-loc><![CDATA[Berlin ]]></publisher-loc>
<publisher-name><![CDATA[Springer-Verlag]]></publisher-name>
</nlm-citation>
</ref>
<ref id="B2">
<label>2</label><nlm-citation citation-type="book">
<person-group person-group-type="author">
<name>
<surname><![CDATA[Katz]]></surname>
<given-names><![CDATA[M.H]]></given-names>
</name>
</person-group>
<source><![CDATA[Study Design and Statistical Analysis]]></source>
<year>2006</year>
<publisher-loc><![CDATA[New York ]]></publisher-loc>
<publisher-name><![CDATA[Cambridge University Press]]></publisher-name>
</nlm-citation>
</ref>
<ref id="B3">
<label>3</label><nlm-citation citation-type="book">
<person-group person-group-type="author">
<name>
<surname><![CDATA[Hennekens]]></surname>
<given-names><![CDATA[C.H.]]></given-names>
</name>
<name>
<surname><![CDATA[Buring]]></surname>
<given-names><![CDATA[J.E.]]></given-names>
</name>
</person-group>
<source><![CDATA[Epidemiology in Medicine]]></source>
<year>1987</year>
<publisher-loc><![CDATA[Boston ]]></publisher-loc>
<publisher-name><![CDATA[Little, Brown and Company]]></publisher-name>
</nlm-citation>
</ref>
<ref id="B4">
<label>4</label><nlm-citation citation-type="book">
<person-group person-group-type="author">
<name>
<surname><![CDATA[Porta]]></surname>
<given-names><![CDATA[M]]></given-names>
</name>
</person-group>
<source><![CDATA[A Dictionary of Epidemiology]]></source>
<year>2008</year>
<edition>5</edition>
<publisher-loc><![CDATA[New York ]]></publisher-loc>
<publisher-name><![CDATA[Oxford University Press]]></publisher-name>
</nlm-citation>
</ref>
<ref id="B5">
<label>5</label><nlm-citation citation-type="">
<person-group person-group-type="author">
<name>
<surname><![CDATA[Friis]]></surname>
<given-names><![CDATA[R.H.]]></given-names>
</name>
<name>
<surname><![CDATA[Sellers]]></surname>
<given-names><![CDATA[T.A.]]></given-names>
</name>
</person-group>
<source><![CDATA[Epidemiology for Public Health Practice]]></source>
<year>2009</year>
<edition>4</edition>
<publisher-loc><![CDATA[Sudbury^eMassachussetts Massachussetts]]></publisher-loc>
</nlm-citation>
</ref>
<ref id="B6">
<label>6</label><nlm-citation citation-type="">
<person-group person-group-type="author">
<name>
<surname><![CDATA[Kirkwood]]></surname>
<given-names><![CDATA[B.R.]]></given-names>
</name>
<name>
<surname><![CDATA[Sterne]]></surname>
<given-names><![CDATA[A.C.]]></given-names>
</name>
</person-group>
<source><![CDATA[Essential Medical Statistics]]></source>
<year>2006</year>
<edition>2</edition>
<publisher-loc><![CDATA[Malden^eMassachusetts Massachusetts]]></publisher-loc>
</nlm-citation>
</ref>
<ref id="B7">
<label>7</label><nlm-citation citation-type="journal">
<person-group person-group-type="author">
<name>
<surname><![CDATA[Del Ciampo]]></surname>
<given-names><![CDATA[LA]]></given-names>
</name>
<name>
<surname><![CDATA[Louro]]></surname>
<given-names><![CDATA[AL]]></given-names>
</name>
<name>
<surname><![CDATA[Del Ciampo]]></surname>
<given-names><![CDATA[IRL]]></given-names>
</name>
<name>
<surname><![CDATA[Ferraz]]></surname>
<given-names><![CDATA[IS]]></given-names>
</name>
</person-group>
<article-title xml:lang="en"><![CDATA[Characteristics of sleep habitsamong adolescents living in the city of Ribeirão Preto (SP)]]></article-title>
<source><![CDATA[J Hum Growth Dev.]]></source>
<year>2017</year>
<volume>27</volume>
<numero>3</numero>
<issue>3</issue>
<page-range>307-314</page-range></nlm-citation>
</ref>
<ref id="B8">
<label>8</label><nlm-citation citation-type="journal">
<person-group person-group-type="author">
<name>
<surname><![CDATA[Lucena]]></surname>
<given-names><![CDATA[KDT]]></given-names>
</name>
<name>
<surname><![CDATA[Deninger]]></surname>
<given-names><![CDATA[LSC]]></given-names>
</name>
<name>
<surname><![CDATA[Coelho]]></surname>
<given-names><![CDATA[HFC]]></given-names>
</name>
<name>
<surname><![CDATA[Monteiro]]></surname>
<given-names><![CDATA[ACC]]></given-names>
</name>
<name>
<surname><![CDATA[Vianna]]></surname>
<given-names><![CDATA[RPT]]></given-names>
</name>
<name>
<surname><![CDATA[Nascimento]]></surname>
<given-names><![CDATA[JA]]></given-names>
</name>
</person-group>
<article-title xml:lang="en"><![CDATA[Analysis of the cycle of domestic violence against women]]></article-title>
<source><![CDATA[J Hum Growth Dev]]></source>
<year>2016</year>
<volume>26</volume>
<numero>1</numero>
<issue>1</issue>
<page-range>139-146</page-range></nlm-citation>
</ref>
</ref-list>
</back>
</article>
