


 texto em
  Inglês (pdf)
 Artigo em XML
 Referências do artigo

 Permalink
INTRODUCTION
COVID-19, caused by the SARS-CoV-2 virus, has emerged as a significant threat to global health1. Since its initial identification in Wuhan, China, in December 2019, COVID-19 has spread worldwide, resulting in a devastating impact on public health and the economy1. As of March 29, 2023, there have been over 761 million confirmed cases and more than 6.8 million deaths worldwide, with Europe alone accounting for over 2.2 million deaths2.
On January 7, 2020, Chinese authorities confirmed the emergence of a new disease caused by a virus belonging to the Coronaviridae family. The SARS-CoV-2 strain was classified as a betacoronavirus3. The novel coronavirus showed similarities to other coronaviruses in its family, with severity ranging from asymptomatic cases to serious cases developing Severe Acute Respiratory Syndrome (SARS).
The disease spread exponentially, leading the World Health Organization (WHO) to declare a global emergency on January 30, 2020, and later, on March 11 of the same year, declaring it a pandemic3. The unprecedented spread of the disease put the world on high alert, causing significant impacts on both, the healthcare system and the global economy.
Researchers, scientists, and medical communities mobilized to understand the virus’s origin, mode of transmission and unique characteristics, particularly its rapid spread and high contagion capacity, raising concerns about healthcare system overload4.
The primary mode of transmission includes direct contact with respiratory droplets from infected individuals through coughing and/or sneezing. Additionally, studies suggest the potential airborne transmission of the virus through aerosols, although there is no experimental evidence proving long-range aerosol transmission in COVID-19 infection5.
The first COVID-19 case in Brazil was confirmed on February 26, 2020, involving a 61-year-old man who had come from Italy. Just 48 hours after the first case confirmation in the country, a team of Brazilian researchers announced the complete sequencing of the novel coronavirus. The pandemic was declared on March 11, 2020, and the first COVID-19 death in Brazil occurred on March 12, 2020. As of March 17, 2023, the Ministry of Health reported 699,634 deaths from COVID-19 in Brazil, with a case fatality rate of 1.9%6.
Clinical outcomes of COVID-19 vary among individuals and are influenced by factors such as age, gender, ethnicity and underlying health conditions7. Symptom presentation ranges from asymptomatic cases to severe, life-threatening complications7. Older adults, individuals with pre-existing health problems and those with weakened immune system are more vulnerable to severe infections and associated mortality7,8.
Brazil presents a complex epidemiological scenario with significant regional differences due to its vast continental dimensions, climate variations, vegetation, cultural diversity, and socioeconomic factors. The Ministry of Health urged all states and municipalities to adopt non-pharmacological interventions promoting social distancing and avoiding gatherings, as recommended by the WHO9.
In the southern region of Brazil, COVID-19 initially appeared in the state capitals, spreading through major highways, with a higher disease projection in Santa Catarina and a lower one in Rio Grande do Sul10.
Santa Catarina, bordering the states of Paraná and Rio Grande do Sul, has a subtropical climate, occasional snowfall in winter, especially in mountainous regions, and a high Human Development Index (HDI). Its economy is dominated by the agro-industrial, mechanical, textile, and tourism sectors, forming a robust and dynamic economy11.
In Santa Catarina, the first two COVID-19 cases were confirmed on March 12, 2020, both in Florianópolis, with patients from New York and the Netherlands. The first death was confirmed on March 26, 2020, in São José, Greater Florianópolis12. The surge in cases led to the approval of new decrees establishing stricter measures to curb the virus’s spread13.
Paraná, one of the most developed states in Brazil, has a culture influenced by immigrants of strong European descent. It has a subtropical climate with rainfall and mild temperatures throughout the year. The state’s economy is based on agriculture and industry (food, automotive, and electronics), as well as a thriving tourism sector. Also, Paraná boasts suitable logistical infrastructure, including a vast network of railways, maritime and river ports, and highways, along with the Itaipu Dam11.
In Paraná, the first six COVID-19 cases were reported on 12 March 2020, five in Curitiba and one in Cianorte, in the northwest of the state, with the first deaths occurring on 25 March 2020. According to the Health Department’s report, the year with the highest number of cases in Paraná was 2021, totaling 32,234 deaths. This period was known as the ‘second wave’ of the pandemic, during which the delta strain predominated worldwide14,15.
The impact of the COVID-19 pandemic on Brazil’s socio-economic and health systems, as well as the significant regional disparities and the high number of cases and deaths in Santa Catarina and Paraná, this study aimed to analyze the mortality, incidence, and fatality of COVID-19 in these states.
METHODS
Study Design and Location
This study adopts an ecological and time-series design, following the protocol by Abreu, Emulsharaf, and Siqueira16. Official data on COVID-19 cases and deaths from the states of Santa Catarina and Paraná were analyzed.
Public data are available on the website https://www.saude.pr.gov.br/Pagina/Coronavirus-COVID-19 for the state of Paraná, and for Santa Catarina, information was extracted from https://www.saude.pr.gov.br/Pagina/Coronavirus-COVID-19 and https://dados.sc.gov.br/dataset/covid-19-dados-anonimizados-de-casos-confirmados/resource/76d6dfe8-7fe9-45c1-95f4-cab971803d49 respectivaly.
Table 1 : Sociodemographic characteristics of the State of Santa Catarina and Paraná, 2023
| Sociodemographic characteristics | Santa Catarina | Paraná |
|---|---|---|
| Region * | South | South |
| Number of municipalities * | 295 | 284 |
| State Capital * | Florianópolis | Curitiba |
| Territorial extension * (2022) | 95,730.690 km2 | 199,298,981 km2 |
| Estimated Population (2021) | 7,338,473 people | 11,597,484 people |
| Demographic density * (last census, 2010) | 65.29 inhabitants/km2 | 52.40 inhabitants/km2 |
| Urban household situation (2010)* | 5,247,913 people | 8,912,692 people |
| Rural household situation (2010)* | 1,000,523 people | 1,531,834 people |
| Monthly household income per capita * | R$ 2,018 | R$ 1,846 |
| Human Development Index (HDI) (last census, 2010) * | 0.774 | 0.749 |
| Number of Basic Health Units of the Unified Health System (SUS) (2009) * | 2,856 establishments | 4,091 establishments |
| outpatient SUS* | 2,136 establishments | 3,307 establishments |
| SUS dialysis* | 42 establishments | 69 establishments |
| SUS emergency* | 254 establishments | 446 establishments |
| SUS hospitalization* | 194 establishments | 411 establishments |
| SUS ICU* | 42 establishments | 76 establishments |
| Number of beds for hospitalization in healthcare establishments (2009)* | 15,557 beds | 26,793 beds |
| Public* | 3,509 beds | 6,512 beds |
| Private* | 12,048 beds | 20,281 beds |
Source: *Brazilian Institute of Geography and Statistics11.
Sampling and Eligibility Criteria
All cases and deaths from COVID-19 from 2020 to 2022 were included. Occurrences were confirmed through laboratory, clinical, and clinical-epidemiological diagnosis. COVID-19 was categorized according to the International Classification of Diseases, 10th edition (ICD-10), as “U07.1 COVID-19, virus identified” or “U07.2 COVID-19, virus not identified”17.
Deaths and cases were classified by the date of symptom onset, and cases without information on notification or death date were excluded from the study. We organized and tabulated this data in Excel, subsequently, a second author verified the extracted data, and a third investigator conducted a final check in case of discrepancies. Finally, the information was recorded in an Excel spreadsheet (Microsoft Corporation, Redmond, WA, USA).
Statistical Analysis
The number of COVID-19 cases and deaths was described in terms of absolute frequency (n) and relative frequency (%). For each state, the incidence rate (number of cases per 100,000 inhabitants), mortality rate (number of deaths per 100,000 inhabitants), and case fatality rate (%) were calculated as described below:
For population, the population projection for each state from 2000-2030 was considered. For Santa Catarina, the estimated population for the years 2020 (8,628,901 inhabitants), 2021 (8,710,364 inhabitants) and 2022 (8,789,130 inhabitants) was used. In the case of Paraná, the estimated population for the years 2020 (11,516,840 inhabitants), 2021 (11,597,484 inhabitants), and 2022 (11,443,208 inhabitants) was utilized11.
To analyze the trend, the protocol of Antunes and Cardoso18was employed. Time series were constructed using the Prais-Winsten regression model19.
Time series are widely used in public health and epidemiology to analyze and predict the incidence of diseases over time, such as in the case of COVID-19, identifying patterns and seasonal trends of the disease.
The identification of seasonal trends of COVID-19 in a time series analysis allows for an assessment of the comprehensive view of the disease waves over the analyzed period. Moreover, this epidemiological measure enables real-time monitoring of COVID-19 outbreaks, contribute to immediate action by health authorities to implement effective control measures. Another application of time series is to assess the effectiveness of preventive interventions (such as mask-wearing, vaccination, booster doses, and social distancing measures).
Time series have allowed researchers and healthcare professionals to monitor and respond to disease outbreaks, predict disease incidence, identify seasonal trends, and assess the effectiveness of disease prevention and control interventions, as in the case of the COVID-19 pandemic.
Additionally, by using the Prais-Winsten regression model, first-order autocorrelation was allowed to analyze the values of time series and facilitate the assessment and classification of incidence, mortality and case fatality as increasing, decreasing, or stationary19. Trends were classified as stationary when the p-value was not significant (p > 0.05)18.
The probability values (p) and daily percent change (DPC), considering a significance level of 95%, were calculated using the equations, where β is the angular coefficient of linear regression, ul (index) is the upper limit, and ll (index) is the lower limit of the confidence level.
To compare proportions, a two-tailed z-test was utilized, considering differences with a p-value < 0.05 as significant18.
The statistical analyses were conducted using STATA 14.0 software (College Station, TX, USA, 2013).
Ethical Aspects
The data obtained from the information systems maintained by the Ministry of Health are deemed reliable, enabling their use as a feasible tool for analyzing COVID-19 epidemiological indicators19. As these are public data with broad accessibility, it was not necessary to seek approval from the Scientific Research Ethics Committee (CEP) for the study.
RESULTS
In the state of Santa Catarina, events related to the COVID-19 pandemic were recorded from January 2020 to December 2022., with a total of 1,972,219 confirmed cases and 22,636 deaths due to COVID-19. Table 2 shows the monthly distribution of confirmed COVID-19 cases and deaths in Santa Catarina from 2020 to 2022.
Table 2 : Monthly distribution of cases and deaths confirmed by COVID-19 in the state of Santa Catarina, Brazil, from January 2020 to December 2022
| Year | Month | Confirmed cases | Confirmed deaths | ||
|---|---|---|---|---|---|
| Frequency absolute (n) | Frequency relative (%) | Frequency absolute (n) | Frequency relative (%) | ||
| 2020 | January | 0 | 0 | 0 | 0 |
| February | 81 | 0.004 | 0 | 0 | |
| March | 1789 | 0.090 | 6 | 0.026 | |
| April | 3268 | 0.165 | 50 | 0.220 | |
| May | 10 313 | 0.522 | 97 | 0.428 | |
| June | 34 205 | 1,734 | 230 | 1,016 | |
| July | 92 731 | 4,701 | 901 | 3,980 | |
| August | 53 654 | 2,720 | 1061 | 4,687 | |
| September | 29 830 | 1,512 | 516 | 2,279 | |
| October | 57 199 | 2,900 | 329 | 1,453 | |
| November | 148 243 | 7,516 | 711 | 3,141 | |
| December | 105 691 | 5,358 | 1509 | 6,666 | |
| 2021 | January | 80 477 | 4,080 | 1110 | 4,903 |
| February | 120 048 | 6,086 | 1128 | 4,983 | |
| March | 130 024 | 6,592 | 3723 | 16,447 | |
| April | 75 662 | 3,836 | 2480 | 10,955 | |
| May | 84 374 | 4,278 | 1728 | 7,633 | |
| June | 77 234 | 3,916 | 1521 | 6,719 | |
| July | 51 049 | 2,588 | 1083 | 4,784 | |
| August | 38 852 | 1,969 | 698 | 3,083 | |
| September | 27 805 | 1,409 | 528 | 2,332 | |
| October | 20 904 | 1,059 | 380 | 1,678 | |
| November | 13 382 | 0.678 | 298 | 1,316 | |
| December | 15 640 | 0.793 | 182 | 0.804 | |
| 2022 | January | 337 542 | 17,114 | 493 | 2,177 |
| February | 109 693 | 5,561 | 759 | 3,353 | |
| March | 16 336 | 0.828 | 243 | 1,073 | |
| April | 13 118 | 0.665 | 65 | 0.287 | |
| May | 41 578 | 2,108 | 78 | 0.344 | |
| June | 46 277 | 2,346 | 169 | 0.746 | |
| July | 36 979 | 1,874 | 208 | 0.918 | |
| August | 12 769 | 0.647 | 111 | 0.490 | |
| September | 3502 | 0.177 | 41 | 0.181 | |
| October | 3309 | 0.167 | 12 | 0.053 | |
| November | 36 433 | 1,847 | 56 | 0.247 | |
| December | 42 228 | 2,141 | 132 | 0.583 | |
| Total | 1 972 219 | 100.00 | 22 636 | 100.00 | |
Source: Information extracted from the Coronavirus Panel on January 12, 2023, available at:< https://covid.saude.gov.br/ >.
In the state of Paraná, between January 2020 and December 2022, a total of 2,888,258 cases and 45,815 deaths heve been registered due to COVID-19. The monthly distribution of confirmed COVID-19 cases and deaths in the state of Paraná can be observed in Table 3.
Table 3 : Monthly distribution of cases and deaths confirmed by COVID-19 in the state of Paraná, Brazil, from January 2020 to December 2022
| Year | Month | Confirmed cases | Confirmed deaths | ||
|---|---|---|---|---|---|
| Frequency absolute (n) | Frequency relative (%) | Frequency absolute (n) | Frequency relative (%) | ||
| 2020 | January | 0 | 0 | 0 | 0 |
| February | 0 | 0 | 0 | 0 | |
| March | 285 | 0.009 | 6 | 0.013 | |
| April | 1747 | 0.060 | 110 | 0.240 | |
| May | 4647 | 0.160 | 125 | 0.272 | |
| June | 24 357 | 0.843 | 625 | 1,364 | |
| July | 57 817 | 2,001 | 1434 | 3,129 | |
| August | 58 679 | 2,031 | 1570 | 3,426 | |
| September | 49 528 | 1,714 | 1243 | 2,713 | |
| October | 35 626 | 1,233 | 826 | 1,802 | |
| November | 85 980 | 2,976 | 1048 | 2,287 | |
| December | 125,809 | 4,355 | 2325 | 5,074 | |
| 2021 | January | 119 206 | 4,127 | 1990 | 4,343 |
| February | 107 867 | 3,734 | 2044 | 4,461 | |
| March | 173 553 | 6,008 | 6517 | 14,224 | |
| April | 103 382 | 3,579 | 4516 | 9,857 | |
| May | 196 949 | 6,818 | 4928 | 10,756 | |
| June | 166 103 | 5,750 | 5443 | 11,880 | |
| July | 72 616 | 2,514 | 2625 | 5,729 | |
| August | 70 515 | 2,441 | 1592 | 3,474 | |
| September | 60 445 | 2,092 | 1358 | 2,964 | |
| October | 30 680 | 1,062 | 835 | 1,822 | |
| November | 14 060 | 0.486 | 402 | 0.877 | |
| December | 10 256 | 0.355 | 148 | 0.323 | |
| 2022 | January | 477 423 | 16,529 | 647 | 1,412 |
| February | 318 867 | 11,040 | 1354 | 2,955 | |
| March | 56 391 | 1,952 | 482 | 1,052 | |
| April | 28 615 | 0.990 | 122 | 0.266 | |
| May | 109 466 | 3,790 | 229 | 0.499 | |
| June | 90 606 | 3,137 | 360 | 0.785 | |
| July | 57 639 | 1,995 | 273 | 0.595 | |
| August | 33 202 | 1,149 | 19–2 | 0.419 | |
| September | 8156 | 0.294 | 87 | 0.189 | |
| October | 4187 | 0.144 | 35 | 0.076 | |
| November | 40 434 | 1,399 | 72 | 0.157 | |
| December | 92 805 | 3,213 | 252 | 0.550 | |
| Total | 2 888 258 | 100.00 | 45 815 | 100.00 | |
Source: Information extracted from the Coronavirus Panel on August 12, 202215, available at:< https://covid.saude.gov.br/ >.
In the state of Santa Catarina, the first confirmed cases of COVID-19 were recorded in February 2020, representing 0.004% of the total number of cases during the period analysed. For deaths, the first records appeared in April of the same year, corresponding to a relative frequency of 0.96% of the deaths.
In 2020, the average number of confirmed COVID-19 cases and deaths in Santa Catarina was 44,750.3 and 450.8, respectively.The months with the highest number of confirmed COVID-19 cases were July (4.70%), November (7.51%), and December (5.35%). Regarding confirmed COVID-19 deaths, the standout months were July (3.98%), August (4.68%), and December (6.66%).
Continuing into the pandemic period, the average number of confirmed COVID-19 cases and deaths in 2021 was 58,313.7 and 197.25, respectively. Noteworthy months for confirmed cases were February, March, and May, accounting for 6.08%, 6.59%, and 4.27%, respectively. Concerning the total number of deaths in this year, standout months were March, April, and May, representing 16.44%, 10.95%, and 7.63% of the total deaths.
In the year 2022, the average number of confirmed COVID-19 cases and deaths was 19,588.92 and 155.41, respectively. January stood out with 17.11% of the total cases, followed by February with 5.56% and June with 2.34%.In the case of deaths, the standout months were January, February, and March, with relative frequencies of deaths equivalent to 2.17%, 3.35%, and 1.07%, respectively.
As shown in Table 3, the first confirmed cases of COVID-19 in the state of Paraná were recorded in March 2020, accounting for 0.009% of the total cases over the analyzed period and six deaths in the same month, which corresponds to 0.01% of the total number of deaths for the entire analyzed period.
In 2020, the average number of confirmed COVID-19 cases and deaths in the state of Paraná was 37,039.58 and 776, respectively. The months with the highest number of confirmed COVID-19 cases were August (2.03%), November (2.97%) and December (4.35%). The months with the highest number of confirmed COVID-19 deaths were July (3.12%), August (3.42%) and December (5.07%).
In 2021, the average number of confirmed COVID-19 cases and deaths was 93,802.67 and 2,699.83, respectively. Notable months for confirmed cases and deaths were March, May and June, accounting for 6.00%, 6.81% and 5.75% of the total number of cases and 14.22%, 10.75% and 11.88% of the total number of deaths, respectively.
In 2022, the average number of confirmed COVID-19 cases and deaths was 109 845.9 and 342.08 respectively. January stood out with 16.52% of the total number of cases, followed by February with 11.04% and May with 3.79%. On the other hand, the months with the highest number of deaths were January, February and March, with a relative frequency of 1.41%, 2.95% and 1.05% respectively. For both states, Table 4 shows the mortality, case fatality and incidence rates of COVID-19
Table 4 : Monthly distribution of mortality, lethality and incidence rates of COVID-19 in the states of Santa Catarina and Paraná, Brazil, from January 2020 to December 2022
| Year | Month | Santa Catarina | Paraná | ||||
|---|---|---|---|---|---|---|---|
| Mortality (100.000 inhabitants) | Lethality (100%) | Incidence (100.000 inhabitants) | Mortality (100.000 inhabitants) | Lethality (100%) | Incidence (100.000 inhabitants) | ||
| 2020 | January | 0 | 0 | 0 | 0 | 0 | 0 |
| February | 0 | 0 | 0 | 0 | 0 | 0 | |
| March | 0.082 | 0.335 | 24.620 | 0.051 | 2.105 | 2.469 | |
| April | 0.688 | 1.529 | 44.975 | 0.953 | 6.296 | 15.140 | |
| May | 1.333 | 0.940 | 141.975 | 1.083 | 2.689 | 40.273 | |
| June | 3.165 | 0.672 | 470.742 | 5.416 | 2.565 | 211.092 | |
| July | 12.399 | 0.971 | 1276.197 | 12.427 | 2.480 | 501.078 | |
| August | 14.601 | 1.977 | 738.406 | 13.606 | 2.675 | 508.757 | |
| September | 7.101 | 1.729 | 410.531 | 10.772 | 2.509 | 429.240 | |
| October | 4.527 | 0.575 | 787.194 | 7.158 | 2.318 | 308.757 | |
| November | 9.785 | 0.479 | 2040.174 | 9.082 | 1.218 | 745.156 | |
| December | 20.767 | 1.427 | 1454.558 | 20.149 | 1.848 | 1090.339 | |
| TOTAL | 74.45 | 1.00 | 7.390.44 | 80.70 | 2.09 | 3852.09 | |
| 2021 | January | 15.098 | 1.379 | 1142.321 | 17.148 | 1.669 | 1.027.252 |
| February | 15.343 | 0.939 | 1632.909 | 17.614 | 1.894 | 929.539 | |
| March | 50.640 | 2.863 | 1768.604 | 56.159 | 3.755 | 1.495.585 | |
| April | 33.733 | 3.277 | 1029.165 | 38.916 | 4.368 | 890.889 | |
| May | 23.504 | 2.048 | 1147.666 | 42.466 | 2.502 | 1.697.199 | |
| June | 20.688 | 1.969 | 1050.547 | 46.904 | 3.276 | 1.431.385 | |
| July | 14.731 | 2.121 | 694.375 | 22.620 | 3.614 | 625.765 | |
| August | 9.494 | 1.796 | 528.470 | 13.718 | 2.257 | 607.659 | |
| September | 7.181 | 1.898 | 378.207 | 11.702 | 2.246 | 520.882 | |
| October | 5.168 | 1.817 | 284.339 | 7.195 | 2.721 | 264.383 | |
| November | 4.053 | 2.226 | 182.023 | 3.464 | 2.859 | 121.161 | |
| December | 2.475 | 1.163 | 212.737 | 1.275 | 1.443 | 88.380 | |
| TOTAL | 202.11 | 2.02 | 10.051.36 | 279.18 | 2.87 | 9.700.08 | |
| 2022 | January | 6.630 | 0.146 | 4539.460 | 5.545 | 0.135 | 4092.328 |
| February | 10.207 | 0.691 | 1475.215 | 11.606 | 0.424 | 2733.233 | |
| March | 3.268 | 1.487 | 219.696 | 4.131 | 0.854 | 483.366 | |
| April | 0.874 | 0.495 | 176.418 | 1.045 | 0.426 | 245.279 | |
| May | 1.048 | 0.187 | 559.165 | 1.962 | 0.209 | 938.310 | |
| June | 2.272 | 0.365 | 622.359 | 3.085 | 0.397 | 776.647 | |
| July | 2.797 | 0.562 | 497.315 | 2.34 | 0.473 | 494.064 | |
| August | 1.492 | 0.869 | 171.724 | 1.645 | 0.578 | 284.597 | |
| September | 0.551 | 1.17 | 47.096 | 0.745 | 1.021 | 72.996 | |
| October | 0.161 | 0.362 | 44.501 | 0.300 | 0.835 | 35.889 | |
| November | 0.753 | 0.153 | 489.972 | 0.617 | 0.178 | 346.588 | |
| December | 1.775 | 0.312 | 567.906 | 2.16 | 0.271 | 795.496 | |
| TOTAL | 31.832 | 0.338 | 9.410.832 | 35.186 | 0.311 | 11 298.799 | |
| Total | 308.40 | 1.14 | 26.852.64 | 395.07 | 1.58 | 24.850.98 | |
When comparing the case fatality rates between the states of Santa Catarina and Paraná, it was noted that the overall rate remained higher in the state of Paraná throughout the period analysed, with notable peaks in April 2020 (1.52%), April 2021 (3.27%) and July 2022 (0.56%).
In terms of incidence, Santa Catarina stands out compared to the other states, with higher rates. In 2021, the highest incidence rate for COVID-19 was observed in Santa Catarina, with a total of 10,051.36 per 100,000 inhabitants. This compares to a rate of 9,700.08 per 100,000 inhabitants in the state of Paraná.
Similar to the case fatality rate, the mortality in Paraná was higher in all periods, with the highest observed in the year 2021 with a rate of 279.18 per 100,000 inhabitants.
Trends of mortality, case fatality, and incidence rates of COVID-19 in the states of Santa Catarina and Paraná can be visualised in Table 5. For analyses considered statistically significant (p < 0.005), The DPC reveals the percentage of daily variation, showing the increase or decrease for the variables.
Table 5 : Prais-Winsten regression estimates and daily percentage variation (DPV) of mortality, lethality and incidence rates of COVID-19 in the states of Santa Catarina and Paraná, Brazil, from January 2020 to December 2022
| RATE/YEAR | LINEAR REGRESSION | ||||
|---|---|---|---|---|---|
| β | P | VPD | (IC95%) | Trend | |
| SANTA CATARINA | |||||
| MORTALITY | |||||
| 2020 to 2022 | -0.00057 | 0.022 | -0.13 | -0.24; -0.02 | Descending |
| 2020 | - 0.0052064 | <0.001 | 1.21 | 0.90; 1.51 | Growing |
| 2021 | -0.0029476 | <0.001 | -0.68 | -0.86; -0.49 | Descending |
| 2022 | -0.0022546 | <0.001 | -0.52 | -0.73; -0.31 | Descending |
| LETHALITY | |||||
| 2020 to 2022 | -0.0004837 | <0.001 | -0.11 | -0.16; -0.06 | Descending |
| 2020 | -0.0010693 | 0.031 | -0.25 | -0.47; -0.02 | Descending |
| 2021 | -0.0000551 | 0.847 | -0.01 | -0.14; 0.12 | Stationary |
| 2022 | 0.0009924 | 0.106 | 0.23 | -0.05; 0.51 | Stationary |
| INCIDENCE | |||||
| 2020 to 2022 | 0.0002509 | 0.625 | 0.06 | -0.17; 0.29 | Stationary |
| 2020 | 0.0066926 | <0.001 | 1.55 | 1.12; 1.98 | Growing |
| 2021 | -0.0028518 | <0.001 | -0.65 | -0.78; -0.53 | Descending |
| 2022 | -0.0027203 | 0.129 | -0.62 | -1.43; 0.18 | Stationary |
| PARANÁ | |||||
| MORTALITY | |||||
| 2020 to 2022 | -0.000557 | 0.119 | -0.13 | -0.29; 0.03 | Stationary |
| 2020 | 0.0060981 | <0.001 | 1.41 | 1.04; 1.79 | Growing |
| 2021 | -0.0035531 | <0.001 | -0.81 | -1.13; -0.50 | Descending |
| 2022 | -0.0026543 | <0.001 | -0.61 | -0.61; -0.84 | Descending |
| LETHALITY | |||||
| 2020 to 2022 | -0.0010223 | <0.001 | -0.24 | -0.28; -0.19 | Descending |
| 2020 | -0.0019057 | <0.001 | -0.44 | -0.56; -0.31 | Descending |
| 2021 | -0.0001992 | 0.351 | -0.05 | -0.14; 0.05 | Stationary |
| 2022 | 0.0008202 | 0.069 | 0.19 | -0.01; 0.39 | Stationary |
| INCIDENCE | |||||
| 2020 to 2022 | 0.0016438 | 0.001 | 0.38 | 0.16; 0.60 | Growing |
| 2020 | 0.0118071 | <0.001 | 2.76 | 1.94; 3.58 | Growing |
| 2021 | -0.0033085 | <0.001 | -0.76 | -0.94; -0.58 | Descending |
| 2022 | -0.0030327 | <0.001 | -0.70 | -1.08; -0.31 | Descending |
β – regression coefficient; P – p-value; VPD – Daily percentage variation; 95% CI - 95% confidence interval. * Statistical difference detected by the Prais-Winsten regression test, p<0.05.
For the State of Santa Catarina, when the rates were analized over the whole period, the trends for mortality, case fatality, and incidence are decreasing, decreasing, and stationary, respectively. However, for the State of Paraná, for the same rates and period, the behaviour is stationary, decreasing and increasing, respectively.
If we analyze the incidence curve (Figure 1), we can see that the highest peak occurred in January 2022 when the state of Santa Catarina had higher incidence values, with a more pronounced decline compared to the state of Paraná. The incidence peaks from January 2020 were higher in Santa Catarina until March 2021, when a higher incidence was observed in the state of Paraná. From there, the curves remained similar until May 2022 when a peak incidence of COVID-19 was observed in the state of Paraná (Figure 1).”
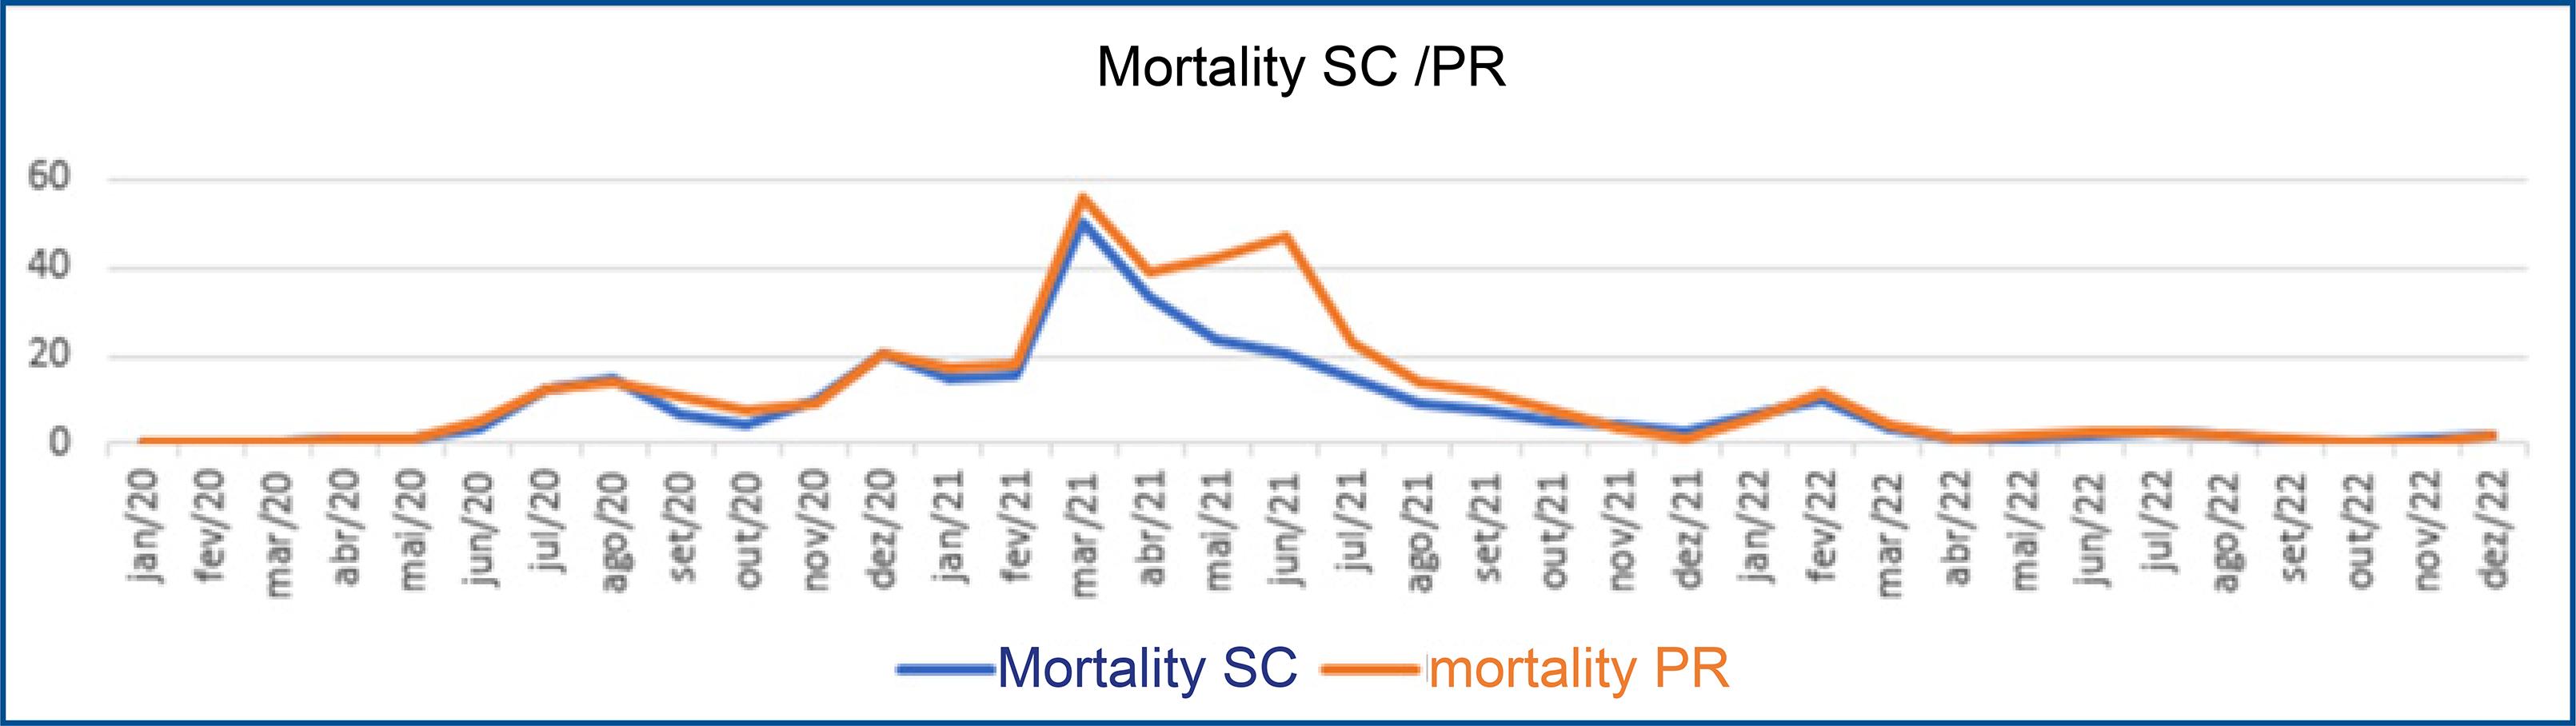
Figure 1 Trend analysis of COVID-19 mortality rates in the states of Santa Catarina and Paraná, Brazil, from January 2020 to December 2022
When observing the trend analysis graph of mortality (Figure 2), it was found that the peak of both curves started in February 2021, reaching its highest point in March.
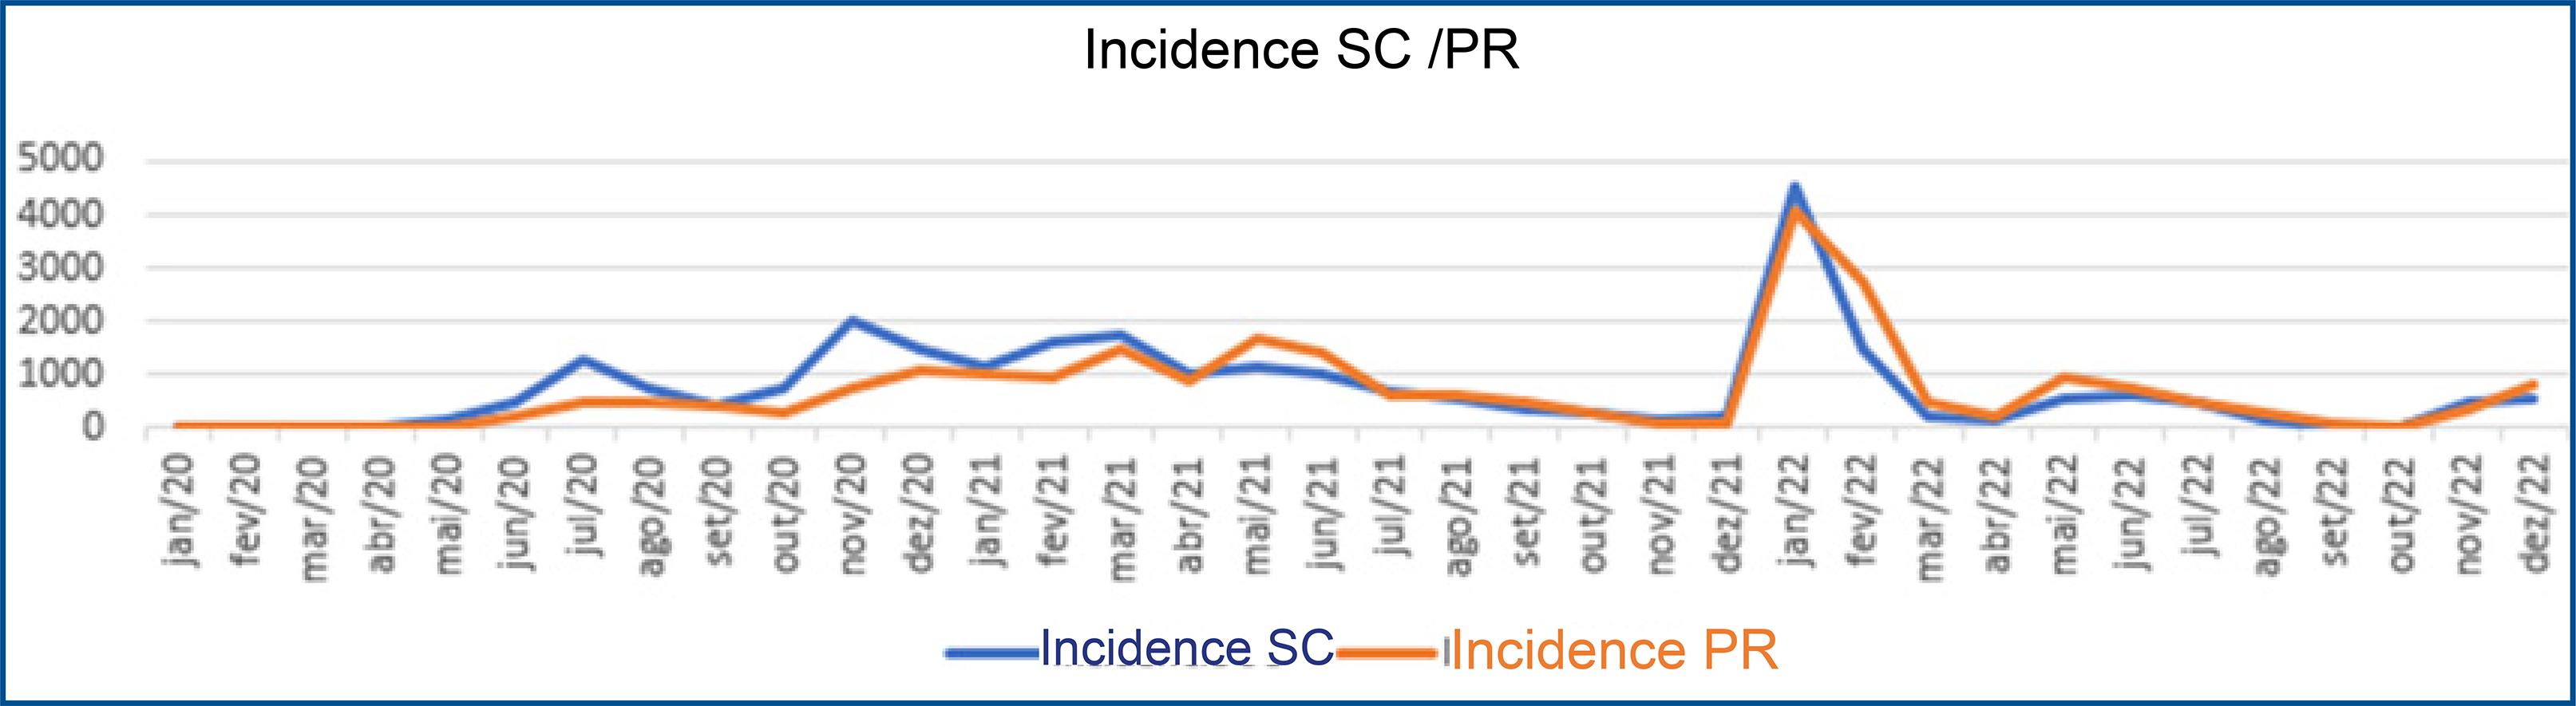
Figure 2 : Trend analysis of COVID-19 incidence rates in the states of Santa Catarina and Paraná, Brazil, from January 2020 to December 2022
The state of Paraná maintained a higher mortality rate, with another peak in June 2021, while the state of Santa Catarina continued to decline. The last peak observed until December 2022 was in February 2022 for both states (Figure 2).
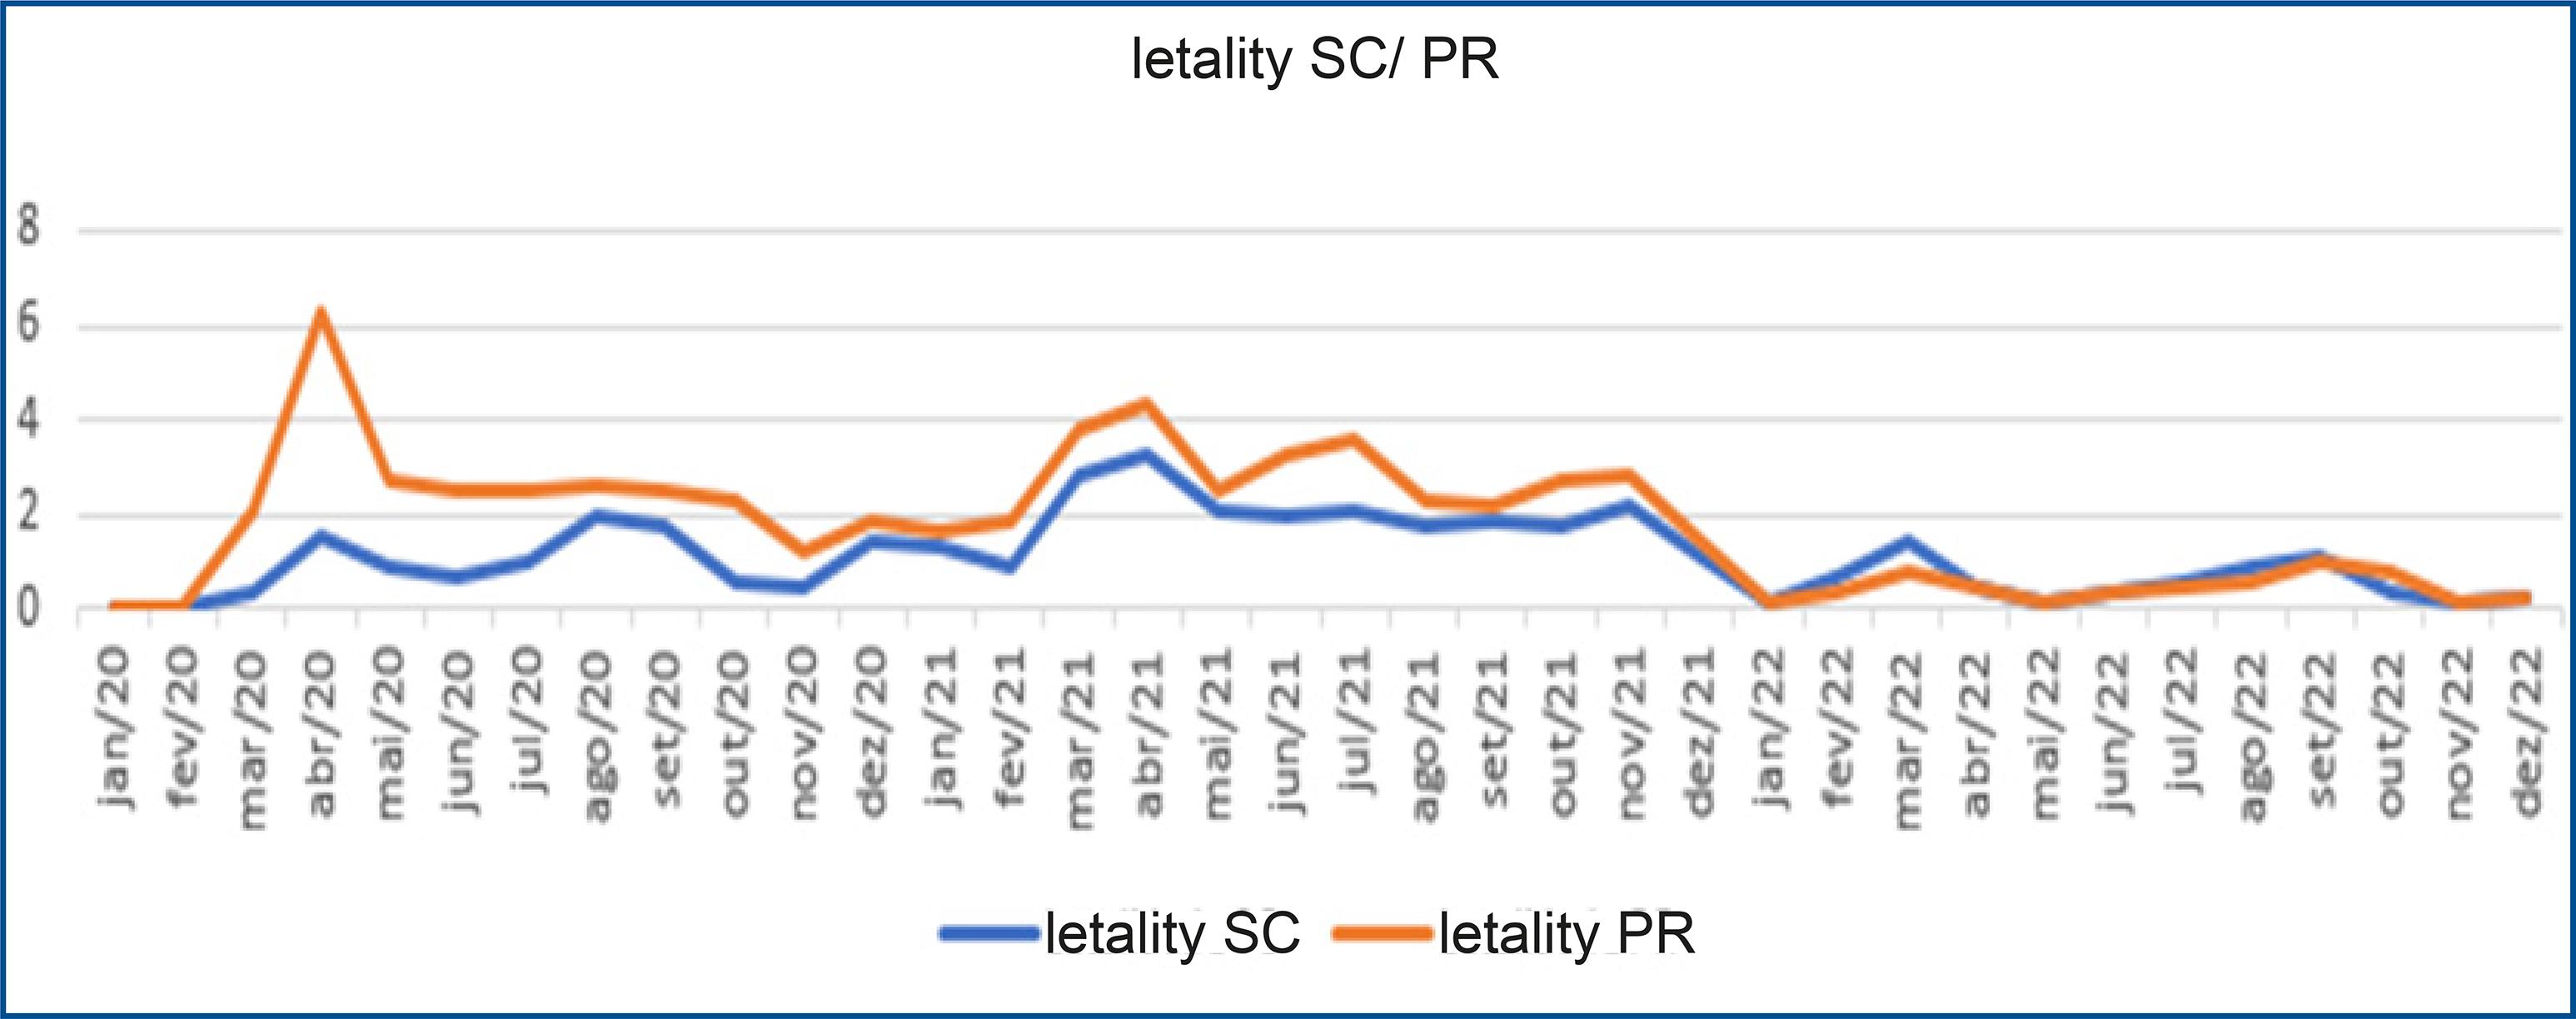
In the graph (Figure 3), it is noticiable that case fatality was higher in the year 2020 in the states of Paraná and Santa Catarina in the initial phase of the disease. The peak for both states can be observed in April 2020, with Paraná showing higher percentiles compared to Santa Catarina. There was a significant increase in the number of deaths in both states in April 2021, although Paraná remained higher. From January 2022, there was a reversal in the curves, and it is possible to observe that until April 2022, the case fatality rates are higher in the State of Santa Catarina (Figure 3).
DISCUSSION
The factors and outcomes of the COVID-19 pandemic are influenced by socio-demographic inequalities, geographical location, and political and religious ideology. Therefore, it is necessary to study and compare states with different socioeconomic characteristics in Brazil, as these inequalities may cause differences in mortality, incidence, and case fatality rates.
In the United States, a study analysed how social conditions in the country’s counties were related to differences in COVID-19 mortality rates. The results showed that black race, the percentage of Hispanics and income inequality were associated with higher mortality rates. Thus, regional social conditions are strong predictors of how the pandemic was experienced and where there was a greater loss of life20.
Based on the data presented, the state of Paraná shows significant differences in the distribution of pandemic compared to the state of Santa Catarina. These differences are explained by several factors, including population density, age distribution, health status, and the timing of disease onset in communities and regions21. Throughout the pandemic, the southern region had the lowest incidence and mortality rates.
One socioeconomic inequality indicator is the Human Development Index (HDI), which encompasses factors such as development issues, infrastructure, human rights, public policies, economy, and social aspects22.
The HDI for the Brazilian states included in this study is 0.749 for Paraná and 0.774 for Santa Catarina. In the analysis of COVID-19 mortality, it was observed that Paraná maintained a higher mortality rate, which is consistent with the findings of Rambotti, Wolski, and Anderson20, who found a higher mortality rate in regions with greater socioeconomic inequality.
In addition, the case fatality rate was higher in Paraná than in Santa Catarina in all periods, with the highest observed in 2021 with a rate of 279.188 per 100,000 inhabitants, 1.38 times higher than in Santa Catarina.
The results of an ecological analytical study that analyzed COVID-19 incidence in association with social determinants of health in the Northeast region of Brazil23also supported our findings, as well as those of Rambotti, Wolski, and Anderson20. Socioeconomic factors and social indicators such as the Gini Index, literacy rate, percentage of people living below the poverty level, and people living in poverty-vulnerable households are factors of higher COVID-19 incidence in the Brazilian Northeast23.
The Gini Index measures the degree of income concentration and, consequently, social inequality. The index can range from 0 to 1, with values closer to zero indicating lower concentration. In 2020, Paraná had a Gini Index for the distribution of Gross Domestic Product (GDP) of 0.755, the lowest since 2002. Social distancing measures due to the pandemic favored this decline, as the service sector was affected24.
In the same year, Santa Catarina’s Gini Index was 0.550, indicating lower social inequality compared to Paraná25. According to the results of Dos Santos Alves23, which indicate a higher COVID-19 incidence in regions with worse socioeconomic factors and social indicators, Santa Catarina stands out compared to Paraná. Santa Catarina had the highest incidence rate, with 10,051.36 cases per 100,000 inhabitants, compared with 9,700.084 cases per 100,000 inhabitants in Paraná.
In addition, Paraná’s per capita income is lower than that of Santa Catarina, which had lower case fatality and mortality rates but higher incidence rates, possibly due to the state’s diagnostic capacity..
It is also worth noting that isolation in the Southern region may have been more effective due to the socioeconomic factors of residents26, considering that the number of cases was higher in regions with lower per capita GDP, such as the North and Northeast regions27.
The results of an epidemiological study using data from the John Hopkins Institute and the Ministry of Health during the first 65 days of the pandemic in the Southern region of Brazil showed that, althought the state of Santa Catarina having a higher number of cases, Paraná accounted for the highest number of deaths and the highest case fatality rate in the Southern region10. These results are consisted with our study in the months of March and April in the year of 2020, where the number of deaths was higher in the State of Paraná, even though the number of infected individuals was higher in Santa Catarina.
COVID-19 is a significant global health threat, with millions of confirmed cases and deaths worldwide, impacting several healthcare systems, including those in Brazil.
Brazil presents a complex epidemiological scenario due to regional differences and its large continental size28. A high number of cases and deaths were observed in the states of Santa Catarina and Paraná, two states in the southern region of Brazil. This study was undertaken due to the need for a detailed assesment and comparison of the epidemiological context between the States.
The epidemiology of COVID-19 deserves special attention given the high clinical, social and economic burden and the high mortality, incidence and case fatality rates observed. On a broader scale, it is known that approximately one third of the world’s population may have been exposed to SARS-CoV-2 infection, a number that is likely to increase as the virus continues to circulate29.
Despite the decline in the severity of acute COVID-19 infection and the gradual decrease in the numbers of deaths following the implementation of restriction measures, vaccine distribution, virus attenuation, the development of natural immunity, and better therapeutic management, it is important to recognize the importance of epidemiological studies on the disease, even after declaring the end of the pandemic.
In response to the COVID-19 pandemic, several containment and mitigation interventions were implemented to avoid overwhelming health systems and protect vulnerable populations30. Measures such as social distancing, hand hygiene, masks, quarantine and isolation have proven effective in reducing SARS-CoV-2 transmission, but vaccination has also played a critical role in minimizing the risk of severe COVID-197,28,31.
Over these three years of the COVID-19 pandemic, there has been a possible demonstration of the crucial role of vaccination in reducing the burden of COVID-19 disease in the populations of Paraná and Santa Catarina. There is a protective effect of vaccination against complications and deaths related to COVID-1932, especially among those who received complete primary vaccination and booster doses. The implementation of a mass vaccination campaign could significantly reduced pressure on the healthcare system and society, positively impacting the pandemic trajectory in these two southern Brazilian states.
The limitations of this research relate to changes for adjustments in the databases used, as small variations may occur. However, these would not affect the interpretation of the results or the conclusions of the study.
Furthermore, the results presented are partial data, as the pandemic continues to be studied. The number of cases found may be higher, given the limitations of mass testing for COVID-19 detection.
CONCLUSION
The abrupt increase in the number of infections and deaths harmed the healthcare structure of the states of Paraná and Santa Catarina, demonstrating the need for public policies in managing the pandemic.
When comparing the epidemiological outcomes of incidence, case fatality, and mortality due to COVID-19 between the states of Santa Catarina and Paraná in the southern region of Brazil, it is observed that the state of Paraná had higher rates of case fatality and mortality, while the state of Santa Catarina had a higher incidence rate throughout the analyzed period.
It was noted that mass immunization had a positive impact against the evolution of the pandemic, resulting in a stationary trend in incidence for both states. Therefore, public health policymakers must remain vigilant in monitoring COVID-19 data and adapt interventions according to the active and informed engagement of all relevant stakeholders, including citizens.

