


 texto em
  Inglês (pdf)
 Artigo em XML
 Referências do artigo

 Permalink
INTRODUCTION
Stroke (Cerebral Vascular Accident) is a health concern in Brazil and around the world. Stroke is a serious condition that can result in permanent brain damage or even death if not treated quickly, and it is a disease that causes morbidity and mortality.
Cerebral Vascular Accident (CVA) is characterized by a set of cerebrovascular events, which occur due to a dysfunction present in the cerebral blood supply. It can be classified as ischemic or hemorrhagic, presenting high morbidity and mortality rates1,2.
The first occurs due to permanent or transient blockage of the blood vessels that supply the brain, which can be intracranial or extracranial3, in addition to being significantly more common than hemorrhagic, representing around 87% of all cases4. In contrast, hemorrhagic stroke is defined as the rupture of a cerebral artery, often already affected by aneurysms and arteriovenous malformations5.
Stroke is the second leading cause of death globally6 and ranks third as a disabling condition in the world7. Every year, 17 million cases of stroke occur worldwide. Of these, 6.5 million result in death, while the rest contribute to the increase in the prevalence of the disease8,9.
In Brazil, stroke is the disease with the highest prevalence of deaths10, the biggest cause of disability in the population over the age of 50, and is responsible for around 40% of early retirements11. Furthermore, there is a rapid increase in its incidence7. According to the World Health Organization, this trend will persist until 2060, representing 12.8% of deaths in Brazil12.
Among the various risk factors for the development of stroke, high blood pressure, smoking, diabetes mellitus, hyperlipidemia, consumption of toxic substances, inadequate dietary patterns and lack of physical activity stand out13.
The consequences of stroke vary depending on the arteries affected. Among the most common manifestations are changes in strength and/or sensitivity on one or both sides of the body, speech difficulties, facial paralysis, vision problems, dizziness, memory impairment, sudden and unusual headaches, difficulty with balance, disturbances of consciousness and confusion14, functional limitations15 and decreased cardiorespiratory capacity16.
Despite advances in initial stroke treatment, mortality rates remain high17,18, which suggests that current primary prevention strategies for stroke and cardiovascular diseases are not being implemented comprehensively or are not adequately effective19,20. Given this scenario, the World Health Organization (WHO) emphasizes the need to immediately implement preventive and treatment measures for this condition21.
In this context, the need for a greater understanding of mortality resulting from stroke stands out, in order to significantly contribute to the improvement of prevention, diagnosis, treatment strategies and the development of public health actions. The challenge of detecting an increase or decrease in stroke mortality rates and estimating a value is characteristic of trend analysis in time series. Time series regression models provide estimates of population parameters that can be used to understand the current state of the population and design various population management decisions22.
Joinpoint regression can be used to accurately estimate changes in mortality rates for a given condition, in order to identify and evaluate when changes occur in population parameters22.
It was used to evaluate variations in driver mortality rates after the implementation of traffic laws23, to examine trends in cancer incidence in countries such as Canada, the United Kingdom, Japan and Italy, among others24-27, to investigate changes in the suicide rate in Denmark28, to analyze the incidence of syphilis and gonorrhea29, among others.
In this way, it is noteworthy that the identification of specific epidemiological patterns and regional disparities allows a personalized and effective approach, capable of providing essential information for the development of public policies and targeted health programs, and may contribute to the reduction of mortality rates due to Stroke.
Thus, the objective is to evaluate the trend in the mortality rate and proportional mortality from stroke in the population of Pernambuco, from 2000 to 2021.
METHODS
Type of study
This is an ecological time series study with data from the population of the state of Pernambuco, Brazil and from 2000 to 2021.
Study population and data source
Information on the number of deaths and demographic data of the resident population were obtained for the state of Pernambuco, located in the Brazilian Northeast Region, with a demographic density of 92.37 inhabitants/km2, and a Human Development Index of 0.719. All information on mortality and population estimates for the state of Pernambuco were extracted from the database of the Department of Informatics of the Unified Health System - DATASUS (https://datasus.saude.gov.br/informacoes-de-saude-tabnet/).
The number of deaths by sex and age group in the period from 2000 to 2021 were extracted from the Vital Statistics and Mortality tab since 1996 by ICD-10 on the DATASUS website (https://datasus.saude.gov.br/mortalidade-desde-1996 -pela-cid-10). In Brazil, death certificates are issued by health professionals and registered in the Mortality Information System of the Brazilian Ministry of Health. Subsequently, the information from the death certificates was transferred to DATASUS. DATASUS is the Department of Informatics of the Unified Health System (SUS) of Brazil, responsible for collecting, processing, and disseminating health information.
Information on the population estimate was extracted from the DATASUS website (https://datasus.saude.gov.br/populacao-residente) in the tab sequences: Demographic and Socioeconomic, Resident Population and Population Estimate Study by municipality, sex and age - 2000-2021 This information was extracted for the total group and by sex and age group for the period from 2000 to 2021.
The eligibility criteria were deaths with the underlying cause being stroke that occurred in the state of Pernambuco. The exclusions were data cataloged as ignored for sex and age group. Data extractions were carried out by trained researchers. Possible discrepancies in data extraction between researchers were corrected by consensus through repeated extractions.
Study variable
The study variable was death with the underlying cause being stroke (not specified as hemorrhagic or ischemic) occurring in the state of Pernambuco. The stroke variable was extracted for the entire population and stratified by sex (male and female) and age group (0 to 29 years, 30 to 39 years; 40 to 49 years; 50 to 59 years; 60 to 69 years; 70 to 79 years old). years; 80 years or older) for calendar years between 2000 and 2021. In the International Classification of Diseases version 10, stroke is coded as I6430.
In this study, the definition of stroke presented by the American Heart Association /American Stroke Association31 was adopted, as follows: episode of acute neurological dysfunction, presumably caused by ischemia or hemorrhage, persisting for 24 hours or longer or until death, but without sufficient evidence to be classified as ischemia or hemorrhage.
Data analysis
Information on the number of deaths from stroke, deaths from all causes and population, with stratification by sex and age group, was extracted using the file transfer system from the DATASUS database to a file in the format of values separated by comma (CSV).
For each year between 2000 and 2019, the mortality rate per 100,000 inhabitants and the proportional mortality from stroke were calculated using a routine created in the Microsoft Office Excel spreadsheet. Subsequently, in the Stata 17 program, the mean, standard deviation, asymmetry and kurtosis of the total number of deaths were calculated for the total group and by sex.
To calculate the mortality rate, the number of deaths from stroke was divided by the total population or stratified by sex and age group and the product of the division was multiplied by 100 thousand inhabitants. Proportional mortality was calculated by dividing the number of deaths from stroke by the number of deaths from all causes for the total population and stratified by sex and age group and the product of the division was multiplied by 100.
Joinpoint regression model
The temporal trend of stroke was evaluated by Jointpoint regression, with the help of the Joinpoint Regression Program (version 5.0.2, 2023) developed by the National Cancer Institute, Rockville, MD, USA. Joinpoint32 and regression models were applied to identify change points in the time series and the trend of each segment of the mortality rate and proportional mortality from 2000 to 2021.
The models were analyzed for the total group and stratified by sex and age group. In each model, the dependent variables were the mortality rate or proportional mortality indicators, and the independent variable was the year. The options of heteroscedastic errors with constant variation, the maximum number of 3 joinpoints and the log-linear model were chosen for the analysis of the models. The weighted BIC method was applied for model selection.
The annual percentage change (APC) and the average annual percentage change (AAPC) with 95% confidence intervals estimated by the parametric method indicated the direction and magnitude of temporal trends. When there was no segment trend in the period, the APC was similar to the AAPC. Joinpoint regression models with a p value equal to or less than 5% were statistically significant.
RESULTS
In the period from 2000 to 2021 there were 39,410 deaths with stroke as the underlying cause. Of these, 49.0% (19,295 deaths) were male and 51.0% (20,107 deaths) were female. In the sex variable, there were 8 cases without sex recorded. Females showed an average of 913.45 (standard deviation: 189.51) in the number of deaths, being quantitatively higher than the average identified for males of 877.04 deaths (standard deviation: 181.52).
The years with the highest number of deaths due to stroke were 2006, 2007 and 2008. In 2018 there was the lowest number of deaths recorded (1057 deaths) due to stroke. There was a progressive increase in the number of deaths from stroke from 2018 to 2021. In most years, males had higher mortality rate values.
In 2006 there was the highest mortality rate for both sexes. From 2018 onwards, there was a progressive increase in the mortality rate for men and women. In proportional mortality, females showed higher values throughout the studied period.
In both sexes, in 2006 there were the highest values of proportional mortality and in 2018 the lowest values of proportional mortality. A progressive increase in proportional mortality occurred from 2018 onwards (table 1).
Table 1 : Number of deaths, mortality coefficient and proportional mortality from stroke disease by sex in the population of the state of Pernambuco, Brazil between 2000 and 2021
| Total | Masculine | Feminine | |||||||
|---|---|---|---|---|---|---|---|---|---|
| Deaths | CM | MP* | Deaths | CM | MP* | Deaths | CM | MP* | |
| 2000 | 1831 | 22.6 | 1.8 | 930 | 23.7 | 3.1 | 901 | 21.5 | 4.1 |
| 2001 | 1894 | 23.0 | 1.8 | 957 | 24.1 | 3.2 | 937 | 22.1 | 4.4 |
| 2002 | 2016 | 24.3 | 2.0 | 1019 | 25.4 | 3.4 | 997 | 23.2 | 4.5 |
| 2003 | 2003 | 23.8 | 1.9 | 982 | 24.2 | 3.2 | 1020 | 23.5 | 4.5 |
| 2004 | 2055 | 24.2 | 1.8 | 964 | 23.5 | 3.2 | 1090 | 24.8 | 4.7 |
| 2005 | 2171 | 25.3 | 2.0 | 1025 | 24.8 | 3.5 | 1146 | 25.8 | 5.1 |
| 2006 | 2384 | 27.5 | 2.2 | 1166 | 27.9 | 3.9 | 1218 | 27.1 | 5.5 |
| 2007 | 2255 | 25.8 | 2.1 | 1140 | 27.0 | 3.7 | 1114 | 24.6 | 4.9 |
| 2008 | 2265 | 25.6 | 2.0 | 1081 | 25.4 | 3.5 | 1184 | 25.8 | 5.1 |
| 2009 | 2036 | 22.8 | 1.8 | 991 | 23.1 | 3.2 | 1044 | 22.6 | 4.4 |
| 2010 | 1915 | 21.3 | 1.7 | 914 | 21.1 | 3.0 | 1000 | 21.4 | 4.2 |
| 2011 | 1998 | 22.0 | 1.8 | 1005 | 23.1 | 3.1 | 992 | 21.1 | 4.0 |
| 2012 | 1818 | 19.9 | 1.6 | 890 | 20.3 | 2.8 | 927 | 19.6 | 3.6 |
| 2013 | 1669 | 18.2 | 1.4 | 789 | 17.9 | 2.4 | 879 | 18.4 | 3.4 |
| 2014 | 1523 | 16.5 | 1.3 | 743 | 16.7 | 2.3 | 780 | 16.2 | 3.1 |
| 2015 | 1567 | 16.8 | 1.3 | 794 | 17.7 | 2.3 | 773 | 16.0 | 2.8 |
| 2016 | 1572 | 16.8 | 1.1 | 746 | 16.6 | 2.0 | 826 | 17.0 | 2.8 |
| 2017 | 1216 | 12.9 | 0.9 | 572 | 12.6 | 1.6 | 644 | 13.1 | 2.3 |
| 2018 | 1057 | 11.1 | 0.9 | 528 | 11.6 | 1.5 | 529 | 10.7 | 1.9 |
| 2019 | 1196 | 12.5 | 0.9 | 570 | 12.4 | 1.6 | 626 | 12.6 | 2.1 |
| 2020 | 1402 | 14.6 | 0.9 | 706 | 15.3 | 1.7 | 696 | 13.9 | 2.0 |
| 2021 | 1567 | 16.2 | 1.0 | 783 | 16.9 | 1.8 | 784 | 15.6 | 2.1 |
| Total | 39410 | 19295 | 20107 | ||||||
| Average | 1791.36 | 877.04 | 913.45 | ||||||
| Standard deviation | 367.89 | 181.52 | 189.51 | ||||||
| Kurtosis | 2.22 | 2.25 | 2.21 | ||||||
| Asymmetry | -0.36 | -0.39 | -0.21 | ||||||
CM: Mortality coefficient per 100,000; MP: Proportional mortality.
In figure 1, it is observed that the number of deaths due to stroke stratified by age group in the population of the state of Pernambuco, Brazil, 2000 and 2021. In all the years studied, the age group with the highest number of deaths due to stroke was aged 80 or over with 16,376 deaths (41.5%) and aged 70 to 79 with 11,526 deaths (29.2%). At 80 years of age or older, the years with the highest number of deaths from stroke were 2006 (1004 deaths), 2007 (995 deaths) and 2008 (1047 deaths).
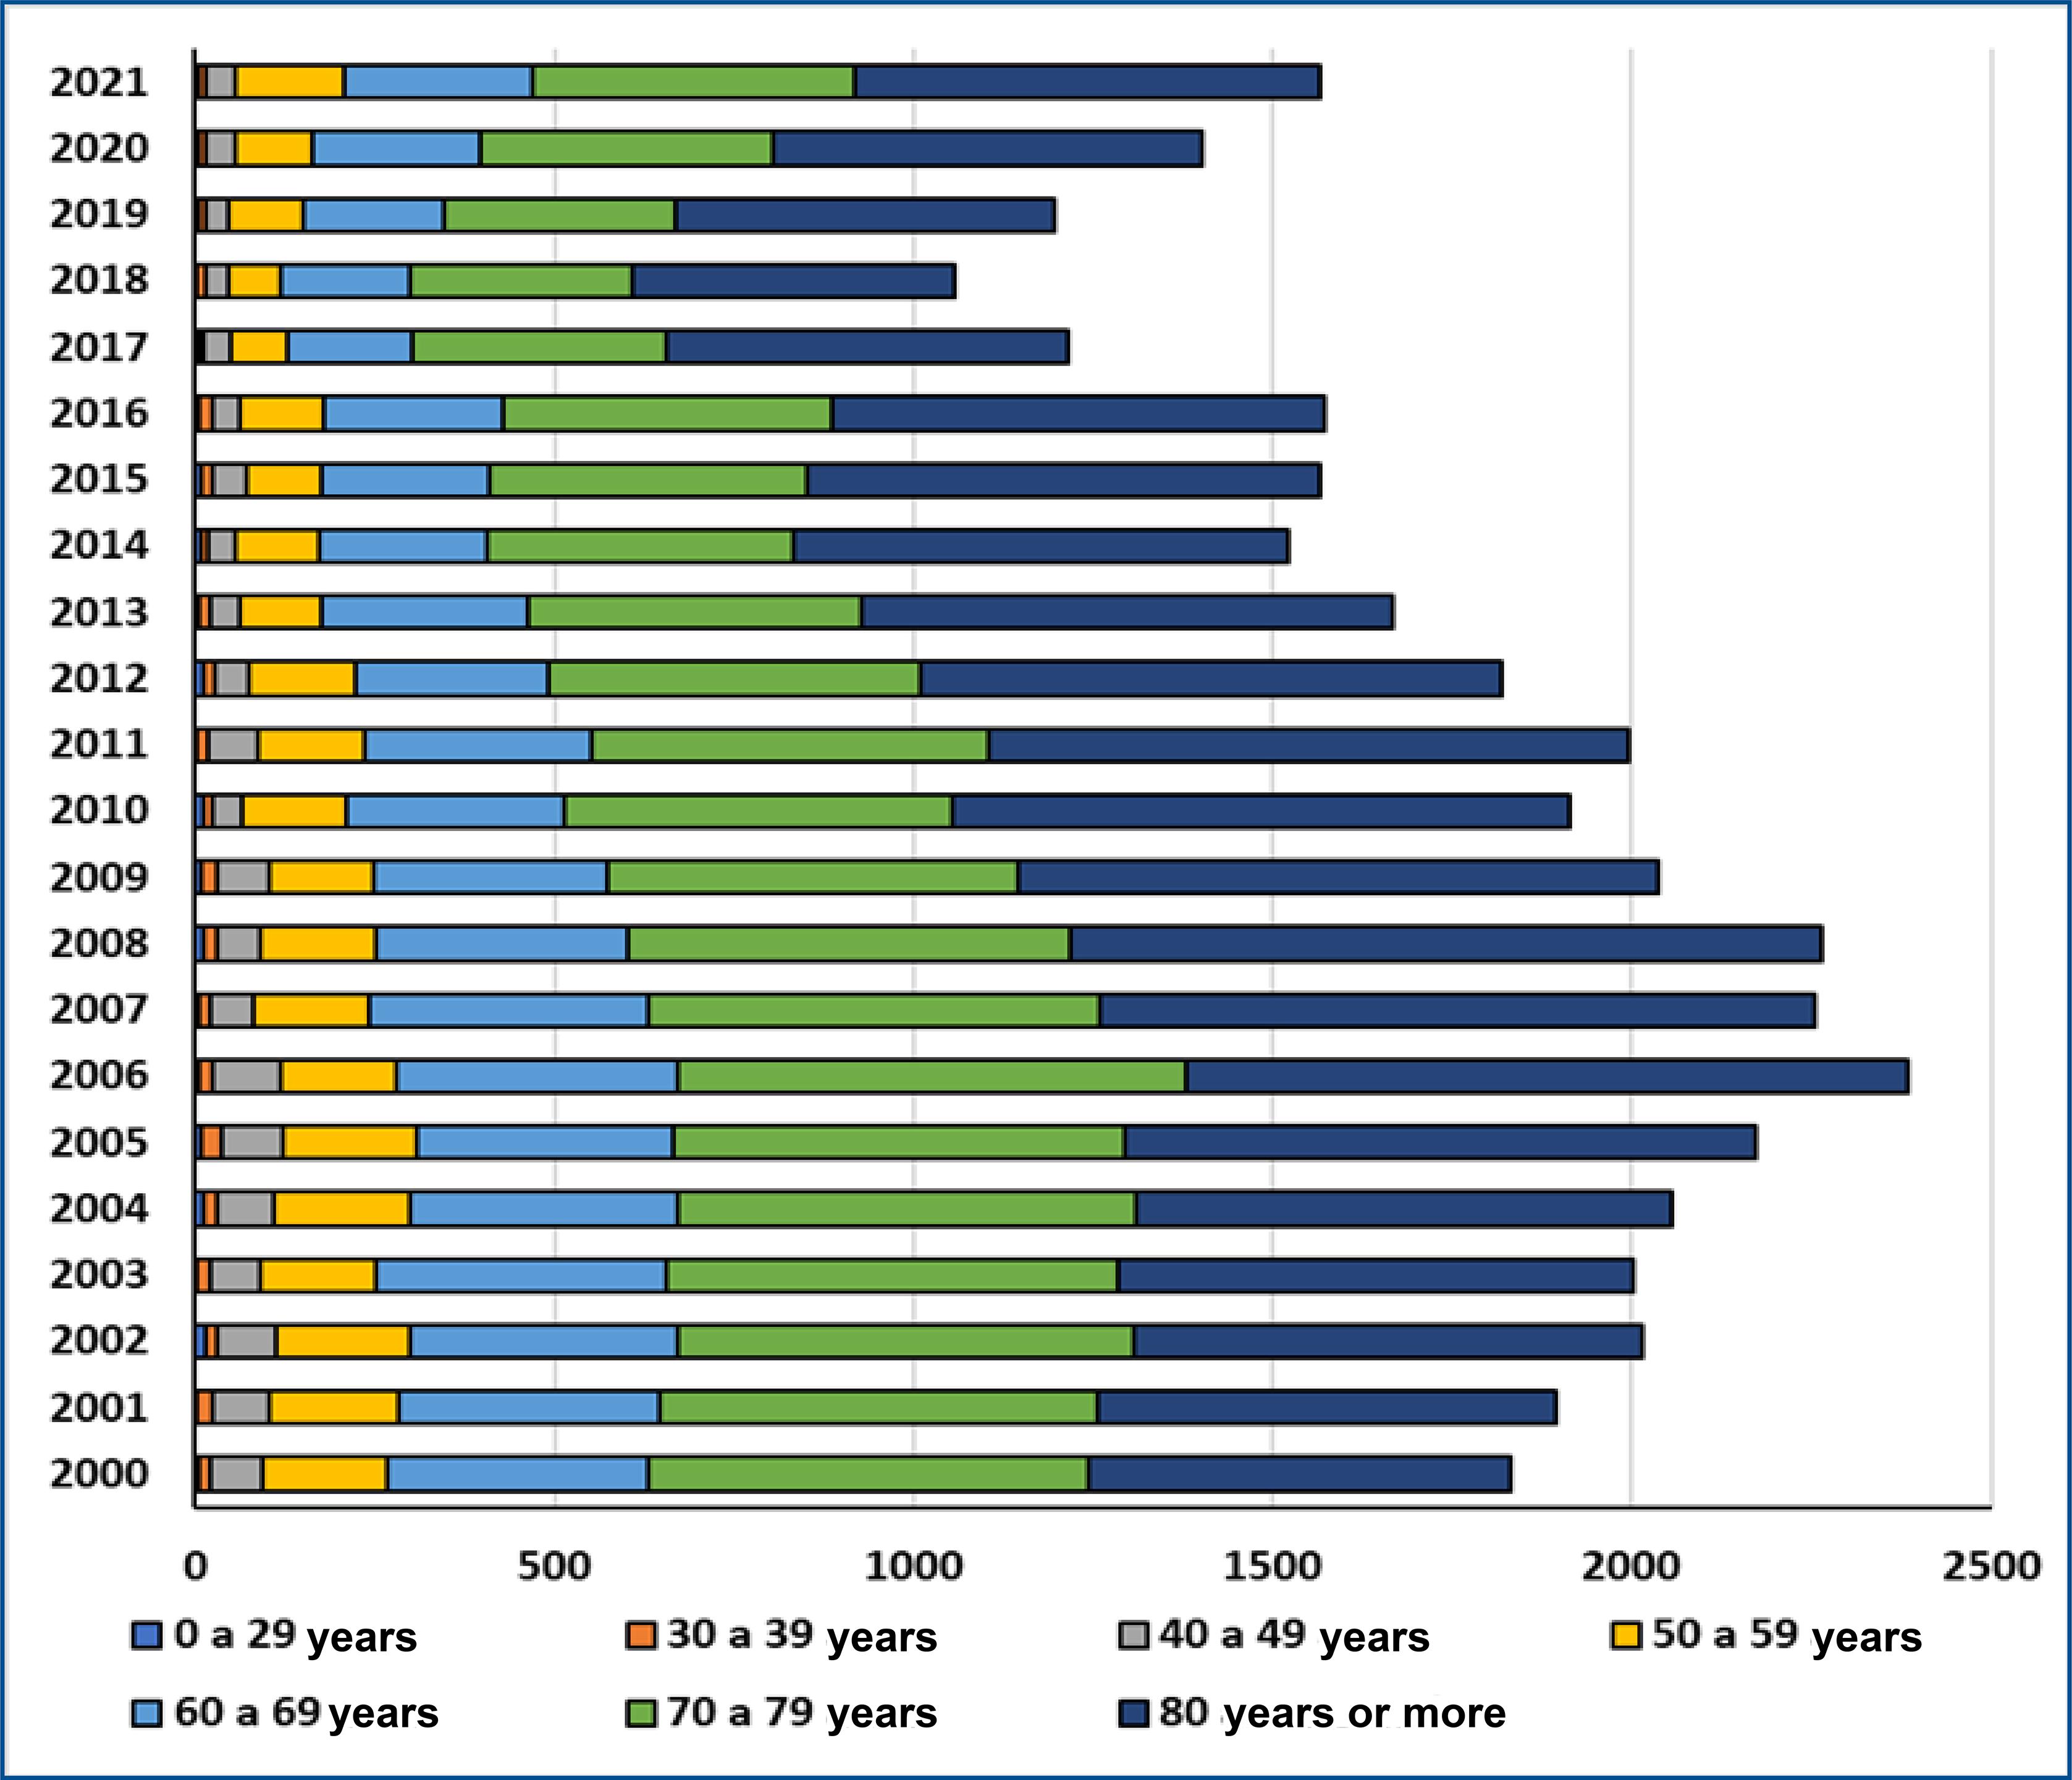
Figure1 : Number of deaths from stroke stratified by age group in the population of the state of Pernambuco, Brazil, 2000 and 2021.
In table 2 and figure 2 there is a demonstration of the annual percentage change and the average annual percentage change in the stroke mortality rate by sex and age. In the period from 2000 to 2021 there was a decline in the AAPC of -1.5 in the mortality rate for stroke in the total group and in females (p=0.056).
Table 2 : Annual percentage variation and average annual percentage variation in the mortality rate of stroke disease by sex and age group in the population of the state of Pernambuco, Brazil, between 2000 and 2021
| Segment | VPA (IC95%) | P | VPMA (IC95%) | P | |
|---|---|---|---|---|---|
| All | |||||
| 2000-2021 | -1.5 (-3.0; 0.0) | 0.056 | |||
| 2000-2006 | 3.2 (1.5; 5.0) | 0.002 | |||
| 2006-2015 | -5.0 9-6.0; -3.9) | <0.001 | |||
| 2015-2018 | -12.5 (-20.8; -3.2) | 0.014 | |||
| 2018-2021 | 12.5 (7.0; 18.3) | <0.001 | |||
| Sex | |||||
| Masculine | |||||
| 2000-2021 | -1.4 (-3.6; 0.8) | 0.217 | |||
| 2000-2007 | 2.2 (-0.8; 5.3) | 0.136 | |||
| 2007-2019 | -6.4 (-7.8; -5.0) | <0.001 | |||
| 2019-2021 | 18.8 (-4.7; 48.2) | 0.116 | |||
| Feminine | |||||
| 2000-2021 | -1.5 (-3.0; 0.0) | 0.056 | |||
| 2000-2006 | 4.0 (2.2; 5.7) | <0.001 | |||
| 2006-2015 | -5.2 (-6.2; -4.1) | <0.001 | |||
| 2015-2018 | -12.0 (-20.3; -2.7) | 0.017 | |||
| 2018-2021 | 11.0 (5.6; 16.7) | 0.001 | |||
| Age range | |||||
| 0 to 29 years old | |||||
| 2000-2021 | -0.9 (-4.8; 3.2) | 0.656 | -0.9 (-4.8; 3.2) | 0.656 | |
| 30 to 39 years old | |||||
| 2000-2021 | -5.3 (-7.0; -3.5) | <0.001 | -5.3 (-7.0; -3.5) | <0.001 | |
| 40 to 49 years old | |||||
| 2000-2021 | -6.8 (-8.0; -5.6) | <0.001 | -6.8 (-8.0; -5.6) | <0.001 | |
| 50 to 59 years old | |||||
| 2000-2021 | -4.1 (-6.5; -1.6) | 0.001 | |||
| 2000-2012 | -5.1 (-6.6; -3.5) | <0.001 | |||
| 2012-2018 | -12.1 (-17.3; -6.6) | <0.001 | |||
| 2018-2021 | 19.2 (4.0; 36.5) | 0.015 | |||
| 60 to 69 years old | |||||
| 2000-2021 | -4.4 (-6.2; -2.6) | <0.001 | |||
| 2000-2007 | -2.1 (-4.9; 0.8) | 0.148 | |||
| 2007-2018 | -9.0 (-10.6; -7.5) | <0.001 | |||
| 2018-2021 | 8.7 (-2.7; 21.3) | 0.129 | |||
| 70 to 79 years old | |||||
| 2000-2021 | -3.9 (-5.8; -1.9) | <0.001 | |||
| 2000-2006 | 0.5 (-2.7; 3.9) | 0.731 | |||
| 2006-2019 | -8.2 (-9.3; -7.1) | <0.001 | |||
| 2019-2021 | 13.5 (-6.8; 38.2) | 0.189 | |||
| 80 years or more | |||||
| 2000-2021 | -2.6 (-4.9; -0.2) | 0.031 | |||
| 2000-2006 | 5.2 (2.5; 8.0) | 0.001 | |||
| 2006-2015 | -6.0 (-7.6; -4.4) | <0.001 | |||
| 2015-2018 | -15.7 (-27.8; -1.4) | 0.035 | |||
| 2018-2021 | 7.1 (-1.0; 15.7) | 0.080 |
VPA: Annual percentage variation; VPMA: average annual percentage change. p-value < 0.05*.
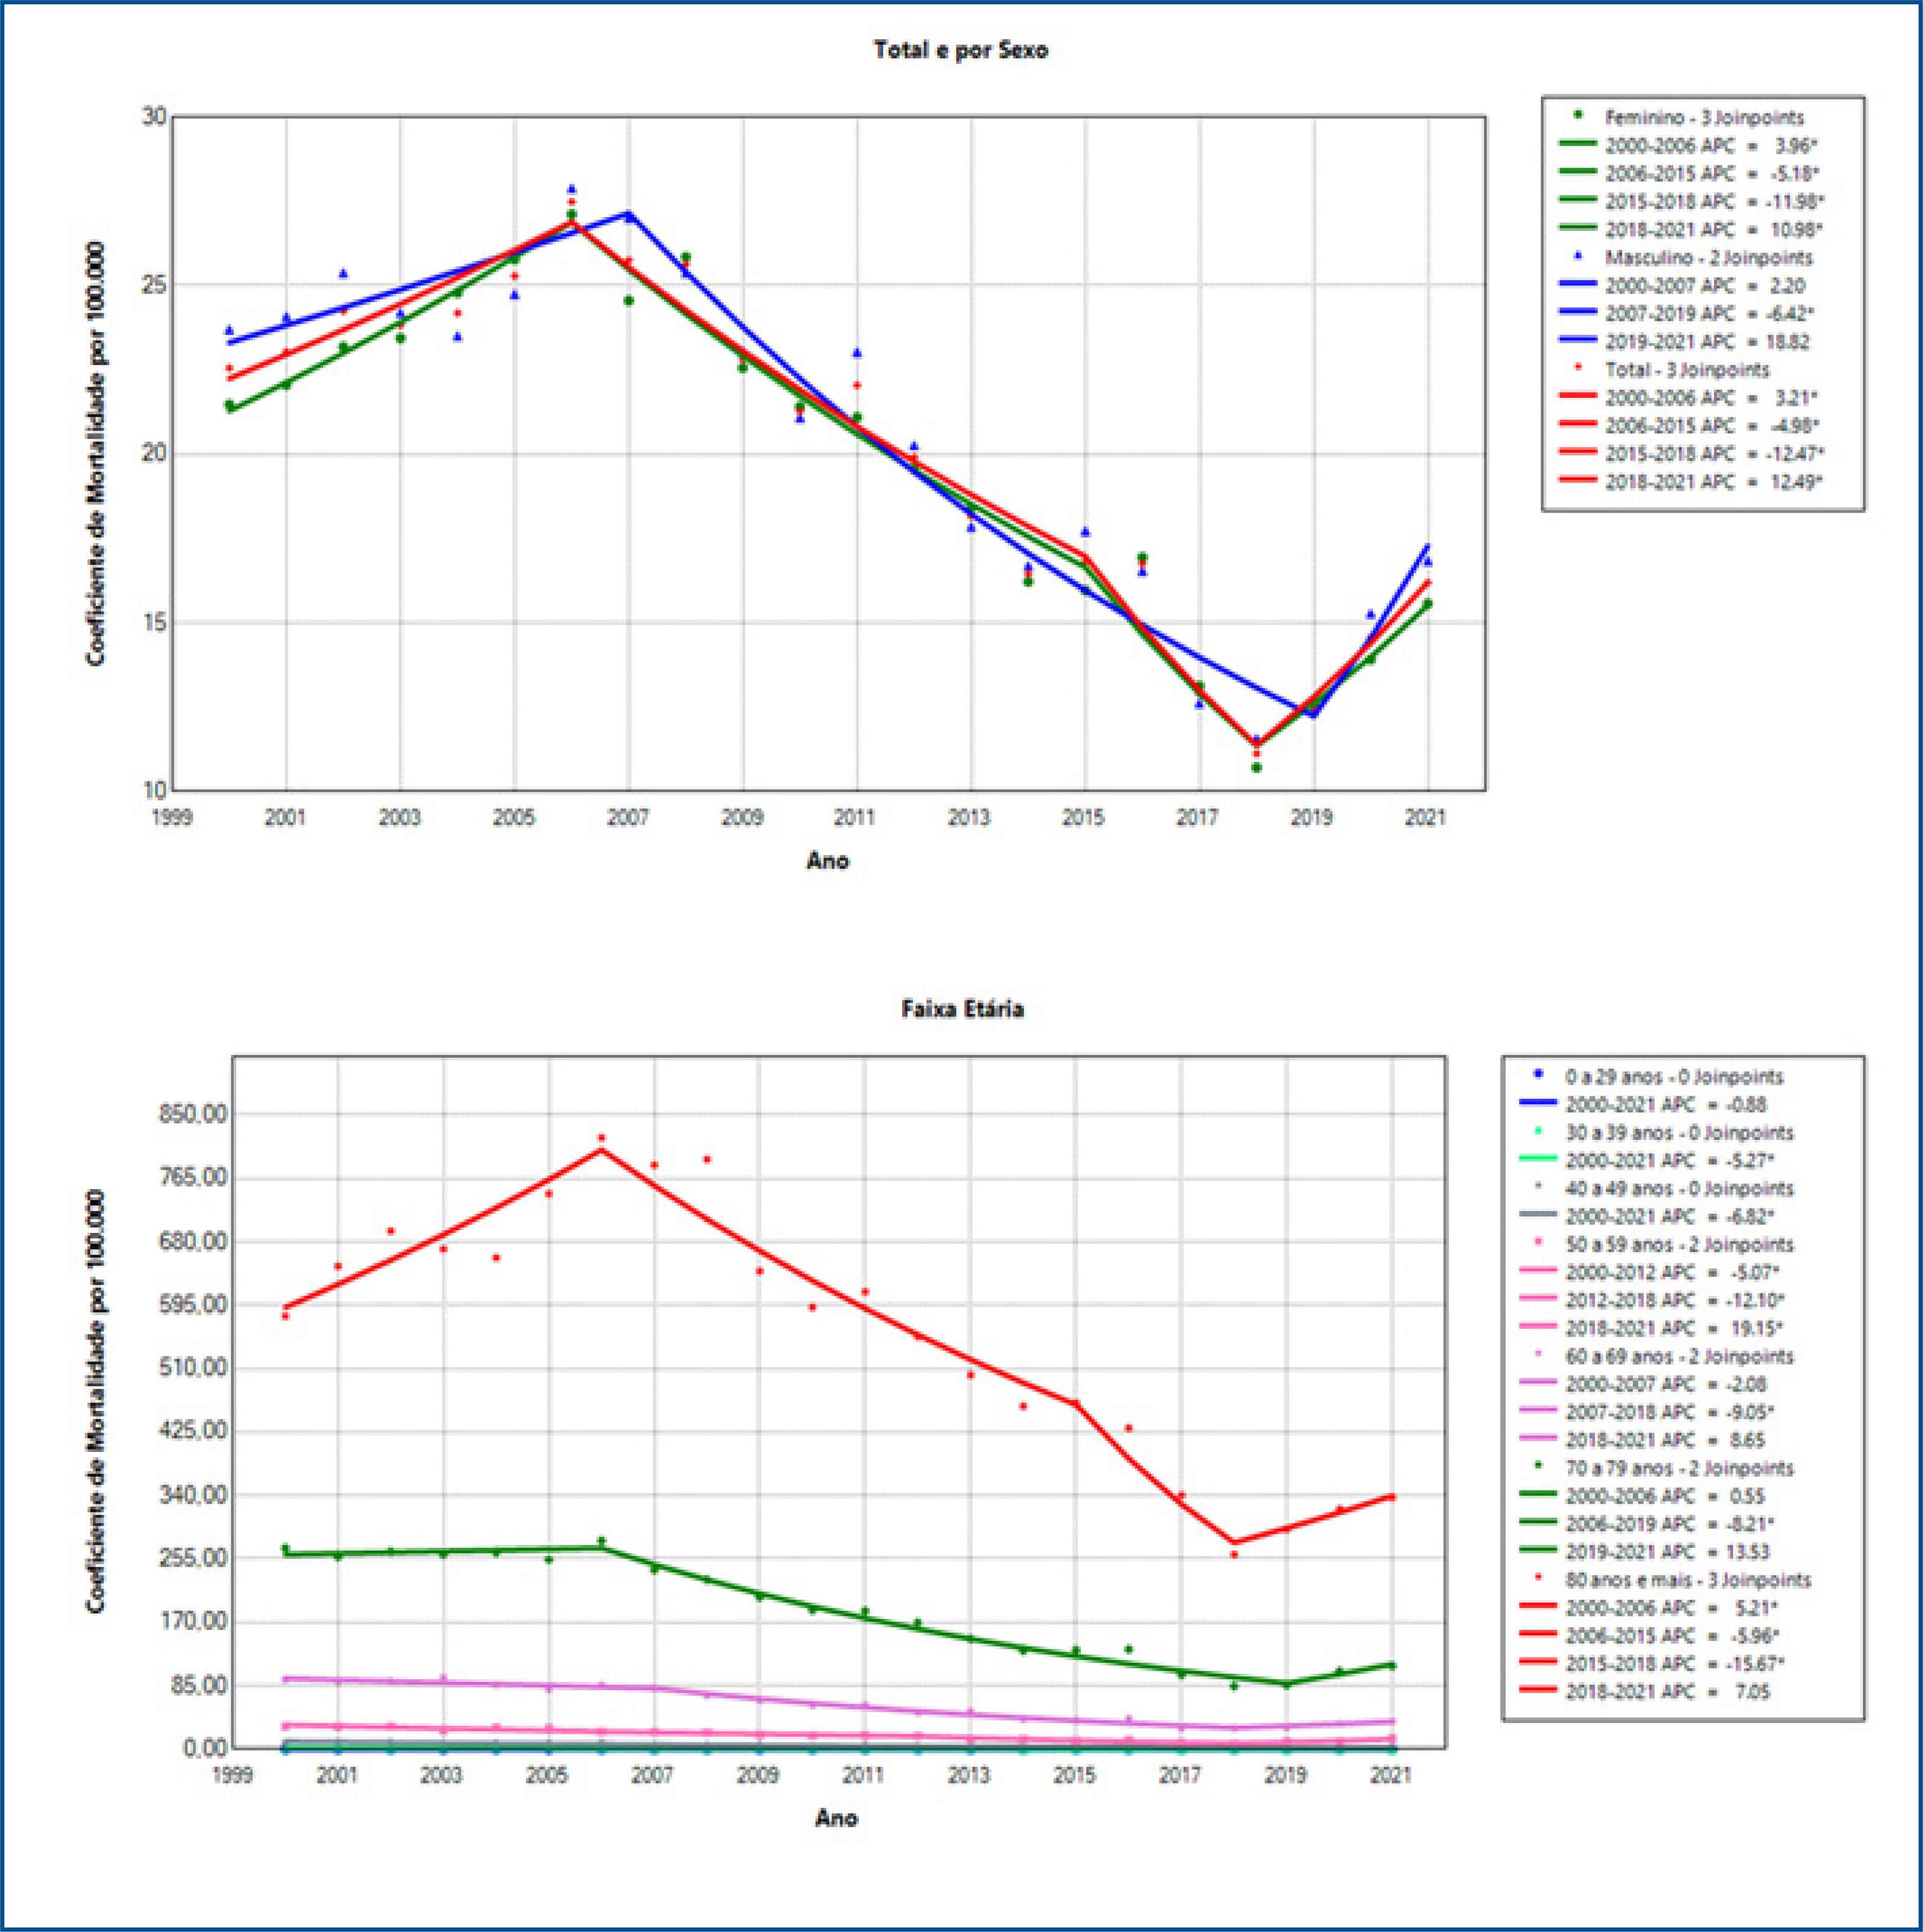
Figure 2 : Annual percentage variation in the stroke mortality rate by sex and age group in the population of the state of Pernambuco, Brazil, 2000 and 2021.
The male sex showed stability in the mortality rate during the period studied, except for those aged zero to 29 years. The total group had four segments of annual percentage change (table 2).
Between 2000 and 2006, an increase in the APC of 3.2 (p=0.002) in the mortality rate was identified. In the segments from 2006 to 2015 and from 2015 to 2018, there were declines in the APC of the mortality rate of -5.0 (p<0.001) and -12.5 (p=0.018), respectively. Subsequently, there was an increase in the mortality rate (APV: 12.5; p<0.001) (table 2).
Females showed segments in similar periods to the total group, with an increase in the mortality rate between 2000 and 2006, declines from 2006 to 2018 and a subsequent increase until 2021. Males had a decline only in the segment between 2007 and 2019 (APC: -6.4; p<0.001) (table 2).
With the exception of the age group between 0 and 29 years, there was a downward trend (p<0.05) in the mortality rate in age groups over 30 years. The age groups from 30 to 39 years and from 40 to 49 years had a segment with a declining trend (p<0.001) in the mortality rate between 2000 and 2021. In the age group from 50 to 59 years, the APC showed a decline (p< 0.001) in the segments from 2000 to 2012 and from 2012 to 2018, with a subsequent increase (p<0.014) from 2018 to 2021 (figure 2).
In the age groups from 60 to 69 years old and from 70 to 79 years old there was a segment with a decline in APC, from 2007 to 2018 with -9.0 (p<0.001) and from 2006 to 2019 with -8.2 (p< 0.001), respectively. In the age group of 80 years or more in APC there was an increase (p<0.001) in the segment from 2000 to 2006, with a subsequent decline (p<0.05) in the segments from 2006 to 2015 and from 2015 to 2018 and followed by a stable segment until 2021 (figure 2).
Table 3 and figure 3 present the annual percentage change and the average annual percentage change in proportional mortality from stroke by sex and age group in the population of the state of Pernambuco, Brazil, between 2000 and 2021. In the period from 2000 to 2021 there was a decline in AAPC of -2.9 (p<0.001) in proportional mortality for stroke in the total group. Likewise, males and females showed a decline in proportional mortality in AAPC of -2.6 (p=0.001) and -3.2 (<0.001), respectively.
Table 3 : Annual percentage variation and average annual percentage variation in proportional mortality from stroke disease by sex and age group in the population of the state of Pernambuco, between 2000 and 2021
| Segment | VPA (IC95%) | P | VPMA (IC95%) | P | |
|---|---|---|---|---|---|
| All | |||||
| 2000-2021 | -2.9 (-4.5; -1.4) | <0.001 | |||
| 2000-2008 | 2.1 (0.1; 4.2) | 0.043 | |||
| 2008-2018 | -8.3 (-9.9; -6.8) | <0.001 | |||
| 2018-2021 | 2.5 (-6.6; 12.4) | 0.579 | |||
| Sex | |||||
| Masculine | |||||
| 2000-2021 | -2.6 (-4.2; -1.1) | 0.001 | |||
| 2000-2008 | 2.5 (0.4; 4.6) | 0.022 | |||
| 2008-2018 | -8.1 (-9.7; -6.5) | <0.001 | |||
| 2018-2021 | 3.1 (-6.1; 13.2) | 0.497 | |||
| Feminine | |||||
| 2000-2021 | -3.2 (-4.1; -2.4) | <0.001 | |||
| 2000-2007 | 3.9 (2.5; 5.4) | <0.001 | |||
| 2007-2018 | -8.1 (-8.9; -7.4) | <0.001 | |||
| 2018-2021 | -0.9 (-6.0; 4.4) | 0.702 | |||
| Age range | |||||
| 0 to 29 years old | |||||
| 2000-2021 | 1.4 (-2.7; 5.7) | 0.479 | 1.4 (-2.7; 5.7) | 0.479 | |
| 30 to 39 years old | |||||
| 2000-2021 | -4.0 (-5.9; -2.1) | <0.001 | -4.0 (-5.9; -2.1) | <0.001 | |
| 40 to 49 years old | |||||
| 2000-2021 | -5.8 (-6.9; -4.7) | <0.001 | -5.8 (-6.9; -4.7) | <0.001 | |
| 50 to 59 years old | |||||
| 2000-2021 | -4.1 (-6.3; -1.9) | <0.001 | |||
| 2000-2011 | -3.2 (-4.8; -1.5) | 0.001 | |||
| 2011-2018 | -10.5 (-14.2; -6.6) | <0.001 | |||
| 2018-2021 | 8.4 (-4.5; 22.9) | 0.194 | |||
| 60 to 69 years old | |||||
| 2000-2021 | -4.6 (-6.1; -3.0) | <0.001 | |||
| 2000-2007 | -0.0 (-2.6; 2.6) | 0.971 | |||
| 2007-2018 | -8.6 (-10.0; -7.2) | <0.001 | |||
| 2018-2021 | 0.2 (-9.0; 10.4) | 0.957 | |||
| 70 to 79 years old | |||||
| 2000-2021 | -4.0 (-5.5; -2.6) | <0.001 | |||
| 2000-2007 | 1.1 (-0.8; 3.1) | 0.244 | |||
| 2007-2019 | -8.2 (-9.1; -7.3) | <0.001 | |||
| 2019-2021 | 4.0 (-10.0; 20.3) | 0.569 | |||
| 80 years or more | |||||
| 2000-2021 | -3.0 (-4.3; -1.6) | <0.001 | |||
| 2000-2007 | 6.3 (4.0; 8.6) | <0.001 | |||
| 2007-2018 | -9.1 (-10.3; -8.0) | <0.001 | |||
| 2018-2021 | -0.0 (-7.8; 8.3) | 0.991 |
VPA: Annual percentage variation; VPMA: average annual percentage change
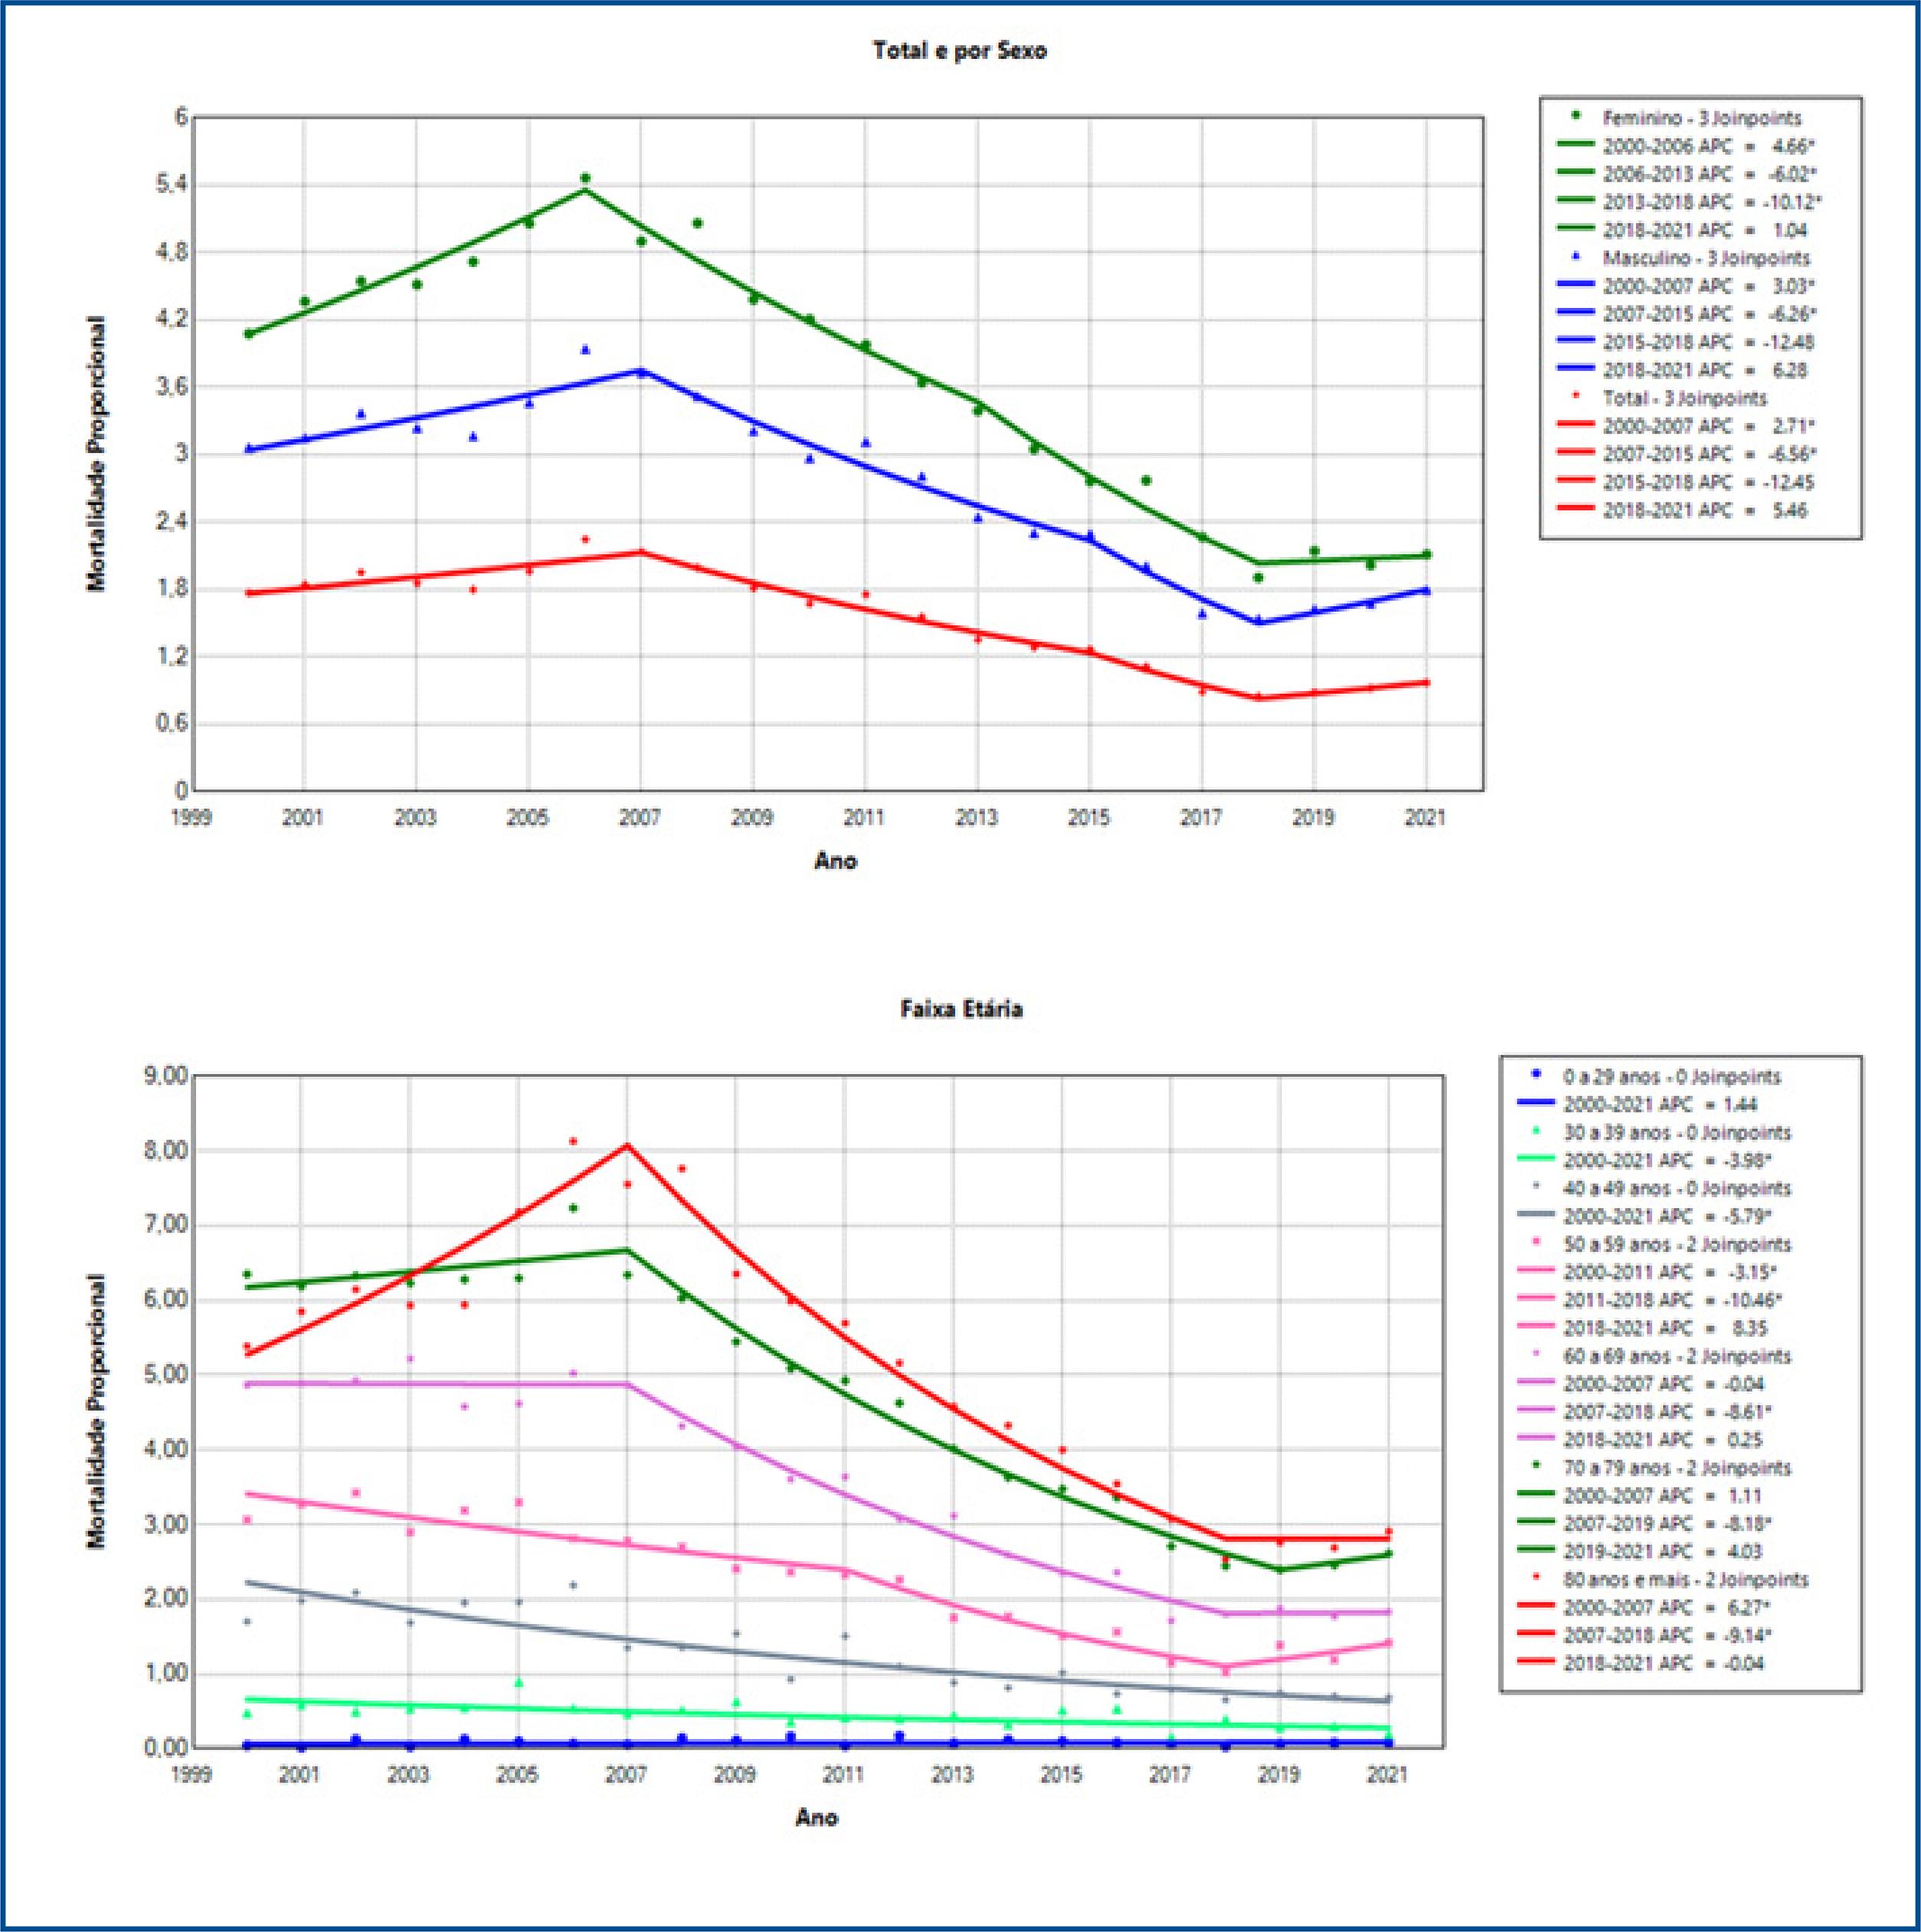
Figure 3 : Annual percentage variation in the stroke mortality rate by sex and age group in the population of the state of Pernambuco, Brazil, 2000 and 2021.
The total group and the male and female sexes had 3 segments in the annual percentage change in proportional mortality. Similarly, the total group and males and females showed an increase (p<0.05) in the first segment, a decline (p<0.001) in the segment and stability in the third segment (figure 3).
With the exception of the range between 0 and 29 years old, there was a downward trend (p<0.001) in the AAPC of proportional mortality in the age groups over 30 years old. The age groups of 30 to 39 years and 40 to 49 years had a segment with a declining trend (p<0.001) in the APC of proportional mortality between 2000 and 2021. In the age group of 50 to 59 years the APC had a decline (p <0.001) in the segments from 2000 to 2011 and from 2011 to 2018, with a subsequent segment revealing stability until 2021 (p>0.05) (table 3).
In the age groups of 60 to 69 years and 70 to 79 years there was a segment with a decline, from 2007 to 2018 (APC: -8.6; p<0.001) and from 2007 to 2019 (APC: -8.2; p<0.001). In the age group of 80 years or more in APC there was an increase (p<0.001) in the segment from 2000 to 2007, with a subsequent decline (p<0.001) in the segment from 2007 to 2018 and a stable segment between 2018 and 2021 (p>0. 05) (table 3).
DISCUSSION
In the period from 2000 to 2021, there was a greater number of deaths from stroke in women compared to men in the population of Pernambuco, Brazil. There was a tendency for stroke to decline in both the mortality rate and proportional mortality. In most years analyzed, men had a higher mortality rate. However, women showed higher proportional mortality throughout the studied period. In the period from 2018 to 2021 there was a progressive increase in the mortality rate and proportional mortality from stroke.
Between the years 2000 and 2021, there were fluctuations in the absolute number of stroke fatalities in the state of Pernambuco. A total of 39,410 deaths were recorded, with 20,107 occurring among females and 19,295 among males, as indicated in table 1. Furthermore, the average number of deaths among females was higher than the average among males.
Still in table 1, we observe that the years 2006, 2007 and 2008 recorded the highest numbers of deaths from stroke, while in 2018 there was the lowest number. There was a continuous increase in the number of deaths from stroke from 2018 to 2021. In general, males had higher mortality rates, except in the years 2004, 2005, 2008, 2010, 2013, 2016, 2017 and 2019.
Since 2018, there has been a progressive increase in mortality rates for both sexes. Proportional mortality was consistently higher in females throughout the period studied, with 2006 presenting the highest values for both sexes and 2018 the lowest. The progressive increase in proportional mortality began in 2020 for the total and female population, and in 2018 for males.
In all the years analyzed, the age group with the highest number of deaths from stroke was 80 years or more. The years 2006, 2007 and 2008 recorded the highest numbers of deaths in this age group. In 2018, the lowest number of deaths from stroke occurred in individuals between 0 and 29 years old, as shown in figure 1.
In the figure and table 2, a decline in the AAPC of the mortality rate for stroke was identified in the total population and in females. When segmented by periods, from 2000 to 2006, there was an increase in the mortality rate, in the periods from 2006 to 2015 and from 2015 to 2018, there were declines. Subsequently, an increase in the mortality rate was observed.
Females showed similar patterns to the total group, with an increase in the mortality rate between 2000 and 2006, followed by declines between 2006 to 2015 and 2015 to 2018, and an increase until 2021. In contrast, males registered a decline only in the period between 2007 and 2019.
Still in table 2, there was a downward trend in the average annual mortality rate in all age groups over 30 years old. The 30-39 and 40-49 age groups registered a declining trend throughout the period. In individuals between 50 and 59 years old, there was a decline from 2000 to 2018, followed by an increase until 2021. In the age groups from 60 to 69 years old and from 70 to 79 years old, there was a decline from 2007 to 2018 and from 2006 to 2019, respectively . In the group aged 80 and over, there was an increase from 2000 to 2006, followed by a decline from 2006 to 2018 and stability until 2021.
In table 3 and figure 3, a decline in the AAPC of proportional mortality due to stroke was found throughout the entire period. This decline was also observed in males and females. Both the total group and the male and female sexes presented three segments in the annual percentage change in proportional mortality. They exhibited similar patterns, with an increase in the first segment, a decline in the second, and stability in the third segment.
Except for the age group 0 to 29 years, there was a downward trend in VMPA in proportional mortality in all age groups. The age groups of 30 to 39 years and 40 to 49 years of age showed a decline in proportional mortality from 2000 to 2021. In individuals between 50 and 59 years of age, there was a decline from 2000 to 2018, followed by stability until 2021. In the age groups of 60 to 69 years old and from 70 to 79 years old, there was a decline from 2007 to 2018. Finally, in the age group of 80 years old and over, there was an increase from 2000 to 2007, followed by a decline between 2007 and 2018 and a stable period in 2018 to 2021.
The number of deaths from stroke varied throughout the studied period, which indicates a complex dynamic, suggesting that different factors can influence the incidence of deaths from stroke , such as obesity, arterial hypertension, genetic predisposition, atheromatous disease, atrial fibrillation , use of oral contraceptives and auricular myxoma33.
In agreement with the findings of this research, a study that analyzed the trend in stroke mortality rates throughout Brazil between 2000 and 2009 identified a greater increase in the number of mortality rates in female individuals34. Furthermore, in Rondônia, a state in the north of Brazil, 52.1% of hospitalizations for stroke were caused by female patients35.
The study by De Carvalho et al. (2011)36included an epidemiological analysis of stroke in Brazil, demonstrating a higher incidence in females (51.8%) in a group of 2,407 patients. Similar to what was found by Pinheiro and Gomes (2012)37, who observed a higher death rate among females.
Therefore, it is possible that the disparity in the number of deaths resulting from stroke between the sexes may vary according to the different research locations. This geographic variation can be influenced by a series of factors, such as access to health services, specific demographic characteristics of each region, prevalent lifestyle habits and the quality of medical care systems. Therefore, it is essential to explore and understand regional differences to develop effective and personalized approaches to stroke prevention and management34.
In 2019, a study showed that Brazil recorded a total of 73,920 deaths resulting from ischemic stroke. An increase in the prevalence of this type of stroke was observed in accordance with advancing age38. The number of deaths related to cerebrovascular diseases is higher in the elderly age group, especially after 65 years of age39, corroborating the findings of this study.
In general terms, cerebrovascular diseases can manifest themselves in any age group; however, the risk increases after age 60, doubling with each subsequent decade40. Furthermore, the occurrence of stroke increases significantly with advancing age. After reaching the age of 55, the risk of suffering a stroke doubles with each subsequent decade41.
Older individuals have higher incidences and significant adverse outcomes, showing a higher mortality rate in both the acute and long-term phases, influenced by the degree of severity of the disease, cardiovascular profile, sociodemographic aspects and previous functional disability42. In this way, age emerges as one of the main non-modifiable risk factors43.
Therefore, it is important to highlight that stroke risk factors increase around the age of 60 and from this point onwards, they double every ten years40.
The decline in the stroke mortality rate was also identified by Garritano et al. (2012)34, who reported a downward trend in the mortality rate from this condition between 2000 and 2009 throughout Brazil. Furthermore, in 2000 and 2005, an ecological study carried out with data from the population of the Federal District showed a tendency towards a decrease in mortality rates37.
The reasons that may justify the reduction in the mortality rate due to stroke are related to the incidence and lethality of the disease, with risk factors such as hypertension, diabetes and obesity determining the incidence, in addition to the effectiveness of the treatment. The control of risk factors, the prevention of circulatory diseases and socioeconomic improvements contribute to the reduction in mortality. High-tech procedures, greater availability of diagnostic equipment and quick care also help. However, in Brazil, regional inequality and scarcity of health resources limit access to these procedures in some locations34.
In the findings of Lutufo (2019)44, a reduction in the mortality rate from stroke was observed, according to the Joinpoint regression method. In both sexes, mortality rates showed significant declines between 1990 and 2017. These findings are in agreement with the results described in table 2, however for men and in the period from 2000 to 2007 and 2019 to 2021 this outcome was not maintained. epidemiological.
In scientific literature, many studies oppose the finding that the female population has more deaths from stroke. The results of an epidemiological study of stroke in Brazil showed that the absolute number of fatalities among males was higher34.
The findings found by Santos, Luquini and Fagundes (2020)45, which detailed the epidemiological parameters of deaths resulting from cerebrovascular diseases in the state of Paraná, in the southern region of Brazil, during the period from 2008 to 2018, revealed a greater number of deaths in male individuals. Furthermore, similar results were found by the Brazilian Society of Cerebrovascular Diseases46, by De Almeida and Vianna (2018)47 and Carvalho et al. (2019)48.
Recent research indicates that stroke is no longer considered a disease of elderly people, since young adults are more vulnerable to chronic diseases according to the standard of living adopted49-51. In recent decades, there has been an increase in the incidence of stroke in adults under 45 years of age52, however, this age group has better prognoses53.
Among the risk factors that are highly relevant in the younger population are smoking, immunological diseases, use of oral contraceptives, migraines, hypertension, diabetes, atherosclerosis, consumption of illicit drugs, pregnancy and the postpartum period54.
Thus, statistical analyzes indicate a significant increase in stroke cases in young adults over the last few decades. This scenario places this condition as the main one among the diseases that result most in deaths and disabilities in individuals of working age, thus becoming a pressing public health issue49.
In relation to the mortality rate, between 2018 and 2021, an average annual increase was identified. A study carried out in the municipalities of Paraná and Maringá analyzed the trend of deaths due to stroke in the municipalities between 2005 and 2015. The results showed that the trend in general mortality was constant, however, the increasing trend was found only in males54.
Despite presenting an unequal distribution, current mortality rates in Brazil are still high. The burden of stroke mortality in the main Brazilian cities is significantly higher than that observed in the United States, Canada and Western European countries, and is at levels similar to those in Eastern Europe and Japan. In relation to other Latin American countries, Brazil it also records the highest rates for both men and women. Even after a drop in all age groups, mortality rates among adults and middle-aged people in Brazil still exceed those observed among elderly people in developed countries55-57.
The study findings reveal significant variations throughout the analyzed period, showing temporal changes in the proportions of deaths attributed to stroke in the state of Pernambuco. These variations highlight a general trend of decreasing disease-related mortality rates over time. This finding suggests that preventive measures and public health interventions implemented over the years may be contributing to the improvement of health outcomes related to stroke in the region.
As it is a secondary database study, the results should be used to form hypotheses for new research. However, the study has several strengths and demonstrates its significant importance. The use of a time series analysis method provides a robust approach to examining the temporal variations of health indicators over the period, which allows identifying possible changes in trends over time, providing important information to understand the evolution of stroke mortality in the population of the state of Pernambuco, Brazil.
Furthermore, the use of data from DATASUS allows a broad and representative analysis of the epidemiological situation in the state of Pernambuco, northeastern Brazil. By focusing specifically on Pernambuco, the study offers relevant data for the planning and implementation of targeted health policies aimed at preventing and controlling stroke in that Brazilian state.
Understanding the trend and factors associated with stroke is essential to guide effective public health interventions. Therefore, this study not only contributes to scientific knowledge about the epidemiology of stroke in Pernambuco, but also offers fundamental support for the formulation of health policies and programs aimed at preventing and managing this serious health condition in the population.
Furthermore, it is noteworthy that DATASUS provides information that can serve to support objective analyzes of the health situation, evidence-based decision making and the development of health action programs, just as the research on stroke was carried out.
Measuring the population’s health status is a tradition in public health, allowing a better understanding of the concept of health and its population determinants and the analysis of the Brazilian health situation.
CONCLUSION
In the period from 2000 to 2021, there was a greater number of deaths from stroke in women in contrast to men in the population of Pernambuco, Brazil. There was a tendency for stroke to decline in both the mortality rate and proportional mortality. In most years analyzed, men had a higher mortality rate. However, women showed higher proportional mortality. In the period from 2018 to 2021 there was a progressive increase in the mortality rate and proportional mortality from stroke. At ages zero to 29 years there was no decline in the mortality rate and proportional mortality due to stroke.

