


 texto em
  Inglês (pdf)
 Artigo em XML
 Referências do artigo

 Permalink
INTRODUCTION
Stroke is characterized as a neurological deficit attributed to an acute focal injury of the central nervous system, of vascular cause, including cerebral infarction, subarachnoid hemorrhage and intracerebral hemorrhage 1. Together with ischemic heart disease, they represent the leading causes of death and disability around the world 2, 3. In 2019, around 6.55 million lives were claimed by stroke worldwide 4, 5.
Official data from the World Health Organization in 2019 6 and the Brazilian Ministry of Health in 2016 7revealed that cerebrovascular diseases were the second most significant cause of death in the country, with around 107 thousand deaths in 20228, being surpassed only by ischemic heart disease. Similar findings are observed in the state of Pará, where cerebrovascular diseases were responsible for more than 3 thousand deaths in 20228, demonstrating that such pathologies present themselves as a serious public health problem.
Recent research has shown a global time trend of decline in mortality rates from ischemic and hemorrhagic stroke in recent years8-12. Part of this advance can be explained by improved outpatient and hospital care and progress in understanding and treating modifiable risk factors5,13,14. Despite this, considering individual life expectancy and the fact that stroke is one of the main causes of morbidity and mortality, incidence and mortality rates remain high, causing social and economic impact, given the high number of hospitalizations, deaths, sequelae, and years of potential life lost5,15,16.
Although stroke mortality rates have reduced in several countries around the world, little information is published in countries and locations with less socioeconomic development and less technological capacity 15. Temporal studies carried out on the total Brazilian population12 and in the states of the south and southeast regions, with better socioeconomic development 17, showed similar downward trends. However, in the states of the northeast region with lower development rates, the same findings were not found 18, suggesting that socioeconomic differences and access to health services could influence the epidemiology of stroke.
The State of Pará is located in the northern region of Brazil. It is the most populous in the region but has one of the lowest human development indexes in the country 19. Epidemiological studies in the state are scarce20. Still, it is necessary to understand the trend in stroke mortality and plan strategies to mitigate the impact based on local, current, and concrete evidence. In a survey carried out by Rezende et al., between 2016 and 2020 on the epidemiological profile of patients hospitalized for stroke in the capital of the state of Pará, a predominance of males above 60 years was observed, but with a tendency to decrease the number of hospitalizations and deaths throughout the time series 20.
Therefore, this study aims to analyze the trend in mortality due to stroke in the adult population of the state of Pará between 2000 and 2021.
METHODS
Design
This epidemiological study uses an ecological design with sequential time series based on secondary data from the adult population of Pará, Brazil, between 2000 and 202121.
Location and population studied.
Information on the number of deaths and demographic data were obtained for the state of Pará, located in the northern region of Brazil, Brazilian Legal Amazônia. The state has a demographic density of 6.51 inhabitants/km2 and a human development index of 0.69 [19]. The studied population consisted of adult residents of both sexes aged over 20, separated by age groups for the calendar years between 2000 and 2021.
Data source and extraction
Study data were collected from public and official sources from the Brazilian Ministry of Health. The number of deaths by sex and age group in the period from 2000 to 2021 were extracted from the database of the Department of Informatics of the Unified Health System - DATASUS ( https://datasus.saude.gov.br/informacoes-de -saude-tabnet/ ). Information on population counts was extracted from the DATASUS database (https://datasus.saude.gov.br/populacao-residente ) by sex and age group for the period between 2000 and 2021. Exclusions were carried out for data registered as ‘ignored’ for sex and age group. Two trained researchers carried out data extraction. In case of any discrepant results, corrections were made by consensus between both parties.
Study variable
The study variable was stroke as the primary cause of death occurring in adult residents of the state of Pará. Stroke was constituted by codes I60 (subarachnoid hemorrhage), I61 (intracerebral hemorrhage), I63 (cerebral infarction), and I64 (not specified as ischemic or hemorrhagic), according to the International Classification of Diseases version 10 (ICD-10)22. The stroke variable was extracted for the population over 20 years of age and stratified by sex (male and female) and age groups (20 - 29 years, 30 - 39 years, 40 - 49 years, 50 - 59 years, 60 - 69 years, 70 - 79 years and 80 years and over) for calendar years between 2000 and 2021.
Data analysis
Information on the number of deaths from stroke, deaths from all causes and population, with stratification by sex and age group, was extracted using the file transfer system from the DATASUS database to a file in separate values format by comma or Comma-Separate-Values (CSV).
The crude mortality rate was calculated by dividing the number of adult deaths due to stroke by the total adult population or stratified by sex and age group and the division quotient was multiplied by 100 thousand inhabitants. The mortality rate ratio between the sexes was calculated by dividing the male mortality rate by the female mortality rate 23.
Years of potential life lost
The years of potential life lost were determined by the number of deaths multiplied by the value of the difference between the central age of the age group and life expectancy at birth, as published by the Brazilian Institute of Geography and Statistics (IBGE)24. The years of potential life lost per 100,000 inhabitants were calculated by the years of potential life lost divided by the population quantity in each age group, and the quotient was multiplied by 100,000. For each year between 2000 and 2021, the mortality rate due to stroke, mortality rate ratio between sexes, years of potential life lost, and years of potential life lost per 100,000 inhabitants were calculated in a Microsoft Office Excel spreadsheet23.
Joinpoint regression model
The time trend in the mortality rate, years of potential life lost, and years of potential life lost per 100,000 inhabitants due to stroke was evaluated by joinpoint regression, with the help of the Joinpoint Regression Program (version 5.0.2, 2023) developed by the National Cancer Institute, Rockville, MD, USA25. Joinpoint regression models were applied to identify change points in the time series and the trend of each segment of the mortality coefficient, years of potential life lost, and years of potential life lost per 100,000 inhabitants from 2000 to 2021.
The models were analyzed for the population and stratified by sex and age group. In each model, the dependent variable was the mortality coefficient or the years of potential life lost or years of potential life lost per 100,000 inhabitants. The independent variable was the year. The options of heteroscedastic errors with constant variation, the maximum number of 4 joinpoints, and the log-linear model were chosen to analyze the models. The Bayesian Information Criterion method (BIC) was applied to the model selection. The annual percentage change (APC) and the average annual percentage change (AAPC) with 95% confidence intervals estimated by the parametric method indicated the direction and magnitude of time trends. When there was no segment trend in the period, the APC was similar to the AAPC. Joinpoint regression models with a p-value equal to or less than 5% are considered an annual change.
RESULTS
Between the years 2000 and 2021, the total reported number of deaths from stroke in the adult population of the state of Pará was 49.259. There were five records excluded from the gender variable because they were recorded as ignored. The absolute number of deaths increased progressively in the period from 2000 to 2016, with slight fluctuations after that but remaining at high levels. The crude mortality coefficient, comparing the years 2000 and 2021, revealed an increase from 44.36 to 46.06 per 100,000 inhabitants with fluctuations during the time series and higher coefficients from 2006 to 2018, but mainly in the years 2008 (55. 92) and 2016 (54.19) (table 1).
Table 1 : Number of deaths and mortality rate from stroke in the adult population in the state of Para, Brazil, 2000 to 2021.
| Deaths | Mortality Coefficient* | Mortality Coefficient Ratio: Male / Female | |||||
|---|---|---|---|---|---|---|---|
| All | Male | Female | All | Male | Female | ||
| 2000 | 1423 | 714 | 709 | 44.36 | 44.14 | 44.59 | 0.99 |
| 2001 | 1477 | 745 | 732 | 44.35 | 44.37 | 44.34 | 1.00 |
| 2002 | 1498 | 797 | 701 | 43.35 | 45.75 | 40.90 | 1.12 |
| 2003 | 1657 | 845 | 812 | 46.23 | 46.79 | 45.66 | 1.02 |
| 2004 | 1612 | 867 | 745 | 43.40 | 46.36 | 40.40 | 1.15 |
| 2005 | 1687 | 881 | 805 | 43.88 | 45.54 | 42.15 | 1.08 |
| 2006 | 2014 | 1060 | 954 | 50.66 | 53.02 | 48.28 | 1.10 |
| 2007 | 2185 | 1137 | 1048 | 53.22 | 55.10 | 51.32 | 1.07 |
| 2008 | 2369 | 1214 | 1155 | 55.92 | 57.06 | 54.78 | 1.04 |
| 2009 | 2341 | 1237 | 1104 | 53.61 | 56.45 | 50.75 | 1.11 |
| 2010 | 2295 | 1215 | 1080 | 51.03 | 53.88 | 48.16 | 1.12 |
| 2011 | 2382 | 1263 | 1119 | 51.67 | 54.71 | 48.62 | 1.13 |
| 2012 | 2393 | 1248 | 1145 | 50.68 | 52.84 | 48.51 | 1.09 |
| 2013 | 2439 | 1340 | 1098 | 50.45 | 55.49 | 45.38 | 1.22 |
| 2014 | 2565 | 1379 | 1184 | 51.84 | 55.86 | 47.76 | 1.17 |
| 2015 | 2712 | 1445 | 1267 | 53.56 | 57.26 | 49.89 | 1.15 |
| 2016 | 2802 | 1529 | 1273 | 54.10 | 59.29 | 48.95 | 1.21 |
| 2017 | 2644 | 1379 | 1265 | 49.91 | 52.33 | 47.51 | 1.10 |
| 2018 | 2776 | 1449 | 1327 | 51.26 | 53.83 | 48.71 | 1.11 |
| 2019 | 2590 | 1367 | 1222 | 46.81 | 49.76 | 43.87 | 1.13 |
| 2020 | 2746 | 1491 | 1255 | 48.62 | 53.22 | 44.10 | 1.21 |
| 2021 | 2652 | 1431 | 1221 | 46.06 | 50.14 | 42.04 | 1.19 |
Source: DATASUS database. Ministry of Health. Brazil. * Mortality coefficient per 100.000 inhabitants.
The absolute number of deaths from stroke between 2000 and 2021 revealed that males were more affected (26,033) compared to females (23,221). Mortality coefficients by sex also showed the same findings, except in 2000, when females were more affected (44.59) than males (44.14). In the last year studied, men had a mortality rate of 50.14 and women 42.04 per 100,000 inhabitants. The male/female mortality coefficient ratio in 2021 was 1.19, demonstrating that men had 19% more deaths compared to women (table 1).
Mortality stratified by age group is presented in Table 2. Between 2000 and 2021, there was a gradual increase in the total number of deaths with advancing age. During this period, 536 deaths were identified in the 20 to 29 age group, 1.257 in the 30 to 39 age group, 3.300 in the 40 to 49 age group, 5.912 in the 50 to 59 age group, 9.475 in the 60 to 69 age group, 13.167 in the 70 to 79 age group and 15,612 deaths in the 80 years old and over age group. Regarding the number of years of potential life lost (YPLL) due to stroke, an increase was detected from 10.099 years in 2000 to 21.754 years in 2021. When adjusting the YPLL for the population, there was also an increase from 314.84 in the year 2000 to 377.78 years of potential life lost per 100.000 inhabitants in 2021 (table 2).
Table 2 : Number of deaths by age group and years of potential life lost due to stroke in the adult population of the state of Pará, Brazil, 2000 to 2021.
| Age Group | |||||||||
|---|---|---|---|---|---|---|---|---|---|
| 20 - 29 years old | 30 - 39 years old | 40 - 49 years old | 50 - 59 years old | 60 - 69 years old | 70 - 79 years old | 80 years and over | YPLL* | YPLL* per 100,000 | |
| 2000 | 15 | 43 | 133 | 210 | 313 | 370 | 339 | 10099 | 314.84 |
| 2001 | 21 | 60 | 136 | 203 | 312 | 363 | 382 | 11255 | 337.98 |
| 2002 | 19 | 46 | 134 | 221 | 333 | 391 | 354 | 11345 | 328.27 |
| 2003 | 25 | 59 | 159 | 241 | 331 | 440 | 402 | 13380 | 373.31 |
| 2004 | 20 | 56 | 150 | 213 | 345 | 429 | 399 | 12769 | 343.80 |
| 2005 | 19 | 51 | 117 | 237 | 363 | 441 | 459 | 12501 | 325.17 |
| 2006 | 37 | 55 | 177 | 259 | 414 | 537 | 535 | 16235 | 408.41 |
| 2007 | 28 | 61 | 178 | 269 | 454 | 573 | 622 | 16516 | 402.28 |
| 2008 | 30 | 72 | 160 | 314 | 443 | 627 | 723 | 18016 | 425.28 |
| 2009 | 27 | 58 | 130 | 310 | 426 | 648 | 742 | 16271 | 372.59 |
| 2010 | 21 | 53 | 156 | 259 | 466 | 608 | 732 | 16601 | 369.12 |
| 2011 | 26 | 54 | 137 | 290 | 458 | 640 | 777 | 17178 | 372.63 |
| 2012 | 26 | 51 | 142 | 286 | 450 | 620 | 818 | 17362 | 367.67 |
| 2013 | 29 | 63 | 149 | 285 | 502 | 607 | 804 | 18996 | 392.92 |
| 2014 | 30 | 63 | 149 | 319 | 435 | 663 | 906 | 19452 | 393.13 |
| 2015 | 25 | 55 | 156 | 271 | 507 | 751 | 947 | 19397 | 383.10 |
| 2016 | 23 | 80 | 165 | 284 | 457 | 773 | 1020 | 20833 | 402.22 |
| 2017 | 27 | 57 | 154 | 278 | 494 | 679 | 955 | 20422 | 385.50 |
| 2018 | 22 | 63 | 165 | 273 | 508 | 783 | 962 | 21378 | 394.71 |
| 2019 | 23 | 53 | 129 | 327 | 474 | 731 | 853 | 21026 | 380.00 |
| 2020 | 23 | 51 | 166 | 300 | 470 | 764 | 972 | 21957 | 388.80 |
| 2021 | 20 | 53 | 158 | 263 | 520 | 729 | 909 | 21754 | 377.78 |
Source: Prepared by the authors, 2023, from the DATASUS database. Ministry of Health. Brazil. * Years of Potential Life Lost.
When evaluating mortality coefficients per 100,000 inhabitants, according to age group, the highest coefficients are notable for the older age groups, especially after 60 years of age. In the sequential time analysis of this variable, there were periods of rise and fall, with greater emphasis on the age group of 80 years and over (figure 1). In 2008 and 2016, there were, respectively, peaks of 1.195, 81 and 1.224,70 in the age group of 80 years and over; 427,81 and 387,18 in the 70 to 79 age group; 153,43 and 115,49 in the 60 to 69 age group and progressive reduction for the other groups reaching values of 2,09 and 1,50 between 20 and 29 years.
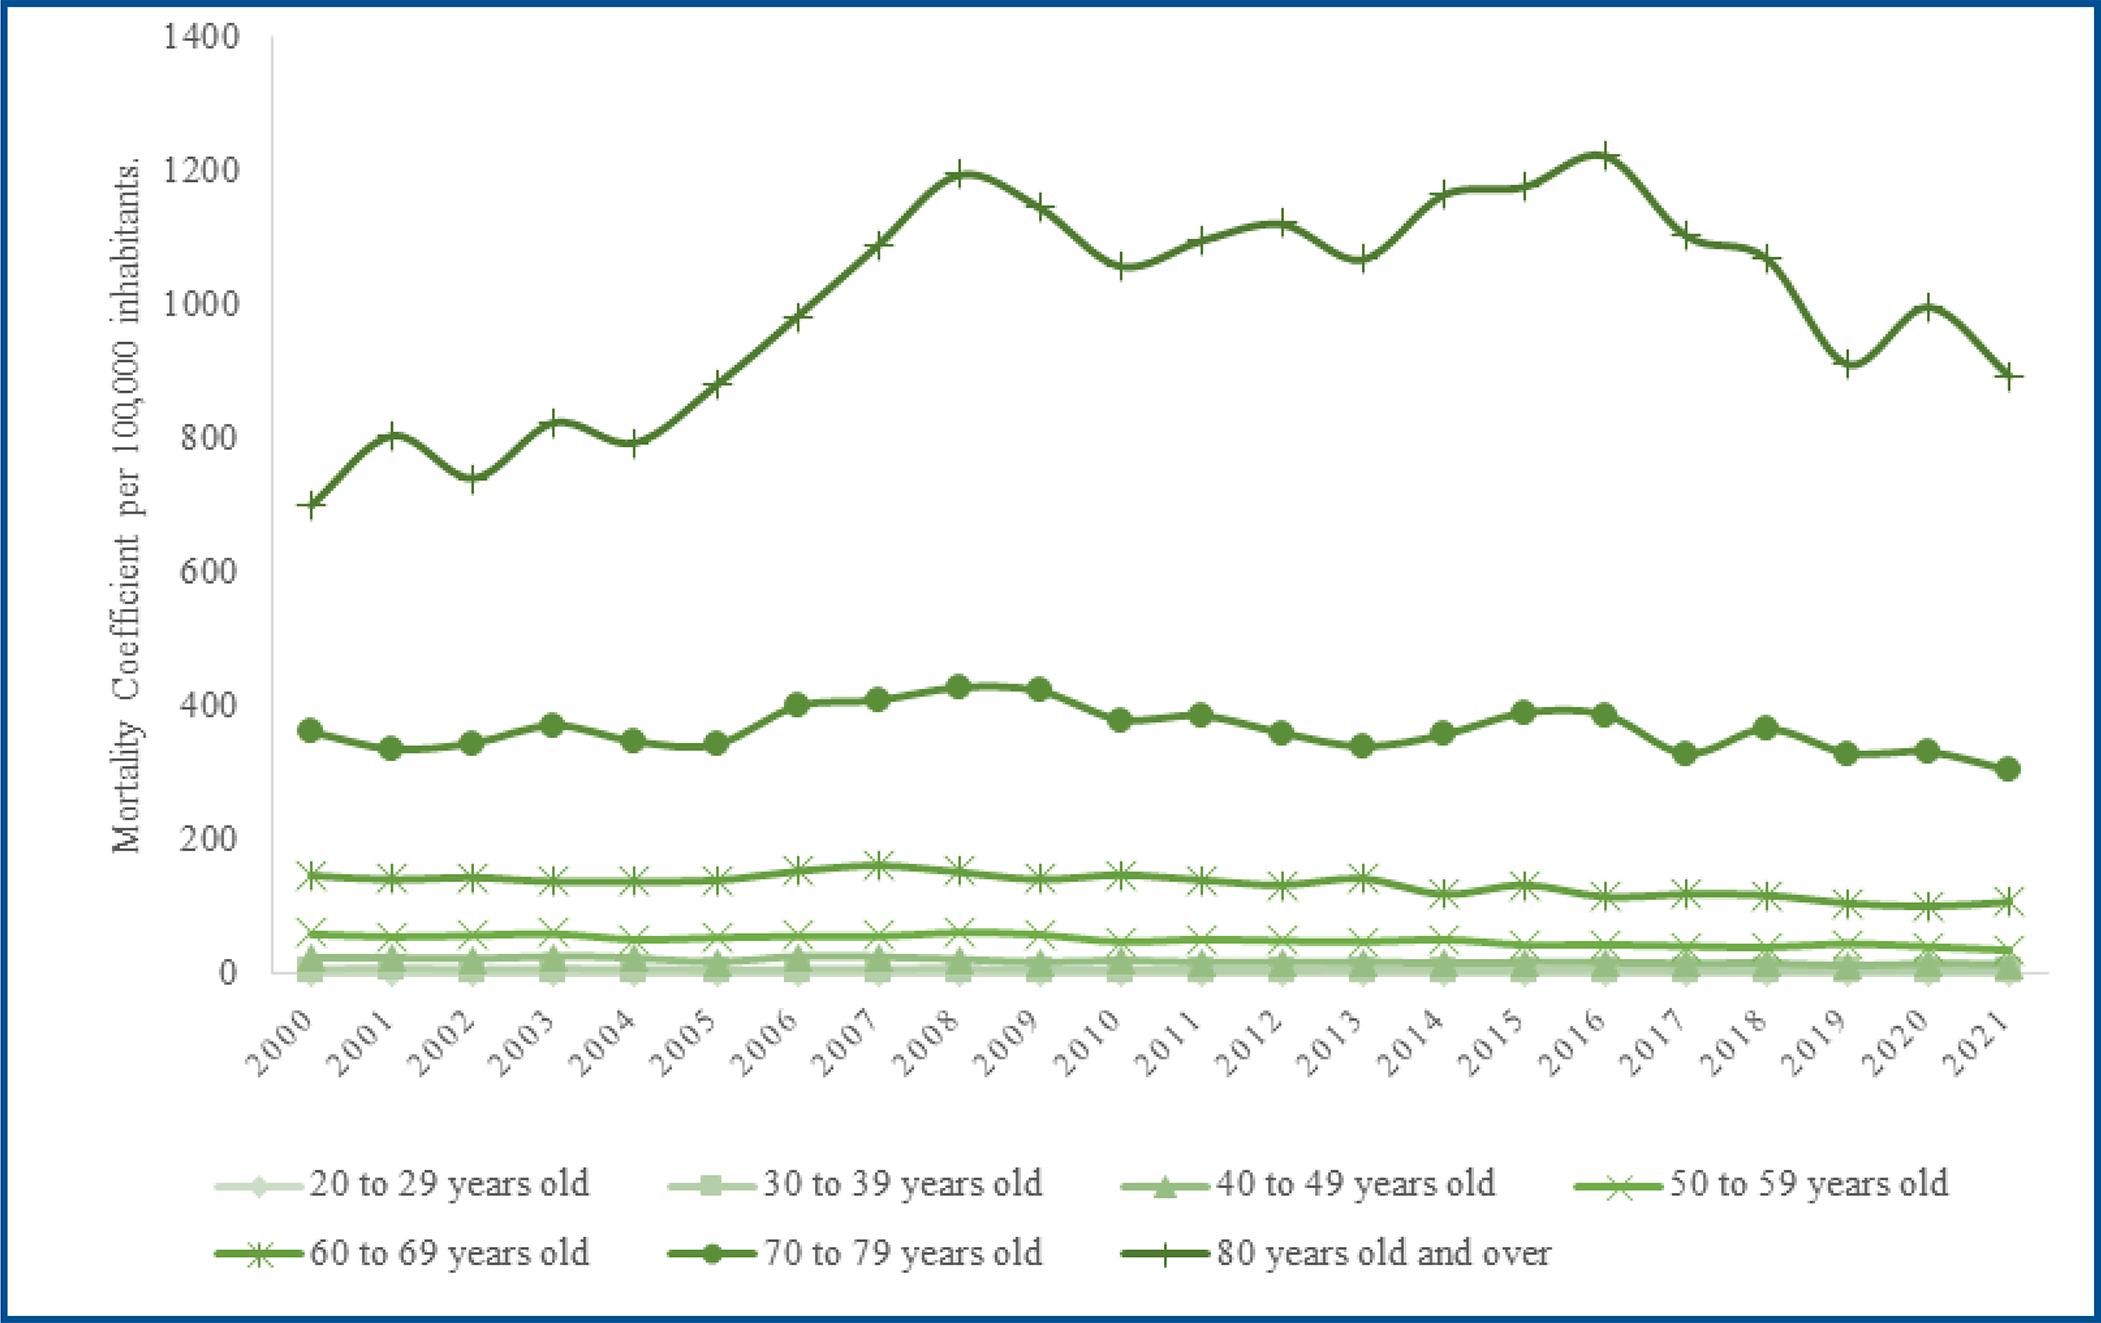
Figure 1 : Mortality coefficient due to stroke by age group in the adult population of the state of Pará, Brazil, 2000 to 2021.
The statistical analysis of the AAPC between 2000 and 2021 revealed a stationary trend of 0.4% for stroke mortality coefficients (p=0.576) in the adult population of the state of Pará. However, in the analysis of the time series, 2 joinpoints were observed (2004 and 2008), and from 2008 onwards the mortality trend was decreasing by -1.0% (CI: 95%, [- 1.6; -3.6]; p = 0.003). Regarding the sex variable between 2000 and 2021, there was an increasing trend in mortality for males of 0.9% (p=0.006) and a stationary trend of 0.1% (p=0.940) for females. One joinpoint was observed for men in 2009, when the trend was stationary at 0.7% (p=0.100), and 2 joinpoints for women, when from 2009 onwards the trend showed a decrease of -1.2 % (p=0.002) (table 3).
Table 3 : Annual percentage change and average annual percentage change in the mortality rate of stroke disease in the adult population of the state of Pará, Brazil, 2000 to 2021.
| Year | APC* (CI 95%) | p | AAPC** (CI 95%) | p | Interpretation | |
|---|---|---|---|---|---|---|
| All | ||||||
| 2000-2021 | 0.4 (-0.9; 1.6) | 0.576 | Stationary | |||
| 2000-2004 | -0.4 (-3.9; 3.3) | 0.838 | ||||
| 2004-2008 | 5.6 (-0.2; 11.8) | 0.059 | ||||
| 2008-2021 | -1.0 (-1.6; -3.6) | 0.003 | ||||
| Sex | ||||||
| Male | ||||||
| 2000-2021 | 0.9 (0.3; 1.6) | 0.006 | Increasing | |||
| 2000-2009 | 3.2 (1.8; 4.5) | <0.001 | ||||
| 2009-2021 | -0.7 (-1.5; 0.1) | 0.100 | ||||
| Female | ||||||
| 2000-2021 | -0.1 (-2.1; 2.0) | 0.940 | Stationary | |||
| 2000-2004 | -2.3 (-6.5; 2.2) | 0.286 | ||||
| 2004-2007 | 8.3 (-6.0; 24.7) | 0.247 | ||||
| 2007-2021 | -1.2 (-1.8; -0.5) | 0.002 |
*APC: Annual percentage change; **AAPC: Average annual percentage change.
When stratifying the series by age group between 2000 and 2021, mortality trends according to the average annual percentage change were decreasing from -2.3% for the 30 to 39 age group (p < 0.001), -2.8% for the 40 to 49 age group (p < 0.001), -2.1% for the 50 to 59 age group (p < 0.001) and -1.4% for the 60 to 69 age group (p < 0.001). For the other age groups, the trends were stationary in the period from 2000 to 2021, however the average percentage evaluation showed 1 joinpoint in 2006 for the age group from 20 to 29 years old (p=0.003), 1 joinpoint in 2008 for the age group from 70 to 79 years (p<0.001) and 1 joinpoint in 2016 for the age group of 80 years and over (p=0.010), from which mortality trends were equally decreasing (table 4).
Table 4 : Annual percentage change and average annual percentage change in the mortality rate of stroke disease in the adult population by age group in the state of Pará, Brazil, 2000 to 2021 .
| Year | APC* (CI 95%) | p | AAPC** (CI 95%) | p | Interpretation | |
|---|---|---|---|---|---|---|
| Age group | ||||||
| 20 – 29 age | ||||||
| 2000-2021 | -0.1 (-2.1; 1.9) | 0.911 | Stationary | |||
| 2000-2006 | 6.1 (-0.3; 13.0) | 0.062 | ||||
| 2006-2021 | -2.5 (-4.0; -1.0) | 0.003 | ||||
| 30 – 39 age | ||||||
| 2000-2021 | -2.3 (-3.2; -1.5) | <0.001 | -2.3 (-3.2; -1.5) | <0.001 | Decreasing | |
| 40 - 49 age | ||||||
| 2000-2021 | -2.8 (-3.5; -2.1) | <0.001 | -2.8 (-3.5; -2.1) | <0.001 | Decreasing | |
| 50 - 59 age | ||||||
| 2000-2021 | -2.1 (-3.1; -1.1) | <0.001 | Decreasing | |||
| 2000-2008 | -0.1 (-2.3; 2.2) | 0.960 | ||||
| 2008-2021 | -3.4 (-4.4; -2.3) | <0.001 | ||||
| 60 - 69 age | ||||||
| 2000-2021 | -1.4 (-2.2; -0.7) | <0.001 | Decreasing | |||
| 2000-2008 | 1.2 (-0.6; 2.9) | 0.170 | ||||
| 2008-2021 | -3.0 (-3.8; -2.2) | <0.001 | ||||
| 70 - 79 age | ||||||
| 2000-2021 | -0.2 (-1.1; 0.7) | 0.684 | Stationary | |||
| 2000-2008 | 2.5 (0.4; 4.6) | 0.021 | ||||
| 2008-2021 | -1.8 (-2.7; -0.8) | 0.001 | ||||
| 80 years old and over | ||||||
| 2000-2021 | 1.2 (-0.1; 2.6) | 0.065 | Stationary | |||
| 2000-2008 | 6.0 (4.0; 8.0) | <0.001 | ||||
| 2008-2016 | 0.7 (-1.5; 3.0) | 0.508 | ||||
| 2016-2021 | -5.1 (-8.7; -1.5) | 0.010 |
*APC: Annual percentage change; **AAPC: Average annual percentage change.
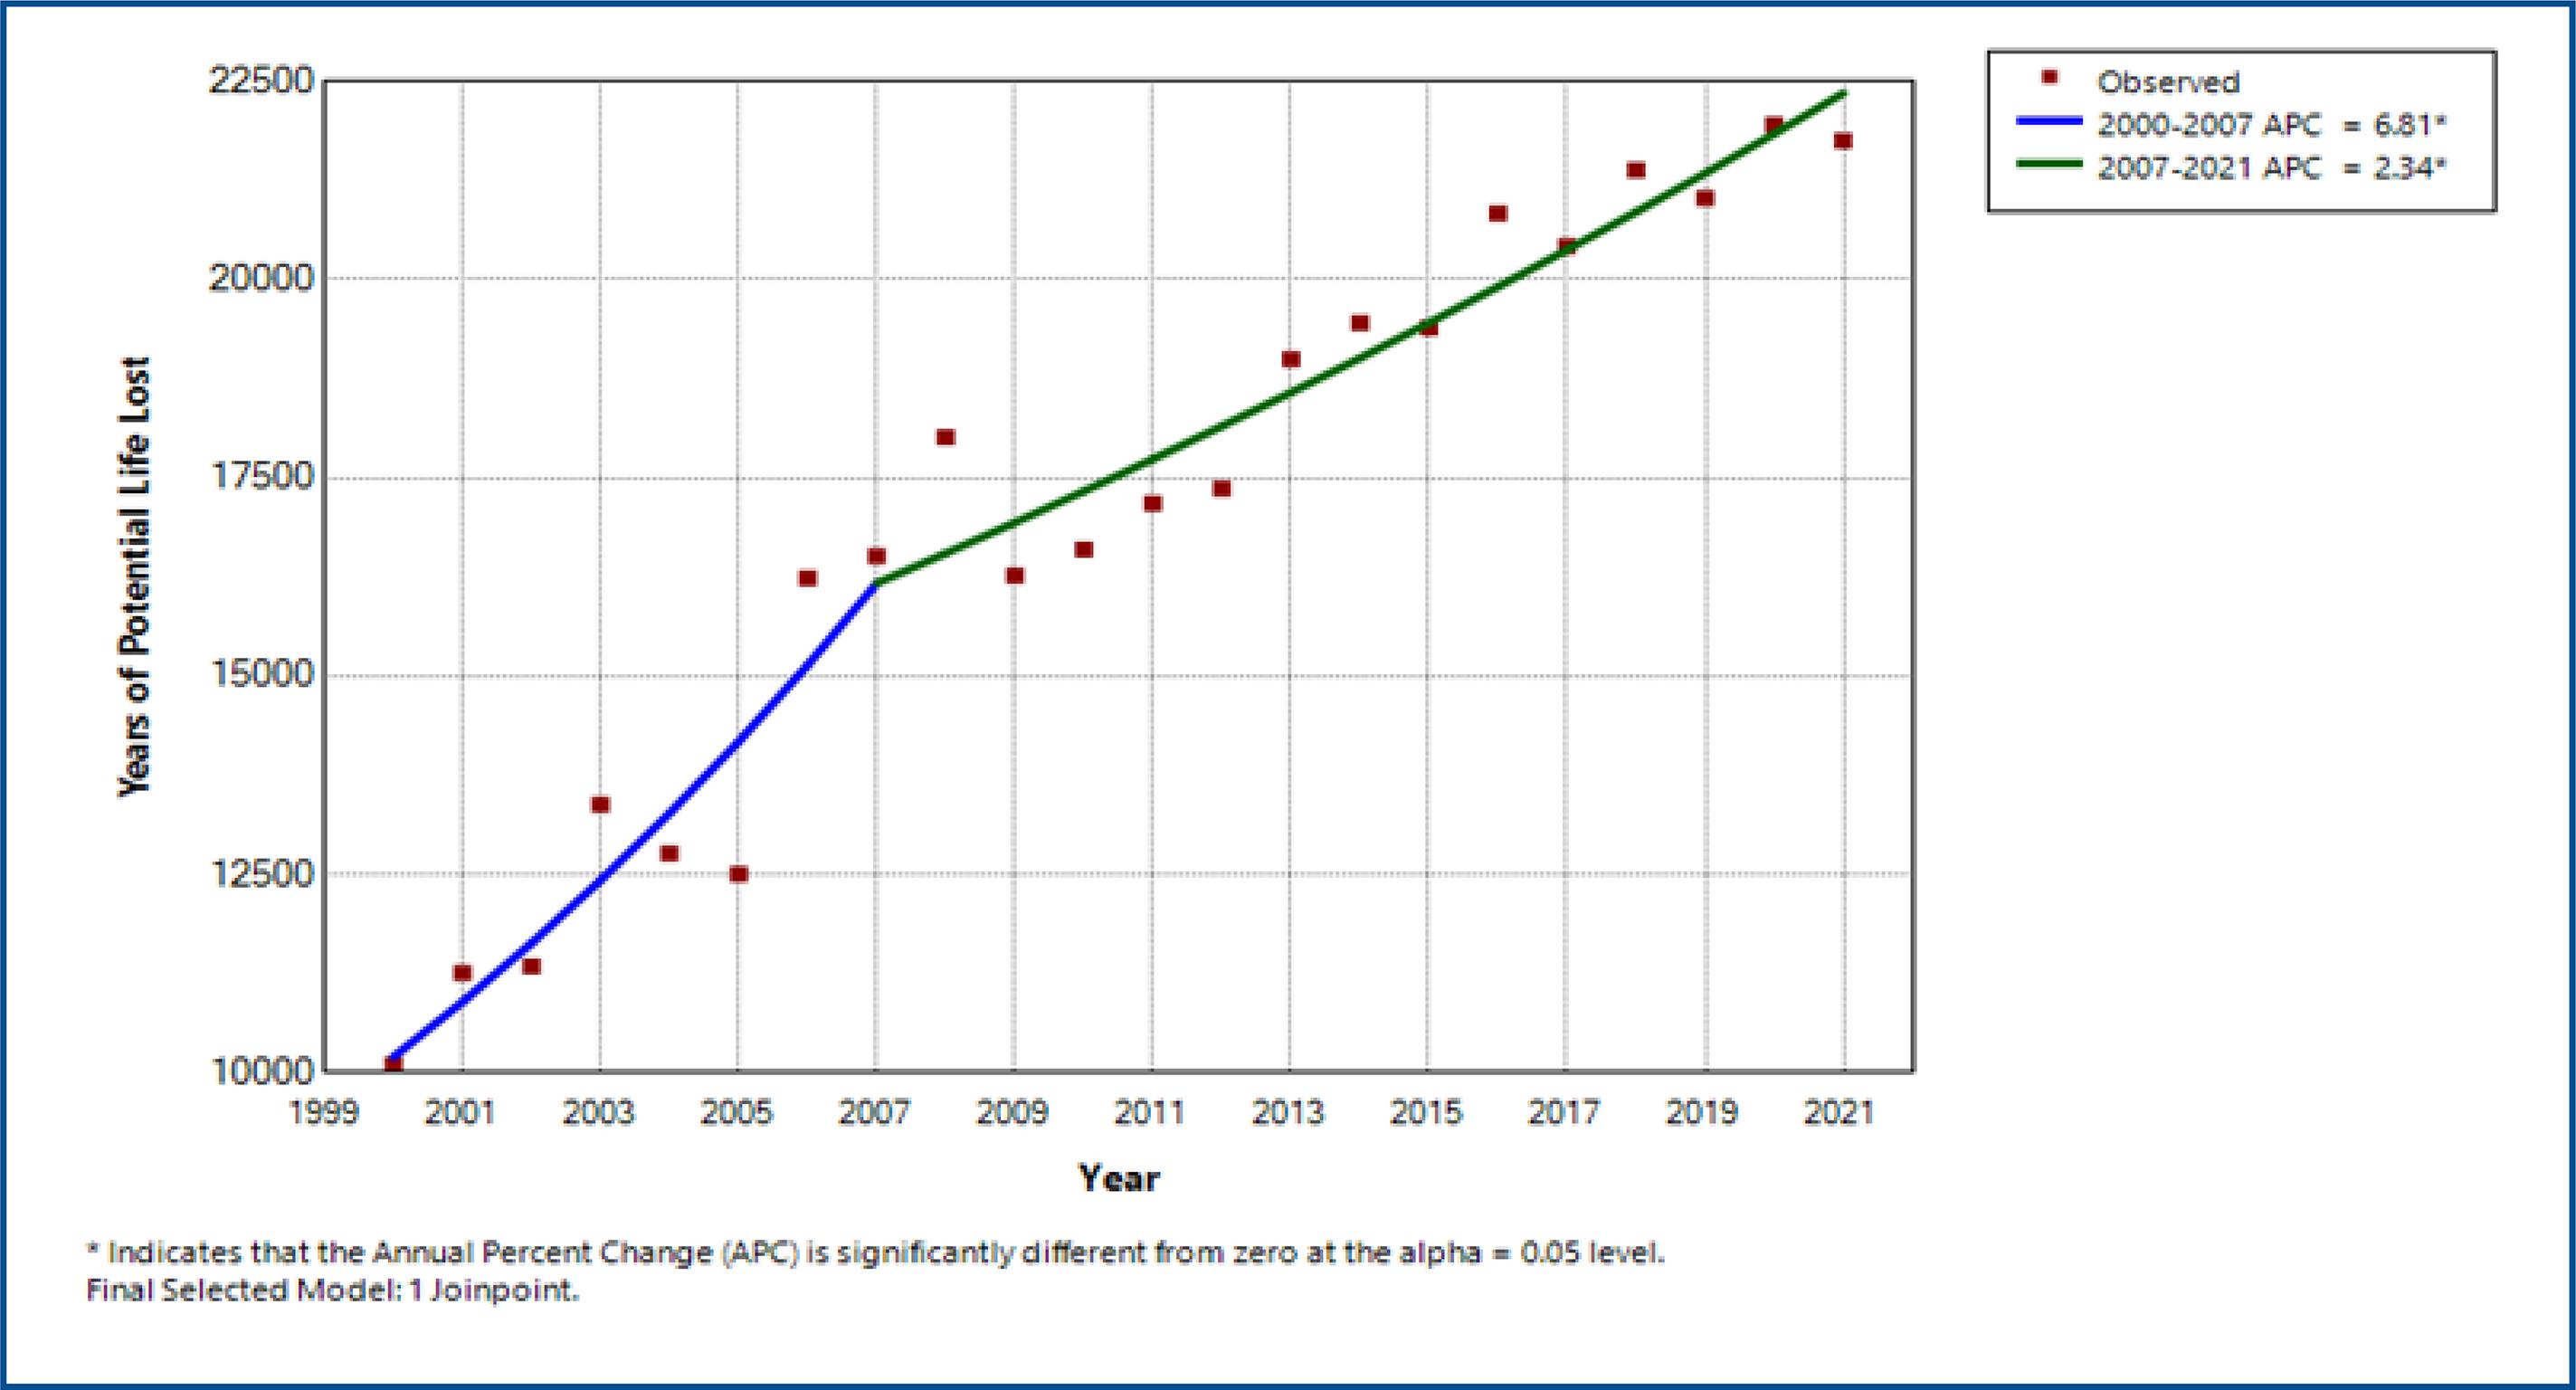
In the assessment of the years of potential life lost due to stroke, through the annual percentage change, an increasing trend of 3.8% (p<0.001) was observed in the period from 2000 to 2021. In the analysis of the time series, 2 joinpoints were highlighted with increasing trend of 6.8% (p<0.001) in the period from 2000 to 2007 and 2.3% (p<0.001) in the period from 2007 to 2021 (figure 2).
DISCUSSION
The trend in stroke mortality in the adult population of the state of Pará proved to be stationary at 0.4% between 2000 and 2021. However, the Joinpoint regression model observed a decreasing trend of -1.0% after 2008 (p=0.003). The number of deaths increased over the years of the time series, given the absolute increase from 1.432 to 2.652 deaths and the increase in the mortality coefficient from 44.36 to 46.06 per 100,000 inhabitants comparing the years 2000 and 2021. There was an increase in the number of deaths with increasing age, with the age groups 60 to 69 years old, 70 to 79 years old, and 80 years old and over being the ones with the highest coefficients.
The stratified analysis revealed a decreasing trend in mortality for the age groups of 30 to 39 years, 40 to 49 years, 50 to 59 years, and 60 to 69 years throughout the study period (p<0.001). However, when analyzing the joinpoints, equally decreasing trends were observed for the age group from 20 to 29 years old after 2006 (p=0.003), from 70 to 79 years old after 2008 (p=0.001), and from 80 years and over after 2016 (p=0.010). Males had the highest mortality rates, except in 2000. After 2007, there was a downward trend of -1.2% (p=0.002) for women; after 2009, the trend was stationary at -0.7 % (p=0.100) for men.
In recent years, there has been a downward trend in stroke mortality rates in the adult population worldwide, in both sexes, mainly in developed regions such as the 28 countries of the European Union between 1996 and 201510, and in the United States of America (USA) between 1975 and 2018 9. Moreira et al. 12 investigating the trend in stroke mortality throughout Brazil (between 2000 and 2018) and De Moraes Bernal et al. 17in developed Brazilian regions (between 2008 and 2018), also observed similar trends. The results found in this study after 2008 coincide with the downward trend for all age groups, except those aged 80 and over, which occurred after 2016.
Research indicates that decreasing trends in stroke mortality are related to better knowledge and control of risk factors 9, the development of cerebral reperfusion techniques, such as venous thrombolysis and mechanical thrombectomy 26, as well as the diffusion of units specializing in the treatment of stroke 27 However, Access to these resources is strongly related to each nation’s development level. A study of stroke mortality trends in Latin America and the Caribbean, with data extracted from 1979 to 2015 for men and women with no age limit, detected a more significant reduction in stroke mortality in high-income countries compared to middle-income countries 28.
Soto et al.10, studying the stroke mortality rate on the European continent between 1996 and 2015, detected a drop of -4.2% in the 28 countries studied; however, between 2012 and 2015, there was an increase for some countries in the northern region. These findings suggest a downward trend in stroke mortality in general, although with variations between different countries and areas of the world. Brazilian time series carried out between 2008 and 2018 confirm the same variability, with a decreasing trend of -3.48% for ischemic stroke and -3.84% for hemorrhagic stroke in more developed states 17 and an increasing trend of mortality in less developed states18. In Pará, the mortality trend was stationary in the analysis of the entire period but with a decreasing trend after 2008.
The state of Pará ranks 23rd in the human development index among the 26 states of the federation and the federal district 19. In this study, the absolute number of deaths increased with the years of the time series and with age (tables 1 and 2). Considering the large territorial extensions and the difficulties in accessing health services for monitoring risk factors and acute treatment of stroke, it is suspected that these socioeconomic and public health issues may justify the high absolute numbers of deaths and a slight trend reduction in mortality after 2008 (-1%) compared to other Brazilian states with better health conditions and which presented better outcomes 17.
The highest stroke mortality rates were found in older age groups, mainly over 60 years old. Worldwide data demonstrate similar findings with higher stroke mortality with advances in age 5. In a study carried out by Purroy et al. 29, from data extracted from the Spanish Stroke Registry, almost 1 in 3 stroke patients were 80 years of age and over. These findings corroborate those found in this study. They may be related to the increase in life expectancy in recent decades and the higher number of comorbidities and risk factors accumulated with aging, with the elderly population being at greater risk for stroke.
Rexrode et al. 30, studying the impact of sex on stroke in the USA, describe that women have worse outcomes in relation to mortality and quality of life. Still, studies carried out in other parts of the world have observed higher mortality for men. When analyzing mortality trends by sex resulting from stroke in these same time series, a decreasing trend is evident for both sexes 9-12. In the state of Pará, however, the decreasing trend in stroke mortality was only seen in females. The male sex showed an increasing trend until 2009 and subsequently remained stationary. This is associated with the fact that in 2021, males had 19% more deaths compared to females, requiring temporal monitoring to assess the maintenance of this trend.
Regarding the years of potential life lost, in the statistical analysis using the average annual percentage change, an increasing trend in the number of YPLL is observed as the years of the time series advance (p < 0.001). Data from the World Bank between 1990 and 2019 showed a substantial increase in YPLLs due to stroke from 91.5 million to 125 million5. Given this, it is clear that the socioeconomic impact generated by stroke, both regionally and globally, is still growing.
The study was motivated by the representativeness of the number of deaths from stroke in Brazil and to better understand the health processes in the northern region, considering the scarcity of epidemiological data on this disease in the state of Pará. Based on this, this time series study was carried out, and a stationary trend in stroke mortality was found during the entire period. These findings show that despite advances in the health sector in the last 20 years, stroke continues to generate significant impacts, which appear to be more pronounced in areas of less economic power.
Regarding the study’s limitations, it is recognized that research on mortality trends only describes the trend and does not aim to explain it. Furthermore, it is emphasized that ecological studies such as this, using secondary data, do not allow access to individual information, considering the population group as a whole and not the particular differences of each individual. Another factor to be considered is the possibility of mistakes or delays in the cataloging of stroke cases by health professionals who provide care in the acute episode, as well as failures in the database’s operational system by the country’s official bodies.
CONCLUSION
The trend in stroke mortality in the adult population of the state of Pará was stationary in the time series from 2000 to 2021; however, after 2008, the mortality coefficients and the analysis stratified by age group showed decreasing mortality trends. Despite this, the absolute number of deaths and years of potential life lost are high, reinforcing the socioeconomic impact of stroke.
The study contributes to a better knowledge of the epidemiological outcomes of stroke in Pará. This allows comparison with other federation states, reiterating the need for public actions to implement a healthy lifestyle and early and effective outpatient treatment of modifiable stroke risk factors. It also demonstrates the importance of adequate hospital care in acute events, which can minimize the consequences for affected individuals and reduce mortality rates.

