


 texto em
  Inglês (pdf)
 Artigo em XML
 Referências do artigo

 Permalink
In the first decade of the 2000s, the Brazilian vehicle fleet substantially increased – the number of motorcycles went from almost 34.9 million units in 2001 to 76.137.125 in 2012, according to data from the National Institute of Science and Technology (Instituto Nacional de Ciência e Tecnologia & Observatório das Metrópoles, 2013). It represents an increase of 218.1% (97 million motorcycles) higher than the population growth, which was 0.82% (Instituto Brasileiro de Geografia e Estatística, 2016). According to Seguradora Líder, responsible for the Personal Injuries Caused by Land-Based Automotive Vehicles (in Portuguese, Danos Pessoais Causados por Veículos Automotores de Via Terrestre [DPVAT]) insurance of cases of traffic accidents throughout the country, the number of motorcycle accidents in Brazil with victims was more than 190 thousand people in the last ten years.
Consequently, linked to this growth, the number of victims in traffic accidents increased to the impressive number of 32,879 deaths in 2019, according to the Atlas da violência 2020 (Instituto de Pesquisa Econômica Aplicada, 2020). In general, the epidemiological profile of these victims is that of young people under 30 years old, male, mostly from the South-Central region of the country, with the state of São Paulo representing the capital with the highest number of traffic accidents. It should also be noted that according to the Institute of Applied Economic Research (Instituto de Pesquisa Econômica Aplicada [Ipea]), on average, the nation spends more than BRL 8,000 per person on the costs associated with accidents, thus suggesting that vehicle traffic and its successive accidents constitute a serious public health problem.
Regarding research on factors associated with accidents and consequent indicators of mortality in traffic, it is possible to verify the existence of divergences. For example, concerning the age factor, in Brazil, there were 264,643 deaths of people aged from ten to 29 years between 1996 and 2015. On average, 36 young people died in traffic accidents per day, reinforcing the understanding that young people are one of the most affected groups among the population in traffic accidents (Moreira et al., 2018).
Santos et al. (2016) believe that the increase in the number of accidents with elderly individuals, as well as the occurrence of deaths, can be credited to a multiplicity of factors, such as anatomical (bad eyesight, decreased cognitive reflexes, hearing problems) and functional (symptoms associated with diseases, such as muscle tremor or sudden illness, such as glycemic crises) changes linked to accidents, in addition to the association with possible safety issues on public roads. Monteiro and Rueda (2015) also confirmed that as age increases, it is possible to identify a decrease in performance in attention tests, pointing to a statistically significant difference between different age groups. These indications raise the need for a better understanding of the traffic behavior phenomenon.
In this regard, Brazil can be a contributor to research on factors associated with accidents and the consequent prevention, as it performs a psychological expertise service in the context of traffic to obtain the national driver’s license (in Portuguese, Carteira Nacional de Habilitação [CNH]). However, there is no initiative by the competent bodies to study these data. Such a survey could effectively point the profile of vehicle drivers in the country, helping to devise more effective strategies for traffic management, since from this assessment process it is possible to identify cognitive aspects, critical judgment/behavior, and personality traits. Such a task is regulated by the National Council of Traffic (Conselho Nacional do Trânsito CONTRAN]), supervised by the Federal Council of Psychology (Conselho Federal de Psicologia [CFP]), as well as by the regional councils of psychology, in compliance with the Resolution No. 01, of February 7th, 2019.
Still having as reference the Resolution No. 01 of 2019 of the CFP, an interview is used as an evaluative parameter of the behavioral variables, allowing for the use of hypothetical situations that deal with appropriate reactions or decisions in situations in traffic and reaction time. In this case, the psychologist should also gather information concerning the candidate’s history of traffic accidents and opinions about citizenship and urban mobility. This critical topic of assessment makes clear the importance of behavioral factors.
Such statement can be confirmed when assessing, for example, the behavior of young people, who tend to present risky behaviors, a feeling of omnipotence, overestimation of their abilities, little experience and ability to drive, which are configured as risk factors for involvement in traffic accidents (Moreira et al., 2018). Thus, it is possible to conclude that, to better understand the traffic scenario, it is necessary to assess individuals and their behaviors.
Thus, for an effective evaluation of the candidate for the CNH and the licensed driver, psychologists must base their decision on fundamental sources of information, according to the CFP Resolution No. 009/2018 or others that may replace or amend it. In this case, it is necessary to use psychological tests as resources with the objective of predicting the ability to drive, particularly in the sense of predicting the probability of an individual beinginvolved in accidents, which has undeniable importance in this process (Aparecida et al., 2018; Silva et al., 2018). However, there are few studies regarding the adequacy and standardization of the instruments used to assess drivers.
In Brazil, although drivers assessment has been mandatoryfor decades, there have been few studies on the effectiveness of the assessment process or even studies on the results of these tests, which could help to outline a profile of drivers. From the beginning, when the driver psychological assessment process was known as psychometric test applied to traffic, psychology professionals had difficulties in accurately answering what in the tests could characterize the suitability or not for obtaining a license (Alchieri & Stroeher, 2002). There is a lack of conclusive studies that investigate professional drivers, injured drivers or traffic offenders, and licensed drivers (Silva & Alchieri, 2008). This reinforces the need for more studies involving greater sample diversity and investigations of adequacy not of the instruments for use in this specific context but the evaluation procedures and results obtained by using tests (Nakano & Sampaio, 2016).
Thus, the literature shows that even understanding the importance of psychological assessment as a process supported by methods and techniques in a scientific way that makes it possible to use psychological instruments in contexts such as traffic, this is still a process reduced to testing (Ferreira et al., 2021). Therefore, it would be very important to use tools that help to understand the behavioral variable, thus being able to support the interview stage.
Regarding the assessment of these behavioral aspects, it is possible to point some psychometric instruments, such as the Driver Behavior Questionnaire (Questionário do Comportamento do Motorista [QCM]), adapted and validated for the Brazilian reality by Veiga et al. (2009). The QCM presents a complete structure, with a psychometric validation process, composed of three factors (errors, lapses, and traffic offenses), however, it is too large, not respecting the principle of parsimony. Another measure is the Motorcycle Rider Behavior Questionnaire translated and adapted by Coelho et al. (2012) to the Brazilian version. However, the authors did not present psychometric studies.
However, these instruments do not present an evaluation of the CFP based on the Psychological Tests Evaluation System (Sistema de Avaliação de Testes Psicológicos [SATEPSI]). In this sense, the ImpuIsivity Assessment Seale (Escala de Avaliação da Impulsividade) - forms A and B(EsAvl-Aand EsAvl-B) by Ana Cristina Ávila-Batista and Fabian Javier Marin Rueda, approved in 2012 by Satepsi, can be highlighted, as it assesses impulsivity in individuals aged between 18 and 41 years. This measure is valid until 2032 and can effectively be used as a psychological instrument.
In the international scenario, since the 1980s, it has been possible to identify psychometric-based studies in the literature, such as the research by Rushton et al. (1986), who developed the Altruism and Aggression: The Heritability of Individual Differences measure, which is used to assess altruistic behavior in vehicle drivers. The authors started from the premise that, by identifying the existence or lack of concern for the other, it is possible to assess the profile of the drivers. Their research highlights a factor that has not been evidenced as a relevant construct in traffic, which seems to bea mistake, consideringthat concern for others can reduce the incidence of accidents.
Another factor related to traffic behavior assessed through a scale was impulsivity, using the Impulsive Driver Behavior Scale (Biçaksιz & Özkan, 2016), a scale composed of motor impulsiveness, impulsive attention, and lack of impulsive planning. Impulsiveness was understood in this study as the ability to act impulsively or inconsequentially. One measure that seems to assess a similar construct is the measure by Zhang et al. (2016), which assesses the driver’s potential for aggressiveness.
Ostapczuk et al. (2017) validated a version of the Driver Skills Inventory and the Driver’s Social Desire Scale for Germany. In this context, the measures were able to assess the driving behavior dimensions with relevant psychometric properties. However, its focus is on the study of personality correlated with demographic variables of drivers, potentiating sensation-seeking personality types.
Özkan and Lajunen (2005) validated the Positive Driver Behaviours Scale (DBQ), which measures positive traffic behaviors. Although the DBQ is structurally very similar to the QCM and it was published before the study by Veigaetal. (2009), it was not even mentioned in referred research. The DBQ measure by Özkan and Lajunen (2005) has three factors that assess errors, violations, and positive behaviors, with 38 items and 34.22% of explained variance.
Thus, when assessing the current psychometric tools capable of explaining the traffic context, the DBQ by Özkan and Lajunen (2005) – the Positive Behaviours Scale (PBS) – was taken as a reference. Therefore, the objective of this study is to adapt and validate this measure, gathering psychometric evidence about PBS for the Brazilian context.
Method
This research is part of a broader study entitled Elaboration and development of a psychological assessment protocol for drivers (in Portuguese, Elaboração e desenvolvimento de um protocolo de avaliação psicológica para condutores), approved by the Research Ethics Committee of the Onofre Lopes University Hospital of the Federal University of Rio Grande do Norte (Hospital Universitário Onofre Lopes da Universidade Federal do Rio Grande do Norte [HUOL/UFRN]): Certificate of Presentation for Ethical Appreciation (Certificado de Apresentação para Apreciação Ética [CAAE]) No. 42846614.2.0000.5292. For its development, a process of translation and cross-cultural adaptation was necessary, considering that cultural and regional realities may present discrepancy (Khouri & Silva, 2019).
Participants
A total of 204 subjects voluntarily participated in the research, with an average age of 35.6 years old (SD = 10.12; ranging from 22 to 62 years), mostly males (65.7%). Of these individuals, 50% declared being single, with 65% being from the Northeastern region (25% from Piauí, 15% from Paraíba, and 15% from Bahia) and 20% from the Southeastern region (10% from the state of São Paulo and 10% from Rio de Janeiro), and the remaining 15% were from different states (5% from Mato Grosso and 10% from Amazonas). From the total sample, 67.2% reported having completed higher education.
Another relevant information is that 82% reported being part of the middle class. Most drivers reported using their own car as a means of transportation (76.5%) and that they only use their cars to go around (92%), not using the vehicle for work purposes. When asked about how much they considered themselves defensive drivers, on a scale from zero to ten, where zero would be not defensive at all and ten very defensive, most answers were between eight (32.8%) and nine (35.3%), although 63.7% indicated that they had already been in a traffic accident.
Instruments
The QCM by Veiga et al. (2009) was used as an instrumental basis for the development of this research, as well as the PDBS by Özkan and Lajunen (2005) and a sociodemographic questionnaire (of our own authorship).
Driver Behavior Questionnaire – Questionário do Comportamento do Motorista (QCM) (Veiga et al., 2009): it was used to check the correlational potential with the PDBS, aiming to obtain construct validity. It consists of 67 items, divided into three factors: errors, lapses, and violations. This measure uses a six-point Likert scale (never = 1, almost never = 2, occasionally = 3, with some frequency = 4, often = 5, almost always = 6).
Positive Driver Behaviours Scale – PDBS (Özkan & Lajunen, 2005): it was originally composed of 38 items. It has three well-defined factors: violations (13 items such as 24 – “l disregard the speed limit on a residential road”; 18 – “l use high-beam headlights to disturb oncoming drivers”; 22 – “l let a driver using high-beam headlights pass me, then I experience the same”), error (eight items, such as 09 – “l turn right even though I can run over cyclists”; 03 – “l fail to see pedestrians passing by”; 02 – “l brake hard in traffic jams, almost crashing the vehicle ahead”), and positive behaviors (12 items, such as 27- “l use high-beam headlights less often to help other drivers”; 36 – “l park the car cautiously to leave the lanes clear”; 33- “l return to my lane so as not to disturb the driver behind”). No indications of internal consistency of the measure were identified. However, it presented a factorial structure, having been tested and validated and presentingan explained variance of 34.22%.
Sociodemographic questionnaire: this tool made it possible to get to know the participants better, allowing for the collection of data such as sex, age, education, incidence of accidents, type of vehicles driven, and how much the participants considered themselves to be defensive drivers. This tool was developed by the researchers of this study.
Procedures and data analysis
This study respected all research ethics criteria, safeguarding anonymity and voluntary participation. The self-administered measures were conducted through online collection (social media or e-mail) using the snowball method, in which people invited to participate invited their acquaintances to contribute to the research.
Theinitial step was the process of translating and adaptingthe measure. This stage was divided into three consecutive moments. In the first phase, two independent translations of the original version into Portuguese were carried out. One of the translators was a bilingual person with expertise in psychometrics, and the second translator was a specialist in translating texts into Portuguese. The researchers tried to consider the original structure, however, still considering the indications of the assessors, the following items were excluded: 03 (“l fail to see pedestrians passing by”), 06 (“l brake hard on a slippery road”), 10 (“l do not pay attention to ‘give way’ signs”), 25 (“l do my best not to get in the way of other drivers”), 32 (“l reduce my speed to help the driver trying to overtake me”), and 38 (“l pay attention to potholes, so I do not splash water on pedestrians or other road users”). In the next phase, researchers tried to relate the two translations by uniting them based on the interpretation of two colleagues. The last step consisted of a detailed reading by the researcher responsible for the study, who is a specialist in traffic psychology and psychometrics, having chosen to exclude items 22 (“l let a driver using high-beam headlights pass me, then I experience the same”), 34 (“l thank the driver who helped me by waving at them”), and 36 (“l park the car on another road, leaving free movement for other users”), in an attempt to make the instrument more parsimonious and comprehensive.
After this process of translation and adaptation, the measure still went through a stage of semantic analysis, bringing together a group often people of different ages to respond to the instrument and indicate possible terms that could be misunderstood. The necessary adjustments were made, and item 29 (“l use turn signals to help the driver behind, who may not have a good view”) was excluded.
Before responding to the instrument, the participants read the first stage of the research and signed the Informed Consent Form. Only after confirming their interest in participating, the research began. For data analysis, the Statistical Package for the Social Sciences (SPSS) software, version 21, was used, with analyses of frequency, means, and SD, in addition to correlational analyses, t tests, exploratory factor analysis, and internal consistency.
Results
The first stage of the appreciation was an analysis of the items’ discriminative power, carried out using a t statistic. Such analysis allowed the researchers to identify the discrimination of the items from the total sum of the responses and the creation of a criterion group using the median of responses as a basis. From these criteria, with scores above and below the median, it was identified that the measure could discriminate between high or low scores. In this analysis, nine items (01 – “l drink and drive”; 04 – “l honk to show that I am annoyed”; 05 – “l fail to check the rearview mirror”; 07 – “l swerve the vehicle and force other drivers out of the road”; 26 – “l let other drivers pass”; 27 – “l use high-beam headlights less often to help other drivers”; 30 – “l avoid using the left lane to facilitate the flow of traffic”; 31 – “l avoid tailgating so that I do not disturb the driver ahead”; 33 – “l return to my lane so as not to disturb the driver behind”) were excluded, leavinga total of 19 items.
The next step was to analyze the factorability of the matrix using the Kayser-Meyer-Olkin (KMO) sample adequacy test. The KMO works with the partial correlation indicator, with results above .70 being marginally acceptable results (Dancey & Reidy, 2019). The measure showed that a KMO = .75 was considered meritorious. In addition, Barlett’s sphericity test was 3168.264 (gl = 171, p <.001).
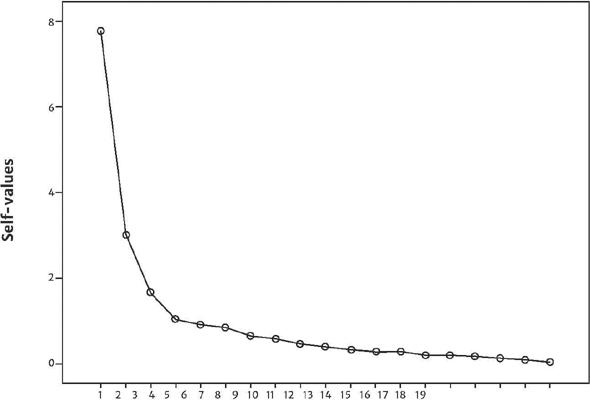
With these results, it was possible to run an exploratory factor analysis using the main-axis factorization method, the first step to define the number of factors extracted from the measure. The criteria considered in this study were Kaiser’s criterion, Cattell’s criterion, and the parallel analysis criterion. In Kaiser’s criterion, it was possible to identify that the instrument could have up to four factors (7.77; 2.99; 1.65; 1.04), given that self-values equal to or greater than 1 in this criterion indicate the possibility of com posing a factor. Cattell’s criterion indicated the possibility of the measure being composed of three factors, as seen in Figure 1.
Considering that the interpretation of the criteria already presented may not be accurate, the researchers decided to test a parallel analysis (Horn’s criterion) that comprises a more efficient procedure using the parameters of the original database (204 participants and 19 items). A total of 1,000 simulations were run, comparing the self-values generated randomly with the results obtained in the factor analysis. It was identified that the fourth simulated value is greater than the fourth value obtained in the factor analysis (1.58; 1.46; 1,38; 1.30), indicating that the measure possibly has three factors.
The result obtained in the parallel analysis indicates that the tested measure has a structural similarity with the original measurement. However, when assessing the saturation criteria of the items, it was possible to observe that all the items saturate in the first factor, in this way, understandingthat, in order to make the measure more parsimonious, many items were excluded, an attempt to run a factor analysis was made, forcing the instrument to be composed of just one factor. The results can be seen in Table 1.
Table 1 Exploratory Factor Analysis
| Item | Factorial load | h2 |
|---|---|---|
| 09- I turn right even though lean run over cyclists | .81 | .65 |
| 16 – I cut off drivers who want to overtake me | .78 | .62 |
| 24 – I use high-beam headlights to disturb drivers in the opposite direction | .77 | .60 |
| 23 – I accelerate while another driver tries to overtake me | .72 | .52 |
| 14- I overtake other drivers on the right side | ,66 | .43 |
| 12- I get angry in traffic, and I chase otherdrivers until I overtake them | ,66 | .43 |
| 19 – I underestimate the speed of an approaching vehicle | .64 | .42 |
| 18- I showthat 1 am annoyed, indicating hostility | .62 | .39 |
| 02 – I brake hard in traffic jams, almost crashing the vehicle ahead | .59 | .35 |
| 20 – I disrespect the speed limit on the highway | .56 | .31 |
| 15 – I keep high-beam headlights on even if the oncoming driver turns off the high-beam headlights on their vehicle | .55 | .29 |
| 35 – I drive close to pedestrians, even if it is not my turn to move the vehicle | .55 | .30 |
| 37 – I avoid honking the horn so as not to bother the driver ahead, waiting for the other driver to move even after the green lights | -.54 | .30 |
| 13 – When someone is close to overtaking me, I accelerate at the last minute | .54 | .30 |
| 08- I disrespect the speed limit on residential streets | .54 | .29 |
| 28 – I avoid using the horn to avoid making noise | -.52 | .27 |
| 17 – I keep my high-beam headlights on if the other driver does not turn their vehicle’s high-beam headlights off | .49 | .24 |
| 21 – I reduce my speed to show that I am not pleased | .46 | .21 |
| 11 – I try to overtake even knowing that the person will turn left | .44 | .19 |
| Self-values | 7.77 | |
| Explained variance | 37.9 | |
| Number of items | 19 | |
| Cronbach’s alpha | .90 |
Through the analysis of Table 1, it is possible to identify that the instrument presented a satisfactory single-factor structure, enabling researchers to verify that the 19 factors have a saturation greater than .40 and that the Cronbach’s alpha internal consistency index presents an excellent result (a = .90). Another important factor is that even with fewer items and a structure composed of a single factor, the measure still showed an explained variance higher than the original measure (37.9%).
After this factor analysis process, Pearson’s correlational analysis was performed considering the sum of all items of the QCM (Veiga et al., 2009) and the general factor of the PDBS, with a moderate correlation of r = .60, p < .001 being identified. Another result that drew the researchers’ attention was that, when comparing the results of motorcyclists and car drivers through a Student’s t test, it was possible to identify that motorcyclists have more expressive results (M = 2.45) than car drivers (M = 1.61), t = 7.08, and p < .001, which may indicate that motorcyclists are more susceptible to committing infractions.
Discussion
The results obtained were satisfactory. Although the measure did not preserve its original structure, it presented consistently a unifactorial structure with 19 items, which means that the initial proposal was respected: to obtain a parsimonious measure. Another important element to be highlighted is that the statistical indicators were meritorious.
It is im portant to high light that the PDBS, named ECPD in the Portuguese version, has a wide possibility of use in the most diverse areas, such as medicine, engineering, nursing, urban management, among others. Even the Brazilian Association of Traffic Medicine (Associação Brasileira de Medicina de Tráfego [ABRAMET]) has encouraged other areas besides medicine to develop studies in this field, so that this measure can be a potential reference.
Regarding the instruments capable of assessing human action, their forms of moving around, and what this entails for their lives, apparently, research has been developed in the international context, as demonstrated by the study by Chang et al. (2019). However, the attempts of Brazilian researchers to study and unravel the peculiarities of human behavior in traffic seem to be incipient.
Thus, the results obtained in the present research are promising, with satisfactory validation indicators, although confirmatory studies must be developed to test the reduced structure. However, it should be noted that there have been no attempts in Brazil to make measures like this more parsimonious. Inaddition, there is a limited number of adaptation and validation studies in this context. More specifically regarding the structure, at first, the statistical indicators pointed to several different factors, however, as Pasquali (2010) states, in addition to the numerical indicators, there is a theory behind the instrument, as it is also possible that the variability sampling and culture have somehow interfered in this process.
The PDBS focuses on the unwanted practices of vehicle drivers, which is a strenght, given that drivers’ infractions have increased in a concatenated way with the unruly growth of cities, as the destructuring of municipalities seems not to have accompanied urban growth, since the lack of information and traffic management, unfortunately, characterize the circulation of vehicles in Brazilian municipalities. This indicator makes it difficult to develop actions to improve the flow of vehicles and pedestrians, as well as it increases the incidence of accidents on traffic roads (Souza & Rosa, 2015).
Given that, it is understood that the PDBS has substantial value and could be used, for example, in public surveys by state agencies in order to get to know Brazilian vehicle drivers from the behavioral principle. Such a measure would be justified because, in Brazil, the process of obtaining the CNH is extremely technical, simply assessing psychological constructs, such as attention, logical reasoning, and personality. This does not mean that these variables are not relevant to be assessed, but the mere application of instruments that assess such aspects place the psychology professional in a purely technical or psychotechnical function, which is a serious mistake. According to Hutz et al. (2015), the mere application of a test is a technical process that differs from the psychological assessment. Thus, the questions are:
Drivers who obtain the CHN, in behavioral terms, cannot change over time, or do they remain psychologically balanced throughout their lives and able to drive?
Should this assessment process be taken on a regular basis or restricted to drivers of large vehicles or professional drivers?
These questions lack answers, and a driving behavior measure such as the PDBS could help to address them.
Therefore, the contribution of the present study is evident in an initial attempt to know the behavior of drivers and to validate the measure. However, it also has limitations. Among them, it is highlighted that the sample could have been more significant, which is justified by the difficulty of voluntary participation in research, possibly associated with the size of the instrument, something that generated mortality (people quitting the study). Another negative factor was the difficulty in controlling the sample, as it was not possible to have an equal sample between men and women, which made it difficult to assess the comparisons between groups, with the same happeningin relation to age groups. However, the negative aspects do not lessen the expressive results obtained.

